Introduction
Gold has long been regarded as a safe-haven asset and a store of value. Investors and traders closely monitor its price movements to make informed decisions. Gold price charts serve as a powerful tool for understanding market dynamics and predicting future trends.
Gold charts serve as powerful tools to decipher market trends and predict future price movements. By examining historical price data and patterns, you can gain valuable insights into the market's behavior. Whether you're a seasoned trader or just starting, understanding gold charts is essential.
In this blog post, we will explore key components of gold charts, such as support and resistance levels, trend lines, and technical indicators. We will discuss how to interpret these elements and identify potential buying or selling opportunities. With this knowledge, you'll be equipped to navigate the complex world of gold trading.
Understanding Gold Charts
A gold chart is a graphical representation of the price movement of gold over time. It displays the historical and current prices of gold, allowing you to visualize the trends, patterns, and volatility in the market. Gold charts serve as a valuable tool for investors, traders, and analysts who seek to understand the dynamics of the precious metal market.
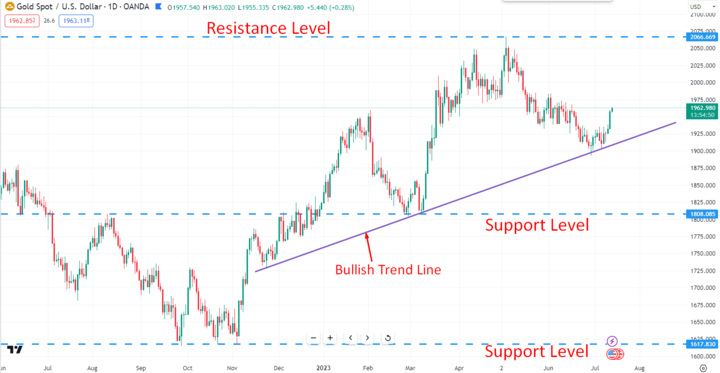
Image Source: TradingView
Gold charts hold immense significance for those involved in the gold market. They provide crucial insights into price trends, market sentiment, and potential price reversals. By analyzing gold charts, you can identify key support and resistance levels, spot trend formations, and gauge market momentum. This information empowers you to make informed decisions about buying, selling, or holding gold, maximizing your chances of profitability.
Furthermore, there are different types of gold charts commonly used for analysis. Line charts offer a simplified view of gold price movements by connecting the closing prices over a given period. Bar charts provide more detailed information, displaying the opening, closing, high, and low prices for each period. Candlestick charts, widely favored by traders, present a visual representation of price action using "candles" that indicate the open, close, high, and low prices.
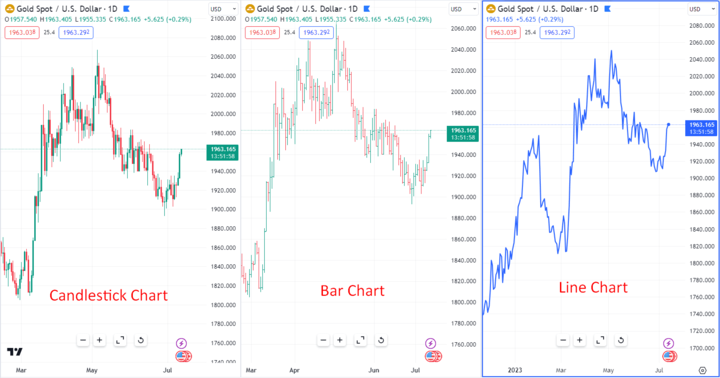
Image Source: TradingView
In recent years, gold prices experienced significant movements. In 2022, gold prices faced volatility due to global economic uncertainties and fluctuating inflation rates. However, by 2023, gold prices rebounded as investors sought refuge amid geopolitical tensions and the potential for market corrections. Understanding the intricacies of gold charts is essential for navigating the ever-changing gold market.
Components of a Gold Chart
A gold chart consists of two main components: the x-axis representing time and the y-axis representing price. By analyzing the intersection of time and price, you can gain insights into the historical and current price movements of gold.
Additionally, gold charts exhibit various chart patterns such as support and resistance levels, trendlines, and chart formations. These patterns help identify potential price reversals, trend directions, and market sentiment. Volume indicators and oscillators, including volume bars, OBV, RSI, and MACD, provide supplementary information by analyzing trading volume and price momentum. Understanding these components is essential for effective analysis of gold price charts.
A. X and Y-axis of a gold chart
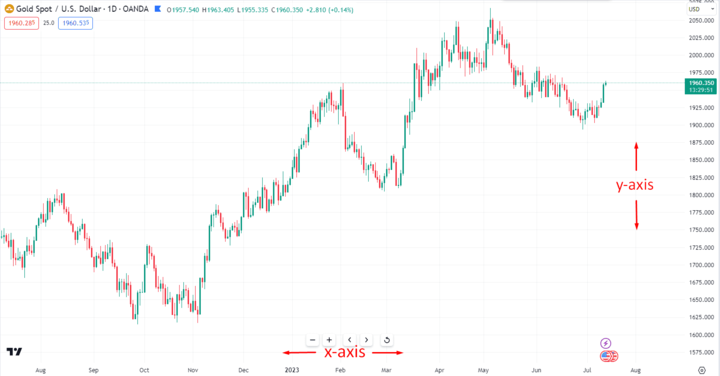
Image Source: TradingView
In a gold chart, the x-axis represents time, while the y-axis represents price. The x-axis is typically divided into intervals, such as days, weeks, or months, allowing you to observe how gold prices have changed over a specific period. The y-axis represents the price scale, showing the value of gold at different points in time. By analyzing the intersection of time and price, you can gain insights into the historical and current price movements of gold.
B. Chart patterns on a gold chart
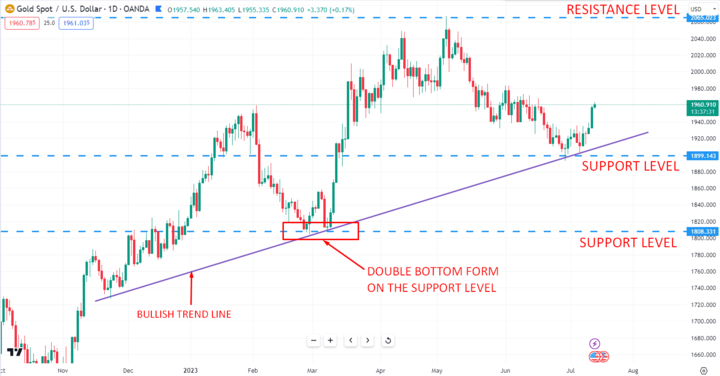
Image Source: TradingView
Gold charts reveal various patterns that can be instrumental in predicting future price movements. Support and resistance levels are horizontal lines drawn on the chart to identify price levels at which buying or selling pressure is significant. Trendlines help you identify the direction and strength of the prevailing trend.
Chart formations, such as head and shoulders, double tops or bottoms, and triangles, offer insights into potential reversals or continuations in price trends. Recognizing these patterns can guide your trading decisions and help you stay ahead of the market.
C. Significance of volume indicators and oscillators
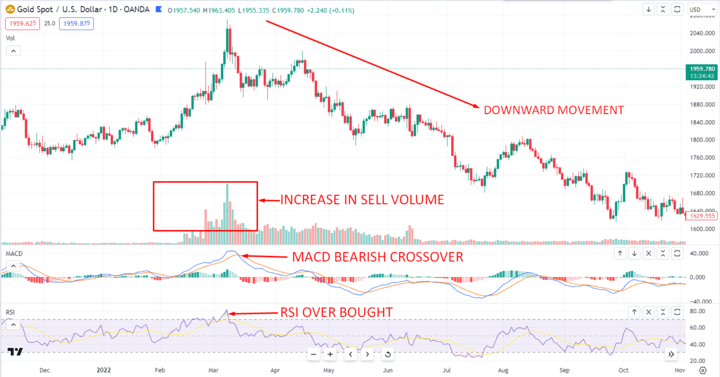
Image Source: TradingView
Volume indicators provide information about the number of shares or contracts traded during a given period. In gold charts, volume can indicate the strength or weakness of a price movement, confirming or diverging from price trends. Oscillators, such as the Relative Strength Index (RSI) and Moving Average Convergence Divergence (MACD), measure the speed and momentum of price changes.
They help identify overbought or oversold conditions, potential trend reversals, and divergences between price and indicator movements. Incorporating volume indicators and oscillators into your analysis can enhance the accuracy of your predictions and improve your overall trading strategy.
Types of Gold Chart Analysis
When analyzing gold charts, two common approaches are technical analysis and fundamental analysis. Technical analysis involves using indicators like moving averages, MACD, RSI, and Fibonacci retracement levels. Fundamental analysis considers economic factors, such as inflation and geopolitical events, to interpret the broader context of gold price movements.
A. Technical analysis and its application in gold chart analysis
Technical analysis is a popular approach to analyzing gold price charts. It involves studying historical price and volume data to identify patterns and trends that can help predict future price movements. Key technical indicators used in gold chart analysis include moving averages, MACD (Moving Average Convergence Divergence), RSI (Relative Strength Index), and Fibonacci retracement levels.
Moving Averages: Moving averages smooth out price fluctuations and help identify the underlying trend. The 50-day and 200-day moving averages are commonly used to determine the short-term and long-term trends in gold prices.
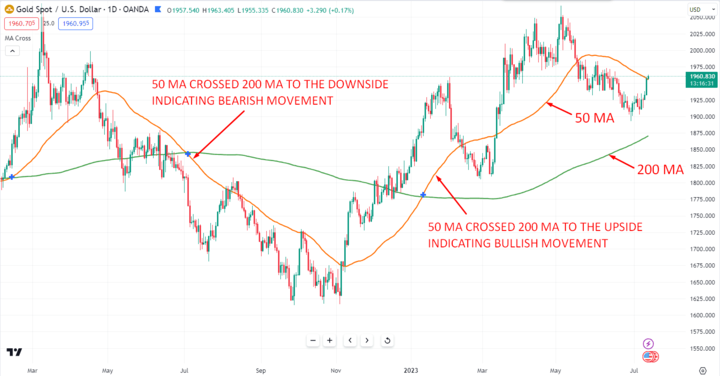
Image Source: TradingView
MACD (Moving Average Convergence Divergence): MACD is a trend-following momentum indicator that helps identify potential entry and exit points. It consists of two lines that represent the relationship between two moving averages. It helps identify potential trend reversals and generates buy or sell signals.
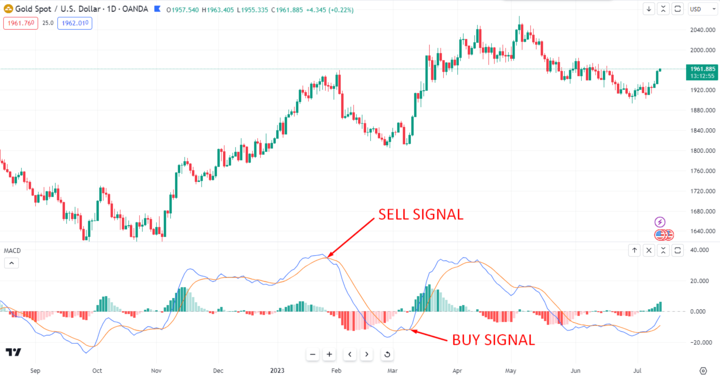
Image Source: TradingView
RSI (Relative Strength Index): RSI is an oscillator that measures the speed and change of price movements. It indicates whether a security is overbought or oversold, which can help identify potential reversals.
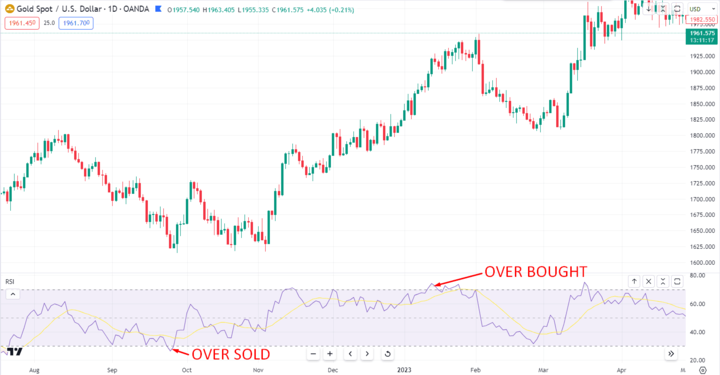
Image Source: TradingView
Fibonacci Retracement Levels: Fibonacci retracement levels are based on the Fibonacci sequence and are used to identify potential support and resistance levels. Traders often look for price reversals at key Fibonacci levels, such as 38.2%, 50%, and 61.8%.
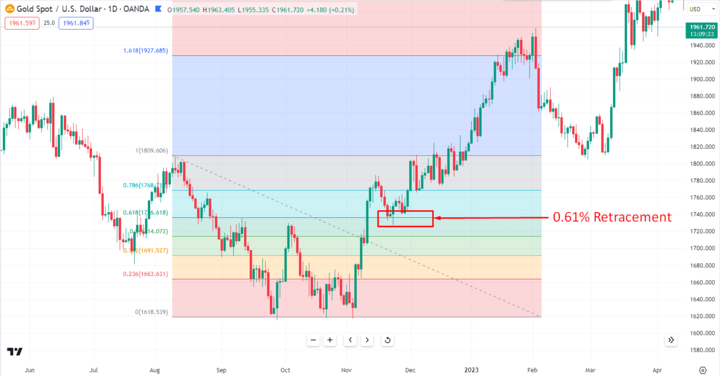
Image Source: TradingView
By utilizing these indicators, you can identify trends, reversals, and potential entry or exit points. For example, when the 50-day moving average crosses above the 200-day moving average, it signals a potential bullish trend, indicating a buying opportunity. Similarly, an RSI reading above 70 suggests an overbought condition, indicating a potential selling opportunity.
B. Fundamental Analysis in Interpreting Gold Charts
Fundamental analysis focuses on examining the broader economic factors that impact the price of gold. Understanding these factors can provide valuable insights into the context of gold price movements. Here are key economic factors that influence gold prices:
Inflation: Inflation erodes the value of fiat currencies and often leads to an increase in demand for gold as a hedge against inflation.
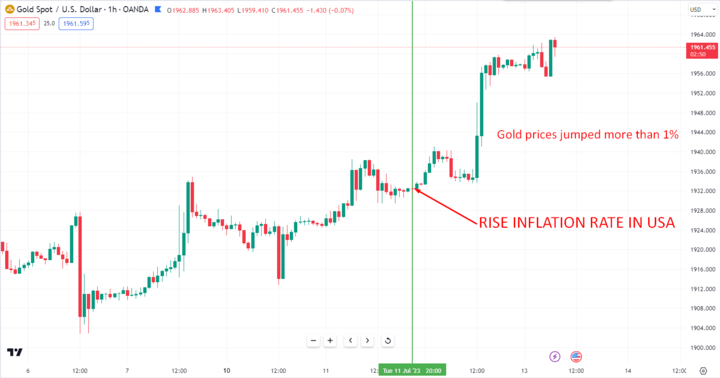
Image Source: TradingView
Interest Rates: Changes in interest rates can affect the opportunity cost of holding gold. When interest rates are low, gold becomes more attractive as an investment since it doesn't generate interest.
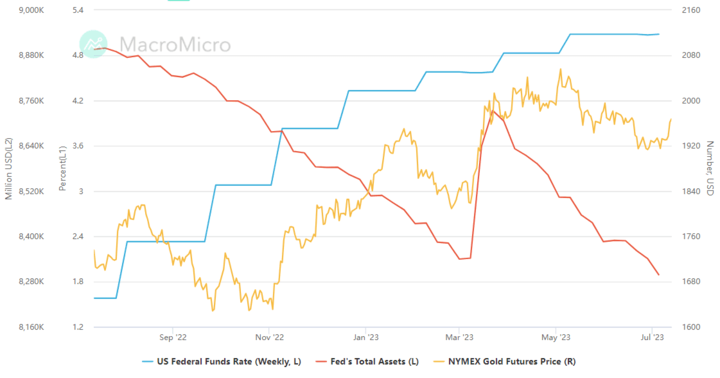
Image Source: Macromicro
Geopolitical Events: Political instability, conflicts, or economic crises can create uncertainty and drive investors toward the safety of gold.
Market Sentiment: Investor sentiment and market psychology play a significant role in gold price movements. Fear, greed, and market expectations can impact demand and supply dynamics.
Fundamental analysis helps you understand the underlying drivers of gold price movements, allowing you to make informed trading decisions. By monitoring economic indicators, news events, and central bank policies, you can anticipate potential shifts in gold prices and adjust your trading strategies accordingly.
Real-Life Examples and Case Studies
A. Different Chart Patterns in Gold Charts:
Head and Shoulders: This pattern consists of three peaks, with the middle peak (the head) being the highest, and the other two peaks (the shoulders) being lower and roughly equal in height. It indicates a potential reversal from an uptrend to a downtrend.
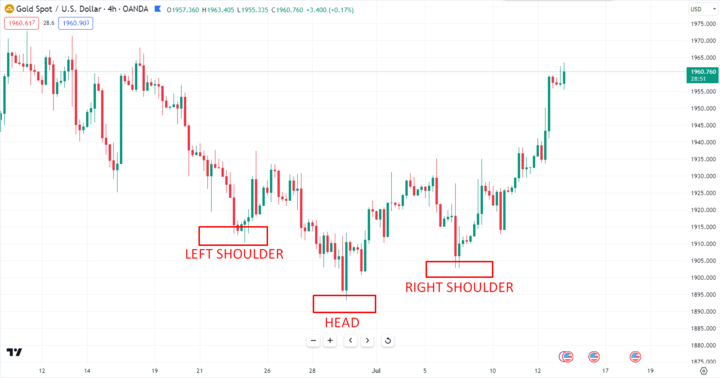
Image Source: TradingView
Double Tops/Bottoms: Double tops occur when the price reaches a high point, retraces, and then rallies again to a similar high before reversing. Double bottoms are the opposite, with two low points followed by a rally. These patterns suggest a possible trend reversal.
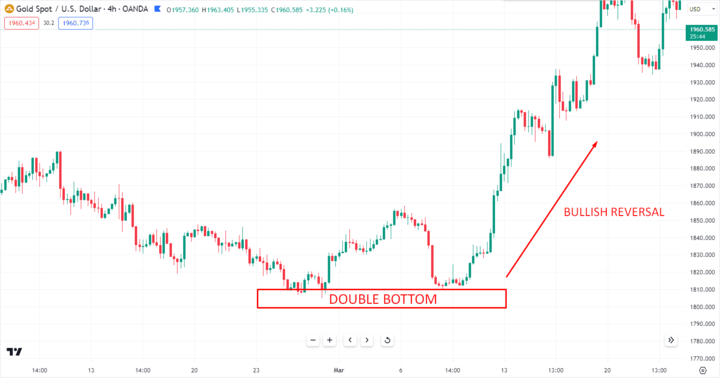
Image Source: TradingView
Triangles: There are different types of triangles, including ascending, descending, and symmetrical triangles. Ascending triangles have a horizontal resistance line and an upward-sloping support line, indicating potential bullish breakouts. Descending triangles have a downward-sloping resistance line and a horizontal support line, suggesting potential bearish breakouts. Symmetrical triangles have converging trend lines, indicating consolidation before a potential breakout.
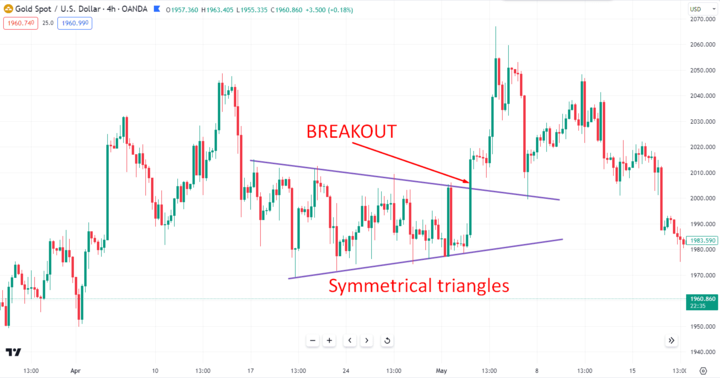
Image Source: TradingView
B. Insights and Trading Opportunities:
Chart patterns provide traders with insights into potential price movements and trading opportunities in the following ways:
Trend Reversal: Patterns like head and shoulders and double tops/bottoms indicate a potential trend reversal. Traders may look for confirmation signals, such as a break below the neckline in head and shoulders pattern or a break below the support level in double tops, to enter short positions. Conversely, a break above the neckline or resistance level may present a buying opportunity.
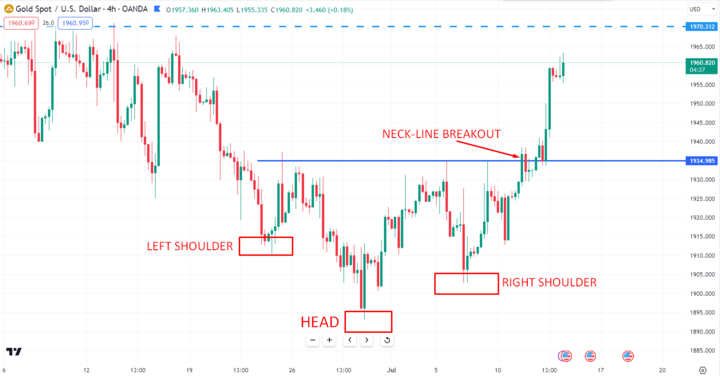
Image Source: TradingView
Continuation Patterns: Some chart patterns, like triangles, can signal a continuation of the current trend. Traders may wait for a breakout above the resistance line in symmetrical triangles or below the support line to enter trades in the direction of the prevailing trend.
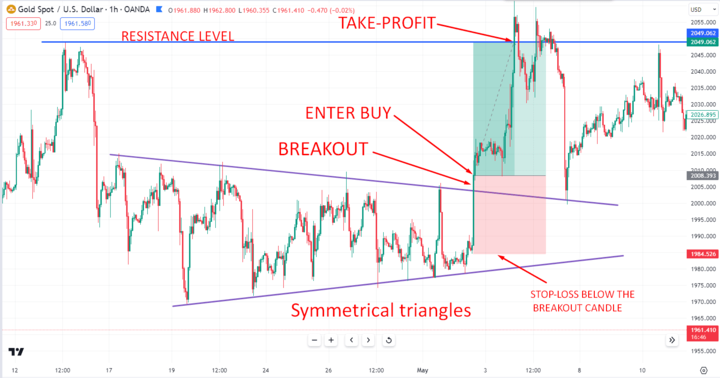
Image Source: TradingView
Stop Loss and Target Levels: Chart patterns provide traders with specific levels to set their stop-loss orders to limit potential losses. For example, in the head and shoulders pattern, the stop-loss order can be placed below the right shoulder. Traders can also use chart patterns to determine target levels by measuring the distance from the pattern's breakout point to its highest/lowest point.
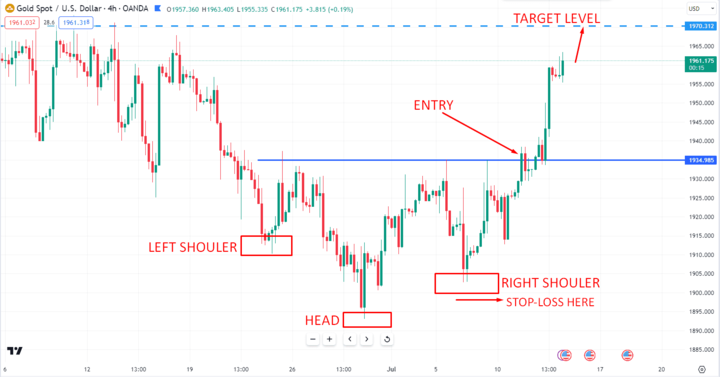
Image Source: TradingView
C. Case Studies of Gold Chart Analysis and Trading Strategies:
Head and Shoulders Reversal Chart Analysis: A head and shoulders pattern forms in a gold chart, with the head at $1,893, the left shoulder at $1,910.60, and the right shoulder at $1,902.90.
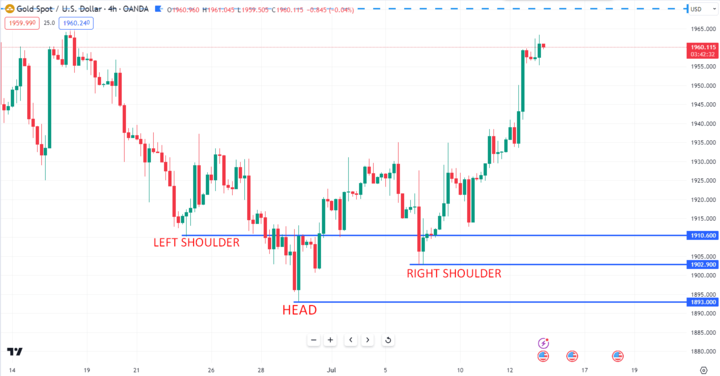
Image Source: TradingView
Trading Strategy: A trader identifies the pattern and waits for a break above the neckline at $1,934.90 as confirmation. They enter a long position with a stop-loss order below the right shoulder. The target is set based on the pattern's height, such as $1,976.
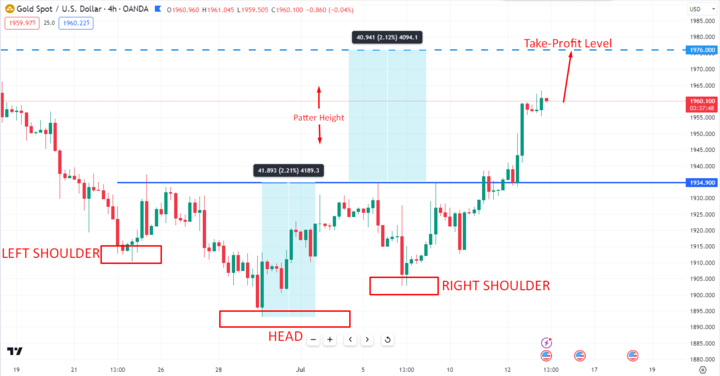
Image Source: TradingView
These case studies demonstrate how traders can apply chart pattern analysis to identify potential trading opportunities in gold charts. However, it's important to note that chart patterns are not infallible and should be used in conjunction with other technical and fundamental analysis tools for a comprehensive trading strategy.
Tools and Resources for Gold Chart Analysis
For gold chart analysis, utilize platforms and educational resources to provide valuable insights. Stay updated with market news, economic data, and geopolitical events to enhance your analysis. By doing so, you can enhance your gold chart analysis skills and make more informed trading decisions.
A. Popular Charting Platforms and Tools
When it comes to analyzing gold charts, there are several popular charting platforms and tools available:
TradingView: TradingView is a widely-used online charting platform that offers a range of technical analysis tools, indicators, and drawing features. It provides real-time data and customizable charting options for in-depth analysis.
MetaTrader: MetaTrader is a renowned trading platform used by many traders. It offers advanced charting capabilities, a wide range of technical indicators, and the ability to develop and backtest trading strategies.
Bloomberg: Bloomberg Terminal is a professional platform that provides comprehensive financial data, news, and analytics. It offers advanced charting tools and real-time market data, making it a valuable resource for in-depth gold chart analysis.

Image Source: Bloomberg
B. Educational Resources for Learning Gold Chart Analysis
To enhance your understanding of gold chart analysis, consider exploring educational resources such as:
Books: "Technical Analysis of the Financial Markets" by John J. Murphy and "Encyclopedia of Chart Patterns" by Thomas N. Bulkowski are highly regarded books that delve into technical analysis concepts and chart patterns.
Online Courses: Websites like Udemy and Coursera offer a variety of online courses on technical analysis and gold chart analysis. Look for courses taught by experienced instructors with positive reviews.
C. Staying Updated with Market News and Events
Staying updated with market news, economic data, and geopolitical events is crucial for gold chart analysis. Stay informed about factors that can impact gold prices, such as:
Market News: Follow reputable financial news outlets and websites to stay informed about current market trends, news, and analysis related to gold.
Economic Data: Keep an eye on economic indicators like inflation rates, central bank decisions, and GDP reports, as these factors can influence gold prices.
Geopolitical Events: Monitor geopolitical events, such as political tensions, economic crises, or trade disputes, as they can create market volatility and impact gold prices.
Conclusion


Throughout this blog post, we discussed the significance of gold charts in analyzing price movements. We explored the components of gold charts, types of analysis including technical and fundamental, and real-life examples of chart patterns.
Gold charts provide valuable insights into market trends, reversals, and potential entry/exit points. You can make informed trading decisions by utilizing technical indicators, recognizing chart patterns, and considering fundamental factors.
We encourage you to explore gold chart analysis as part of your investment or trading strategy. By understanding the secrets of gold price charts, you can unlock opportunities in the dynamic gold market. Remember to stay updated with market news, use reliable charting platforms, and continue learning to refine your analysis skills.