


Tron's performance in 2023 was marked by noteworthy achievements, most notably transactions worth billions of dollars. Despite surpassing the one-billion-dollar transaction milestone, examining the fundamental network metrics revealed specific deteriorations.
TRX Transaction Volume Soared
Tron recorded a total transaction volume of $2.3 billion in 2023, with a daily average of over $4.8 million as of the fourth quarter. However, the daily transactions fell by more than 25% year-over-year and by more than 2% in the fourth quarter of 2023 compared to the previous quarter.
Regarding fees, the fourth quarter of 2023 peaked at more than $331 million, a substantial increase from the roughly $92 million recorded in 2022. Active and new addresses experienced a decline as the year ended, with daily active addresses declining by more than 1%, representing a year-over-year decline of over 12%.
Tron's Total Value Locked (TVL) is Positive For Bulls
The number of daily new addresses followed a comparable pattern, diminishing by approximately 9% annually. Despite these negative metrics, Tron's Total Value Locked (TVL) demonstrated a positive trend, increasing by over 9 percent by the end of the fourth quarter.
The TVL exhibited a consistent upward trend throughout 2023, exceeding $8 billion by the end of the year and establishing a new high of over $8.3 billion on January 3rd before retreating slightly to approximately $8.1 billion in the most recent update.
Despite this volatility, there was a substantial increase from one year to the next, as the completely diluted market capitalization surged by more than 72% and the circulating capitalization surged by more than 65%.
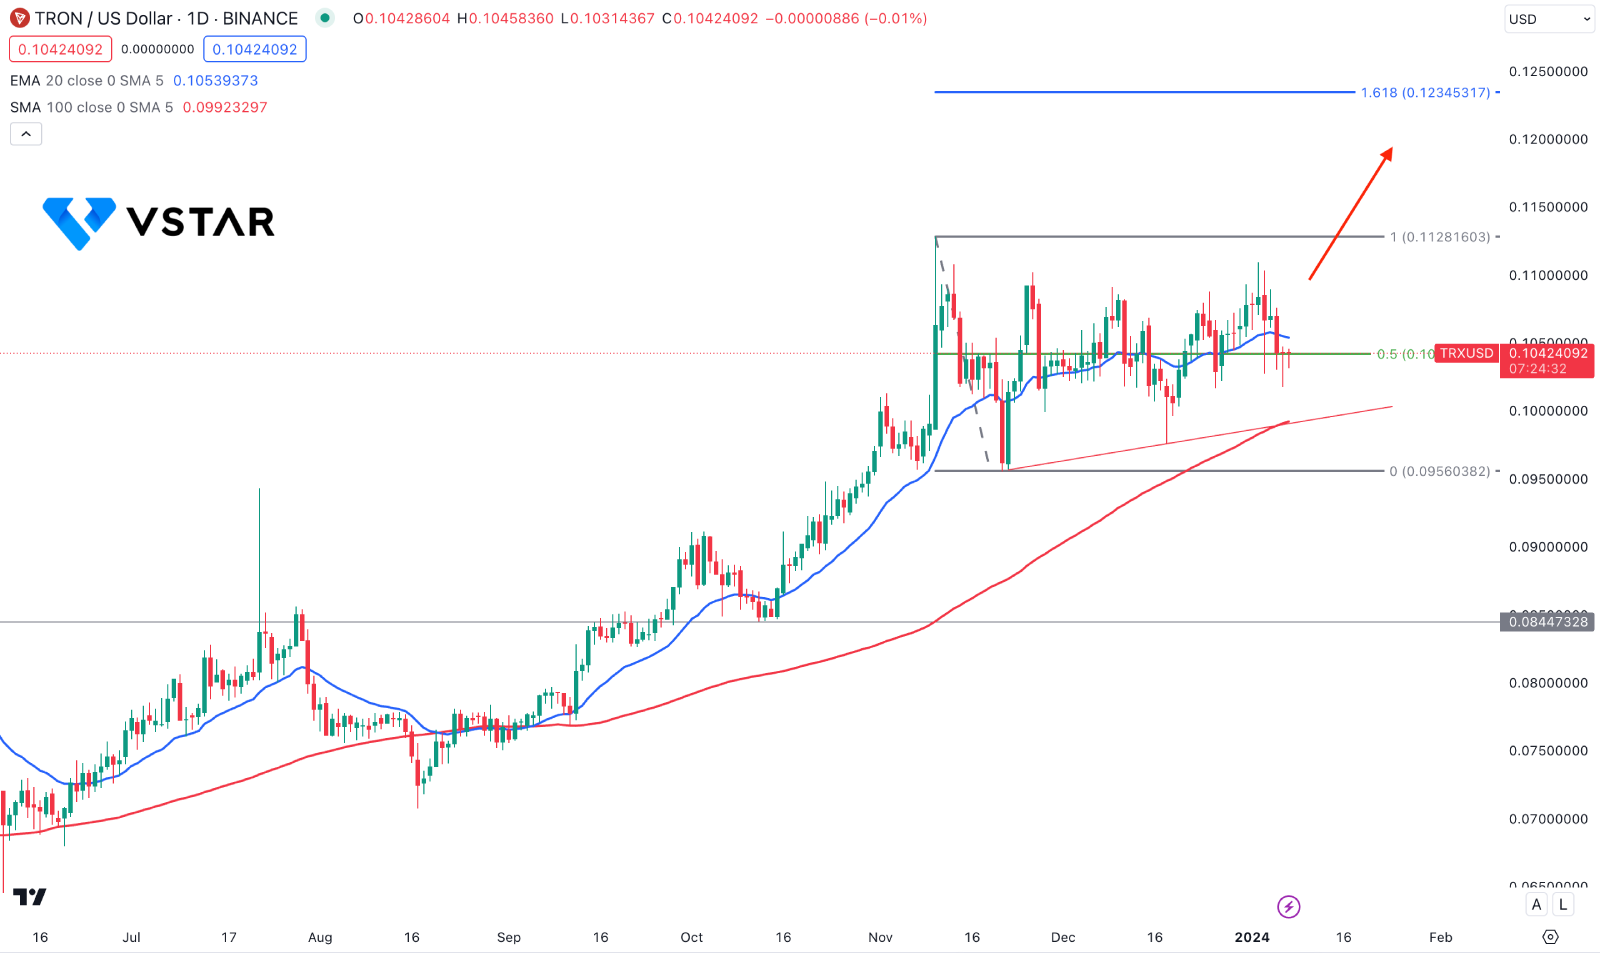
TRXUSD Technical Analysis
The broader market direction in the TRXUSD daily chart is bullish, supported by the rising dynamic 20-day EMA. Moreover, the bull run started on 16 August and consolidated in mid-November, indicating a bullish re-accumulation.
However, a downside correction is visible below the 20 DMA, but the 100-day SMA still works as a major support - the recent trendline support from the 0.0956 low works as a confluence support for bulls.
Based on this structure, a downside correction is possible towards the 100-day SMA, but any rebound from the 0.1000 to 0.0950 area could be a potential long opportunity. Moreover, any immediate upward pressure with a D1 candle above the 0.1105 high could initiate an aggressive long opportunity, targeting the 0.1234 Fibonacci Extension level.
On the bearish side, a daily close below the 0.0900 level could be an alarming sign to bulls as it may lower the price toward the 0.0844 support.


