I. Introduction
What is Gold CFD?
Gold CFD (Contract for Difference) is a financial derivative product used to speculate on the price movements of gold without owning the physical commodity. When trading a gold CFD, the trader agrees to exchange the difference in the price of gold from when the contract is opened to when it is closed.
Gold CFDs are traded on margin, meaning that the trader only needs to deposit a small percentage of the total trade value as collateral. It allows traders to amplify their potential profits but also increases their potential losses.
Gold CFDs are a popular trading instrument because gold is considered a safe asset that can retain value during times of economic uncertainty.
Importance of Understanding Historical Price Trends and Patterns When Trading Gold CFDs
Understanding historical price trends and patterns is essential when trading gold CFDs because it can provide insights into future price movements. By analyzing past price movements, traders can identify patterns and trends that may repeat themselves in the future, allowing them to make more informed trading decisions around entry and exit points for trades.
For example, if historical data shows that the price of gold CFDs tends to rise during economic uncertainty, a trader may choose to go long on gold CFDs during periods of heightened geopolitical tensions. On the other hand, if historical data shows that the price of gold CFDs tends to fall during economic stability, a trader may choose to short gold CFDs when economic indicators suggest a period of growth.
II. Historical Price Trends
Historical Price Trends of Gold CFDs
In 2018, the price of gold CFDs fluctuated between $1,200 and $1,350 per ounce due to uncertainty in the US-China trade war, which caused investors to turn to gold as a safe-haven asset. In 2019, the price of gold CFDs rallied to $1,550 per ounce due to the Federal Reserve's interest rate cut and the US-China trade deal.
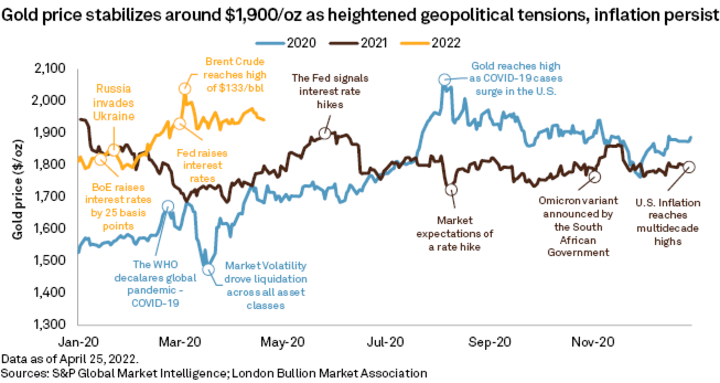
In 2020, the price of gold CFDs surged to an all-time high of $2,075 per ounce amid the COVID-19 pandemic, which created global uncertainty and economic instability. As central banks around the world implemented monetary stimulus measures, investors flocked to gold as a hedge against inflation.
During 2021, the price of gold CFD has moderated; it has fluctuated between $1,700 and $1,900 per ounce due to the COVID-19 vaccine rollout, increasing optimism about economic recovery, and a strengthening US dollar.
Then, during early 2022, gold CFD followed a bullish trajectory, hitting a high of $2050 in March, after which it experienced bearish prevalence till November.
Since November 2022, gold CFDs have been moving in bullish predominance as of now. However, with ongoing concerns about inflation, quantitative tightening, and geopolitical tensions, the price of gold CFDs is expected to remain volatile.
Impact of Economic and Geopolitical Events on the Price Trends of Gold CFD
Economic and geopolitical events significantly affect the price trends of gold CFDs. Gold is used as a safe asset that can retain value during economic and political uncertainty. Therefore, events that create instability and uncertainty in the global economy tend to increase demand for gold CFDs and drive up their price.
For example, interest rate decisions by central banks, changes in inflation rates, and geopolitical tensions can all affect the price of gold CFDs. A cut in interest rates or an increase in inflation rates can cause investors to turn to gold as a hedge against inflation, driving up its price. Similarly, rising geopolitical tensions, such as the US-China trade war or the Russian-Ukraine military conflict, can increase demand for gold CFDs as a safe haven asset.
Conversely, events that create economic stability and increase confidence in the global economy can lead to a decrease in demand for gold CFDs and cause their price to fall. For example, positive economic data, such as increased GDP or employment rates, can lead investors to shift away from gold and towards riskier assets.
Impact of the COVID-19 Pandemic, US Dollar Movements, and Interest Rate Changes
The pandemic had a massive influence on the price of gold CFDs. As the pandemic caused global economic uncertainty and instability, investors flocked to gold as a safe-haven asset. It led to a surge in demand for gold CFDs, driving their price to an all-time high of $2,075 per ounce in August 2020.
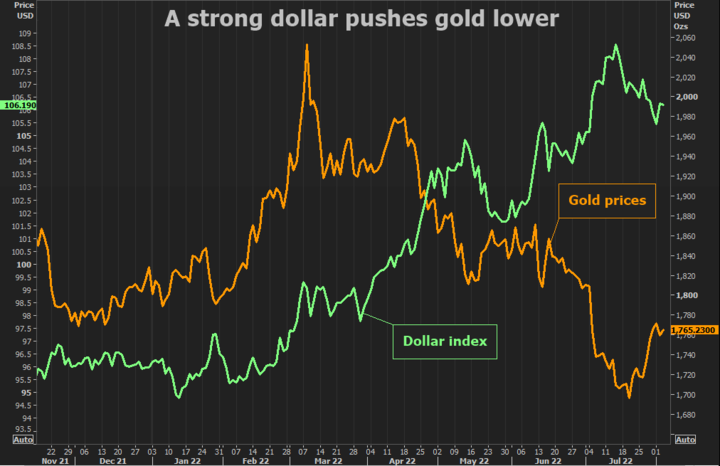
US dollar movements and interest rate changes also significantly impact the price of gold CFDs. When the US dollar strengthens, gold becomes more expensive for investors holding other currencies, reducing demand and leading to a decrease in the price of gold CFDs. That can be observed in the fall of gold CFD prices in 2022. Conversely, when the US dollar weakens, gold becomes more affordable, increasing demand and driving up the price of gold CFDs, as we experienced in 2023.
Changes in rates can also affect the price of gold CFDs. When interest rates are low, the opportunity cost of holding gold decreases, making it more attractive as an investment. As a result, the price of gold CFDs may rise; this can be observed in upward price movements during 2019 and 2020. Conversely, when interest rates are high, investors may choose to invest in other assets, reducing demand for gold CFDs and causing their prices to fall, as has been seen during the price fall of 2022.
The Long-Term Trends in Gold CFDs
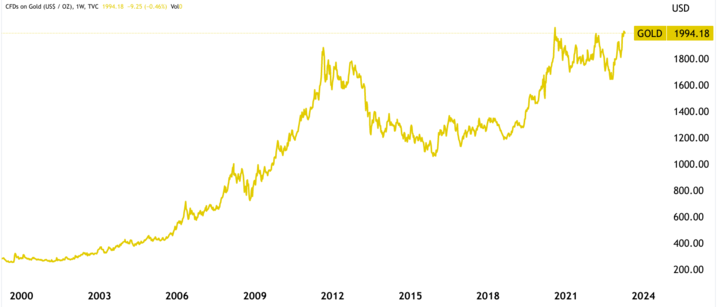
The long-term trend of gold CFDs has been characterized by periods of price volatility and significant price movements. Over the past several decades, gold CFDs have experienced both periods of sustained price increases and periods of substantial declines.
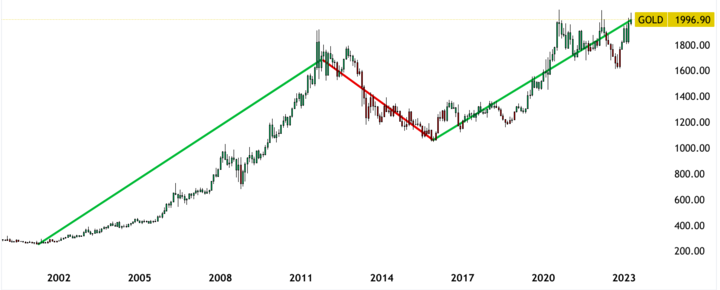
One example of a long-term price movement in gold CFD is the period from 2001 to 2011 when the price of gold CFD increased from around $300 per ounce to over $1,900 per ounce. This increase was driven by factors such as rising inflation, geopolitical tensions, and a weakening US dollar.
Another example is the period from 2011 to 2016 when the price of gold CFDs declined to $1050 from a peak of around $1,900 per ounce. The decline was caused by a combination of factors, including a strengthening US dollar, lower demand from emerging markets, and a shift toward riskier assets.
Once again, From 2016 to 2023, gold CFDs are following a long-term uptrend, including a short-term downtrend during 2022, due to rising inflation and quantitative tightening by central banks.
III. Price Patterns
Price Patterns in Gold CFD
Price patterns in gold CFDs refer to frequent price movements or formations that traders use to make trading decisions. One typical price pattern in gold CFDs is the identification of support and resistance levels.
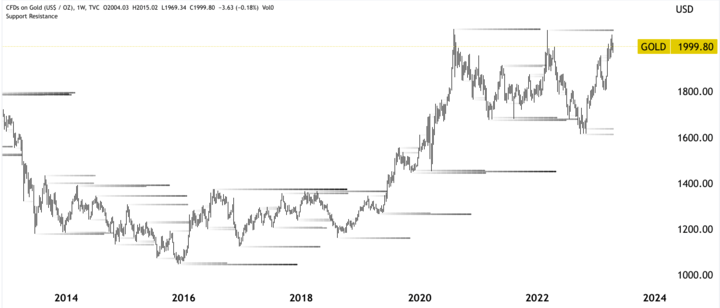
Support levels are price levels at which demand for gold CFDs is strong enough to prevent the price from falling further. Resistance levels, on the other hand, are price levels at which the supply of gold CFD is strong enough to control the price from rising further. These levels are often identified by analyzing historical price movements and chart patterns.
For example, a trader may decide to buy gold CFDs when the price reaches a support level, as they believe that demand will increase and the price will rebound. Conversely, a trader may decide to sell gold CFDs when the price reaches a resistance level, as they believe that supply will increase and the price will fall.
Importance of Identifying Price Patterns in Gold CFDs
Identifying price patterns in gold CFDs is essential for traders to make informed trading decisions. By analyzing historical price movements and chart patterns, traders can gain insights into the direction and strength of price trends in gold CFDs and use them to predict future price movements.
Identifying price patterns, such as support and resistance levels, can help traders determine optimal entry and exit points for their trades, as well as potential price targets and stop-loss levels. It can help traders manage their risks and maximize their potential profits.
Additionally, understanding price patterns can help traders develop trading strategies tailored to specific market conditions, such as trends, ranges, or breakouts. It can help traders adapt to changing market conditions and increase their chances of success.
Critical Price Patterns in Gold CFD
There are several commonly used price patterns in gold CFDs, each with unique characteristics and significance. Traders can use these patterns to analyze price movements and make informed trading decisions. Below are three examples of commonly used price patterns in gold CFDs:
Head and Shoulders
It is a reversal pattern that occurs after an uptrend. It can be identified by three peaks, with the middle peak (the head) being the highest. The other two peaks (the shoulders) are lower than the head and roughly equal in height. The pattern is complete when the price breaches below the neckline, through the lows of the shoulders.
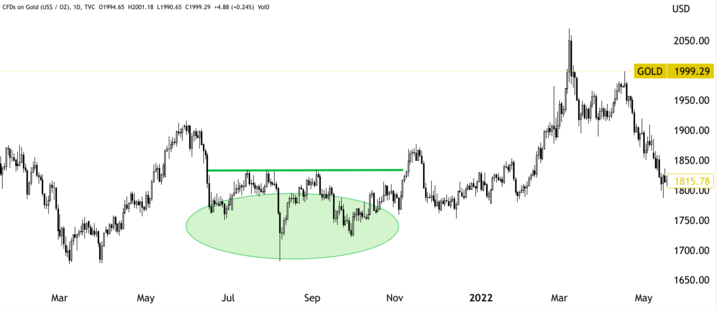
Example: In mid-2016, the price of gold CFDs formed a head and shoulders pattern, with the neckline around $1,250 per ounce. After the price broke below the neckline, it continued to decline sharply, reaching a low of around $1,120 per ounce in late 2016. Similarly, from July to October 2021, a reverse head and shoulders pattern emerged that resulted in a rapid price rise until March 2022 after breaking the neckline in November 2021.
Double Top/Double Bottom
It is also a reversal pattern that occurs after a trend. The double-top pattern is characterized by two peaks of roughly equal height with a trough in between. The double bottom pattern is the inverse, with two troughs of roughly equal depth and a peak in between. The pattern is formulated when the price breaks below the trough (double top) or above the peak (double bottom).
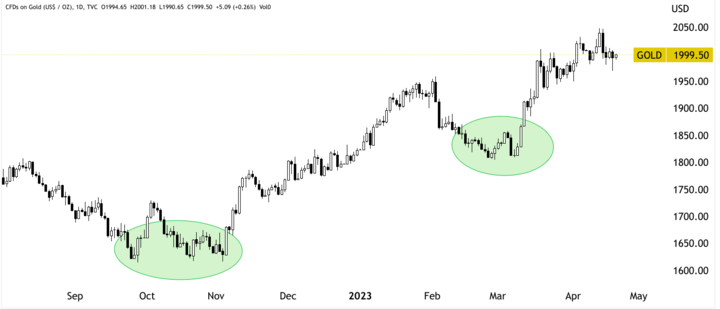
Example: In early 2020, the price of gold CFDs formed a double-top pattern, with two peaks around $1,610 per ounce. After the price broke below the trough, it declined sharply, reaching a low of around $1,450 per ounce in mid-2020. Similarly, from September to November 2022, a double bottom pattern can be identified in the gold CFD prices that led to the current bullish momentum.
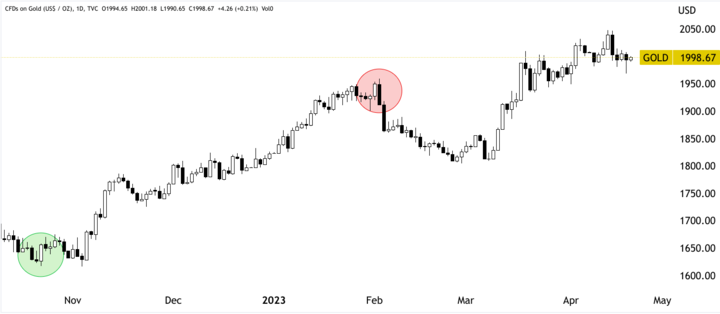
Bullish/Bearish Engulfing
The bullish and bearish engulfing are reversal patterns that occur after a trend. The bullish engulfing pattern is characterized by a small bearish candlestick completely engulfed by a larger bullish candlestick. The bearish engulfing pattern is the inverse, with a smaller bullish candlestick completely engulfed by a bigger bearish one.
Example: In mid-2019, the price of gold CFD formed a bullish engulfing pattern, with a smaller bearish candlestick engulfed by a larger bullish one. After the pattern formed, the price continued to rise sharply, reaching a peak of around $1,560 per ounce in early 2020. Similarly, at the beginning of February 2023, a bearish engulfing pattern emerged near $1950 per ounce.
In conclusion, these patterns deliver valuable insights into the direction and strength of price trends and can be used to identify optimal entry and exit points, potential price targets, and stop-loss levels. However, traders should also be aware that price patterns are not foolproof and can sometimes fail, so it is vital to use them in conjunction with other analysis tools (technical and fundamental ).
IV. Technical Indicators
Technical indicators are tools used by traders to analyze past price and volume data in order to identify potential future price movements in financial instruments such as gold CFDs. There are a number of commonly used technical indicators that can be applied to gold CFDs, including moving averages, RSI, MACD, and Bollinger Bands.
Moving Averages (MAs)
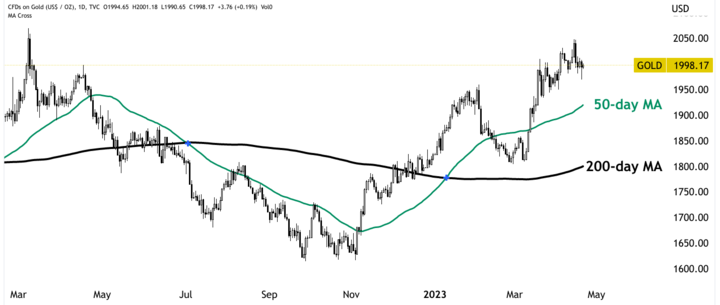
They are used to smooth out price fluctuations and identify the underlying trend. A commonly used moving average is the 50-day and 200-day moving average, which can help identify long-term trends in gold CFDs. For example, if the 50-day MA crosses above the 200-day MA, it may be a bullish signal indicating that the price trend is likely to continue upward. Conversely, if the 50-day MA crosses below the 200-day MA, it may be a bearish signal, indicating that the price trend is likely to continue downward.
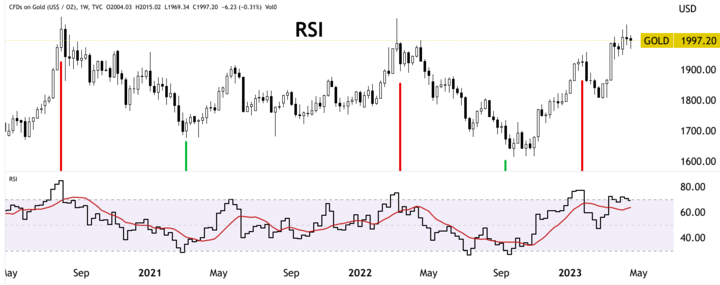
RSI
It is a momentum indicator that quantifies the magnitude of price changes to evaluate overbought or oversold states in the market. When the RSI is above 70, gold CFDs are overbought and may be due for a price correction. Conversely, when the RSI is below 30, it indicates that gold CFDs are oversold and may be due for a price reversal.
MACD
It is a momentum indicator (trend-following) that compares two MAs to identify changes in momentum. The MACD is derived by subtracting the 26-day exponential MA from the 12-day exponential MA. A signal line, which is a nine-day EMA of the MACD, is then plotted over the MACD. When the MACD reaches above the signal line, it may be a bullish signal, indicating that the price trend is likely to continue upward. Conversely, when the MACD crosses below the signal line, it may be a bearish signal, indicating that the price trend is likely to continue downward.
Bollinger Bands
They quantify volatility and price levels relative to the moving average. Bollinger Bands consist of three lines: the MA, an upper band, and a lower band. When the price of gold CFDs moves toward the upper band, it signals the price is overbought and due for a price correction. Conversely, when the price of gold CFDs moves toward the lower band, it may indicate that the price is oversold and due for a price reversal.

Examples of how each technical indicator can be used in conjunction with price patterns
● Moving Averages (MAs): if the price of gold CFD has broken below the neckline of a head and shoulders pattern, a bearish trend is confirmed if the 50-day moving average is also sloping downward.
● RSI: if Gold CFD is in an uptrend and forms a bearish engulfing candle at a resistance level, a confirmation of a potential trend reversal is signaled if the RSI is also in the overbought zone.
● MACD: if Gold CFD has formed a double-top pattern, a bearish trend reversal is signaled if the MACD histogram starts to slope downward.
● Bollinger Bands: For example, if Gold CFD has formed a double top pattern and the price breaks below the neckline, a bearish trend reversal is confirmed if the price moves outside the lower Bollinger Band.
V. Seasonal Patterns
Gold is one of the most important commodities in the world, and its price is affected by a wide range of factors. One of these factors is seasonality, which can have a significant impact on the demand for gold and, ultimately, on its price. There are several examples of seasonal patterns that can be observed in the gold market, including the impact of the Indian wedding season, the holiday season, and the end of the tax year.
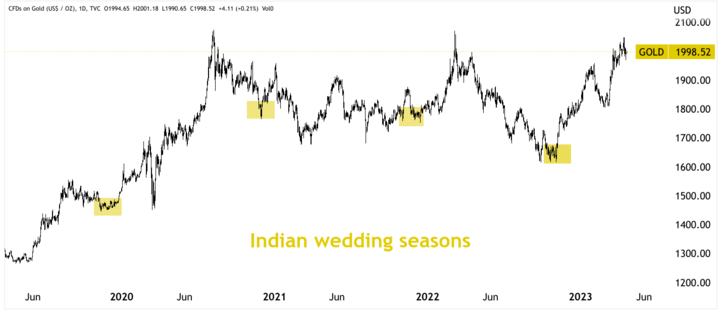
An Indian wedding season is a major event that takes place between October and December every year. During this time, there was a significant enhancement in demand for gold in India, as gold is an important part of Indian weddings. As a result, the price of gold tends to rise during this period as demand increases and supply struggles to keep up.
Another seasonal pattern that can be observed in the gold market is the impact of the holiday season. During the holiday season, there is typically a surge in demand for gold jewelry and other gold items as people look for gifts for their loved ones. The enhanced demand can lead to higher prices for gold as suppliers struggle to keep up with the increased demand.
Finally, the end of the tax year is another important seasonal pattern that can impact the price of gold. Many investors look to invest in gold at the end of the tax year to take advantage of tax benefits and diversify their portfolios. This increased demand can drive up the price of gold during this period.


VI. Conclusion
In conclusion, understanding historical price trends and patterns is crucial when trading gold CFDs. Traders should consider the impact of economic and geopolitical events on the price trends of gold CFDs and analyze both short-term and long-term trends. Identifying price patterns, such as support and resistance levels, can help traders make better decisions. Commonly used price patterns like Head and Shoulders, Double Top/Double Bottom, and Bullish or Bearish Engulfing can indicate trend reversals or continuation. Additionally, technical indicators like moving averages, RSI, MACD, and Bollinger Bands can provide further insights when used in conjunction with price patterns. Finally, traders should also pay attention to seasonal patterns like the impact of the Indian wedding season, the holiday season, and the end of the tax year on gold prices.
It is crucial for traders to use a variety of tools to analyze the historical price trends and patterns of gold CFDs for better decision-making. Technical analysis and seasonal patterns are just a few examples of such tools. Technical indicators can help identify trends and potential entry and exit points, while seasonal patterns can help predict when demand for gold may rise or fall. By using multiple tools, traders can develop a more comprehensive understanding of the market and make more informed decisions when trading gold CFDs.