After reaching a new weekly high of 149.96, the USD/JPY reversed course, falling 0.13 percent in response to dovish remarks by US Federal Reserve Chair Jerome Powell. This decline occurred in the context of a risk-taking attitude, as evidenced by Wall Street's strong performance.
US Dollar Faces Pressure From Powell's Speech
The market was considerably impacted by Jerome Powell's remarks, which led to diminished expectations of additional Federal Reserve tightening. On Wednesday, Powell's remark reduced the likelihood of a rate rise in January 2024 from 50%.
Fed chair Jerome Powell emphasized a cautious approach to settling monetary policy, indicating a necessity for further tightening. He acknowledged that the current policy is restrictive and that inflation is persistent. Powell highlighted the severity of the labor market and market anticipation of US central bank policy changes.
In terms of data, the US labor market demonstrated strength, with unemployment claims for the most recent week falling to 198K, lower than the forecast of 212 K. However, the Philadelphia Fed Manufacturing Index revealed a deterioration in regional business conditions, raising anxieties about a potential economic downturn.
Japanese Yen Outlook
In September, Japanese exports increased for the first time in three months, reaching record levels. The auto manufacturing industry played a crucial role in this growth by increasing US and European exports. While projections for exports were 3.1%, the actual figures were 4.3%, exceeding expectations.
In addition, Japan's top diplomat, Masato Kanda, mentioned an "international agreement" that permits authorities to intervene in the Forex markets in the event of excessive fluctuations.
USDJPY Technical Analysis

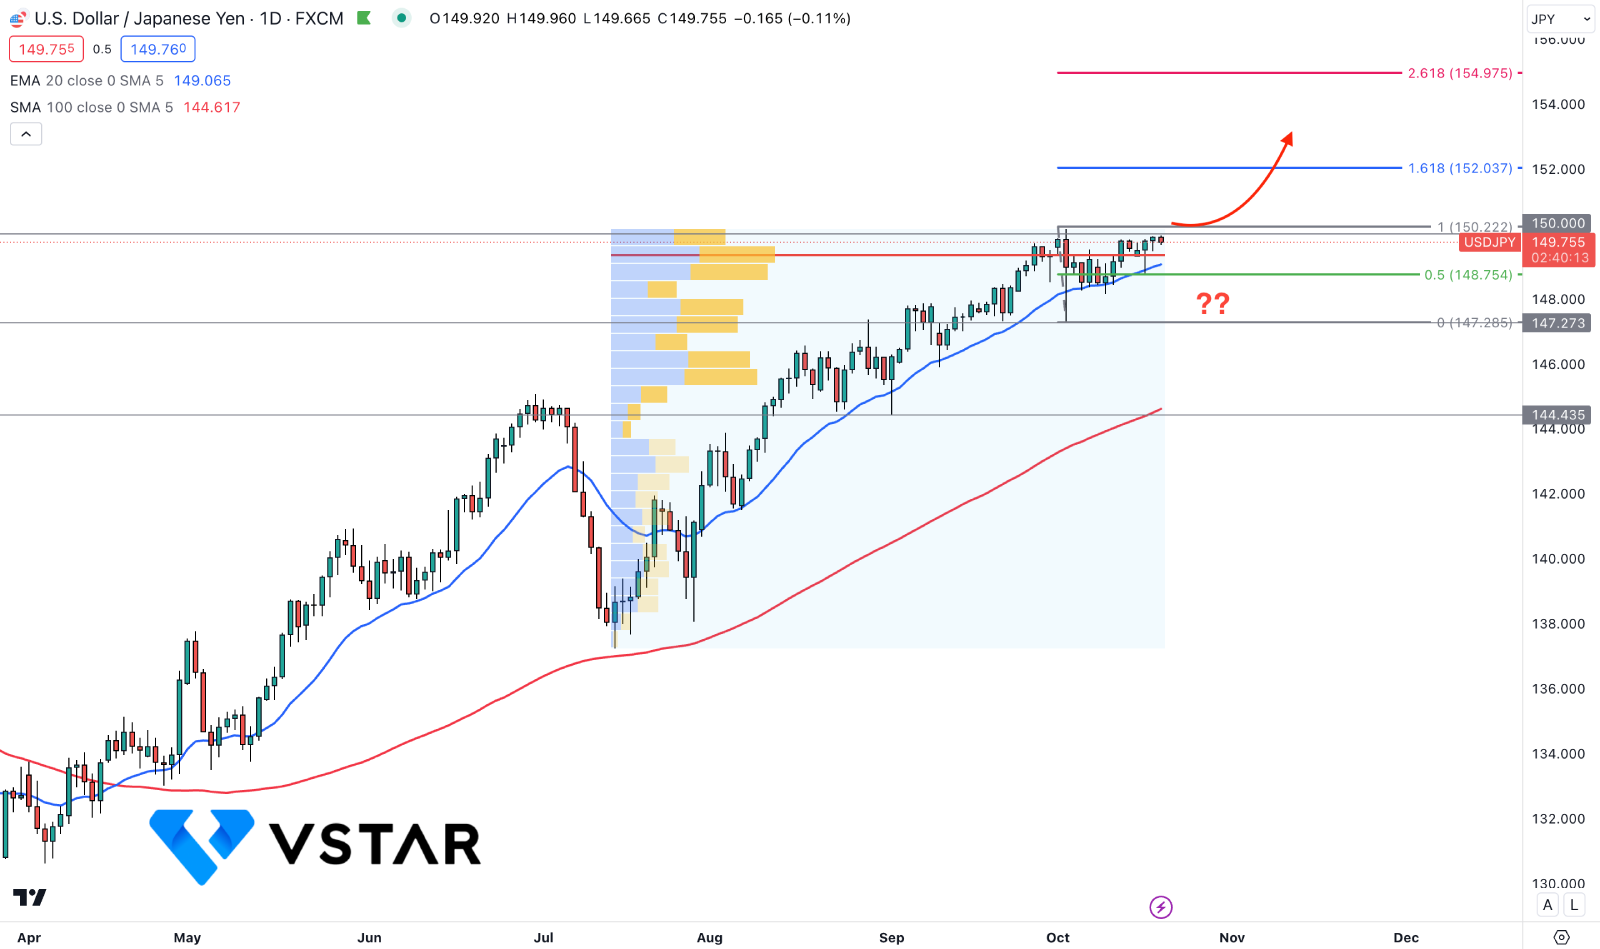
In the daily chart, the broader market direction in the USD JPY price is bullish as the recent price remains stable above the dynamic 20 EMA and 100 SMA. Moreover, the latest bullish exhaustion from the 20 EMA with a U-shape recovery near the 150.00 psychological number indicates an additional signal of a bullish opportunity.
In the volume structure, the largest volume level since the July 2023 low is positive for bulls, as the strongest level is at 149.39 level, which is just above the 20 EMA support. Moreover, the daily RSI is above the 50.00 line, while the MACD Histogram is bullish.
Based on the daily structure, a recent bullish recovery above the 150.00 level could extend the momentum toward the 152.03 Fibonacci Extension level. Moreover, a downside correction and an additional bullish rejection from the 20-day EMA could be an additional bullish possibility. However, a bearish daily candle below the 148.75 static level could lower the price towards the 146.00 psychological level.


