


Front-month wheat futures increased by double digits at the start of the week. At the closing, Chicago Board of Trade (CBT) futures were up 10 ½ cents on the day, staying close to their highest points. On the first trading day of the week, Kansas City (KC) futures also ended with gains that ranged from 10 to 13 cents. Prices for front-month spring wheat also saw notable gains, finishing the day up between 7 and 9 ½ cents.
Wheat Fundamental Releases
Texas winter wheat conditions were recorded as 44% good/excellent, according to state data from the National Agricultural Statistics Service (NASS). This translated into a Brugler500 score of 313 from 319 the week before. The winter wheat conditions in Kansas (KS) improved somewhat by 1 point, to 344 on the Brugler 500 scale. Oklahoma's conditions, meanwhile, improved by 1 point to 366.
Soft Red Winter (SRW) wheat previously sold to China has again been canceled, according to the United States Department of Agriculture (USDA). With this cancellation, 264,000 metric tons (MT) have been canceled since Thursday for 504,000 MT. This accounts for 25% of all SRW unshipped sales and 38% of China's outstanding books.
Wheat Weekly Inspection Data
According to weekly inspection data, 402,874 MT of wheat were exported during the week ending March 7th, up 45,000 MT from the previous week and 150,000 MT more than last year. The weekly data showed that shipments decreased to 13.37 million metric tons (MMT) from 15.9 MMT at the same time last year.
According to Stats Canada's planting intentions report this morning, the projected amount of wheat acreage in 2024 is 27.05 million acres, slightly more than the previous year and more than the projected 26.7 million acres. Durum wheat accounted for most of the increase, up 5.1% from the previous year, while spring wheat acreage fell by 1.2%.
Wheat Price Technical Analysis
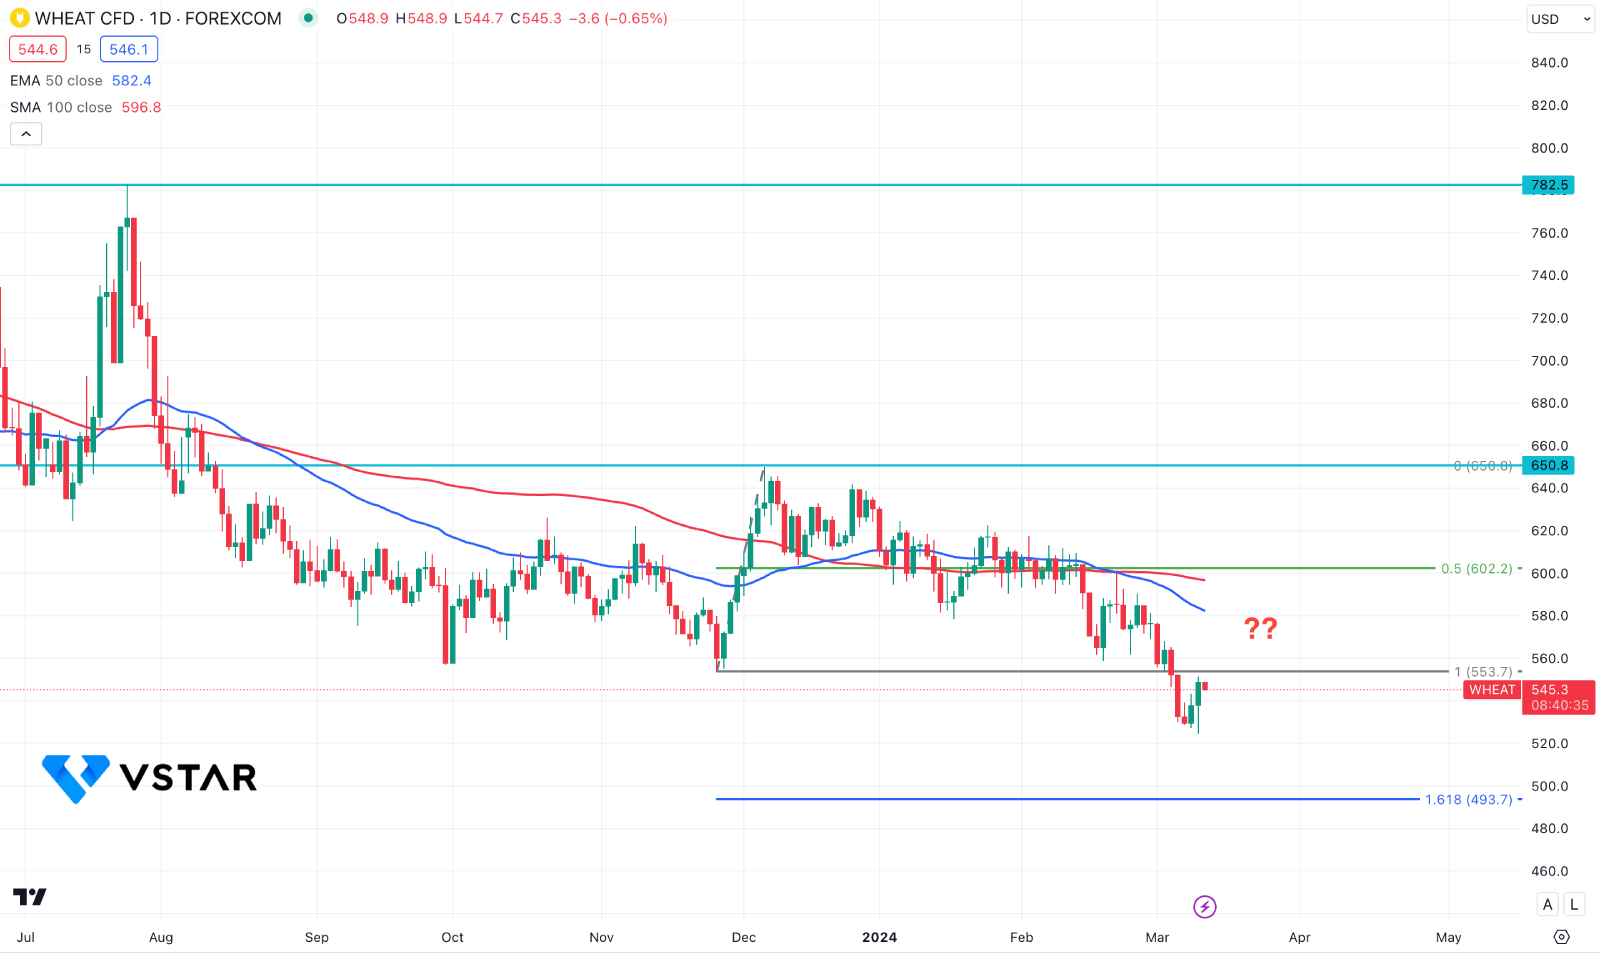
In the daily chart of WHEAT prices, the overall market pressure is bearish as the current price trades below the dynamic 50-day Exponential Moving Average.
In the higher timeframe, the ongoing selling pressure is visible from the monthly candle. Moreover, the weekly price shows the same outlook as the recent price of wheat, which showed consecutive bearish closes.
In the daily chart, a bearish crossover is visible from the 100-day SMA and 50-day EMA line, which suggests a confluence of bearish factors. On the other hand, the recent price trades below the 553.70 crucial line, from where an immediate bullish reversal could indicate a sell-side liquidity sweep.
Based on this outlook, an upward continuation is potent, where a daily close above the 560.00 level could increase the price toward the 600.00 psychological level.
On the other hand, a minor upward correction and a bearish rejection from the dynamic 50-day EMA level might extend the downside pressure toward the 493.70 Fibonacci Extension level.


