If you are an active trader looking to improve your trading strategies, Bollinger Bands can be a valuable tool in your arsenal. Bollinger Bands are a popular technical analysis indicator created by John Bollinger in the 1980s. These bands consist of a simple moving average (SMA) in the middle and two standard deviation lines above and below the SMA.
Bollinger Bands aims to provide traders with a visual representation of price volatility and potential trading opportunities. They can identify overbought or oversold conditions, detect trading ranges, and spot potential breakouts.
Bollinger Bands have gained widespread popularity due to their versatility and effectiveness in different market conditions. Traders can employ various strategies using Bollinger Bands, such as trading within the range, trading breakouts, and even identifying trend reversals.
By incorporating Bollinger Bands into your trading routine, you can gain valuable insights into market dynamics and make more informed trading decisions. Whether you are a beginner or an experienced trader, understanding and implementing Bollinger Band strategies can help enhance your trading performance and increase your chances of success.
Understanding Bollinger Bands
Bollinger Bands are a widely used technical analysis tool that can assist you in making informed trading decisions. To effectively utilize Bollinger Bands, it is crucial to understand their basic formula, interpretation, and components.
A. Basic Bollinger Bands formula
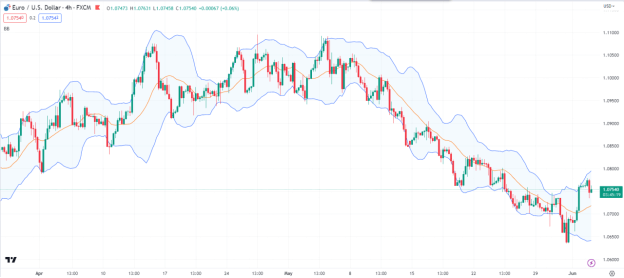
The basic formula for Bollinger Bands combines a simple moving average (SMA) with two standard deviation lines. The SMA represents the middle Bollinger Band, while the upper and lower bands are created by adding and subtracting the standard deviation from the SMA. This formula helps visualize price volatility and potential trading opportunities.
B. Interpretation of Bollinger Bands
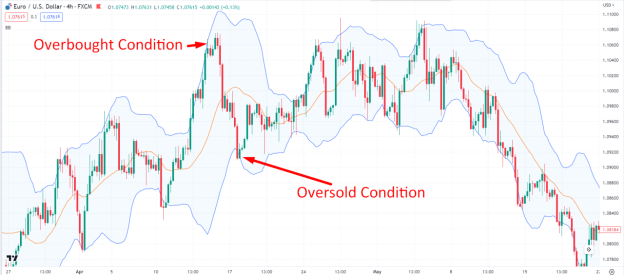
Interpreting Bollinger Bands involves assessing price movements within the bands. When the price approaches the upper band, it suggests an overbought condition, indicating a potential reversal or pullback. Conversely, when the price nears the lower band, it indicates an oversold condition, potentially signaling a price rebound.
C. Components of Bollinger Bands
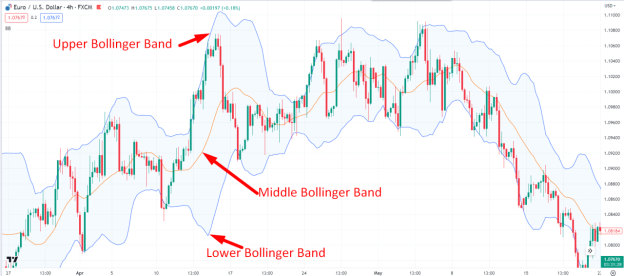
Bollinger Bands consist of three main components:
Upper Bollinger Band: This band represents a line above the SMA and can act as a resistance level. When the price touches or breaks above this band, it may suggest a potential continuation of an uptrend or a breakout.
Middle Bollinger Band: The middle band represents the SMA and serves as a reference point for the average price. It can act as dynamic support or resistance, depending on the price's position relative to the bands.
Lower Bollinger Band:This band lies below the SMA and can act as a support level. When the price touches or breaks below this band, it may indicate a potential continuation of a downtrend or a breakdown.
By understanding the formula, interpretation, and components of Bollinger Bands, you can gain valuable insights into price volatility and potential trading opportunities.
Applying Bollinger Bands
Applying Bollinger Bands can enhance your trading strategy by identifying market volatility, trading ranges, breakout opportunities, and overbought/oversold conditions. Remember to consider other indicators or technical analysis tools in conjunction with Bollinger Bands for a comprehensive approach to trading.
Continuously monitor the price movements within the bands and adapt your trading decisions accordingly. Bollinger Bands serve as a valuable tool in your trading arsenal, aiding you in making more informed decisions and improving your trading outcomes.
A. Identifying market volatility
Bollinger Bands offer valuable insights into market volatility and can be effectively applied to identify trading opportunities. By understanding how to measure market volatility and utilize Bollinger Bands, you can find potential entry and exit points in your trades.
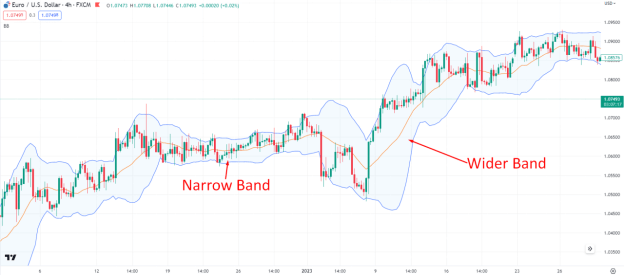
1. Measuring market volatility with Bollinger Bands: Bollinger Bands expand and contract based on market volatility. When the bands widen, it suggests higher volatility, while narrowing bands indicate lower volatility. By observing the width of the bands, you can gauge the current market conditions and adjust your trading strategy accordingly.
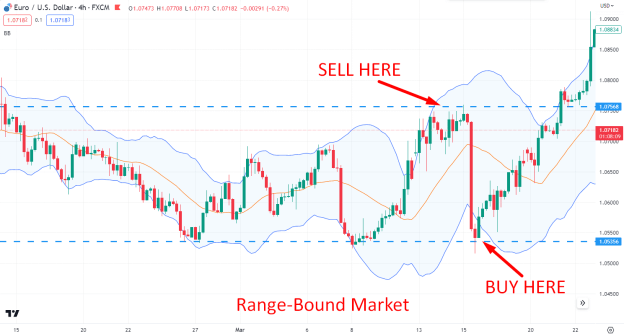
2. Identifying trading ranges: Bollinger Bands can help you identify periods of consolidation or trading ranges. When the price moves between the upper and lower bands without a clear trend, it indicates a range-bound market. During these periods, you can employ range-trading strategies and look for opportunities to buy near the lower band and sell near the upper band.
B. Finding entry and exit points
Finding entry and exit points using Bollinger Bands can be very easy. A beginner trader can also find entry and exit points once they know how it works. Below we have provided two Bollinger Bands trading methods that you can apply to your trading strategy.
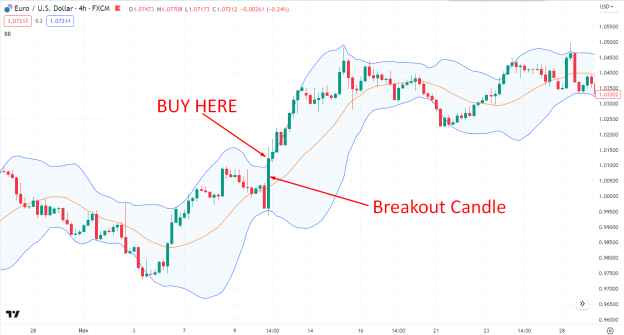
1. Using Bollinger Bands to identify breakout opportunities: Breakouts occur when the price breaks above the upper band or below the lower band, signaling a potential trend continuation. This can be an indication of strong buying or selling pressure. When a breakout occurs, you can consider entering a trade in the direction of the breakout, expecting the price to continue its momentum.
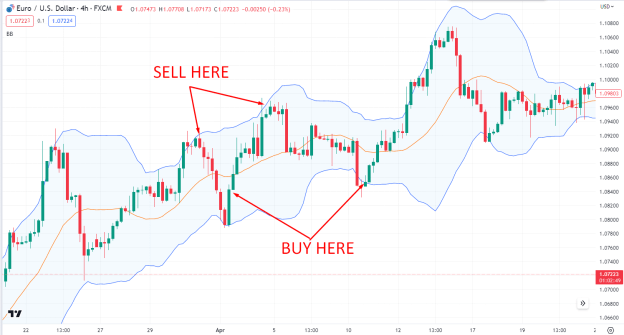
2. Using Bollinger Bands to identify overbought/oversold conditions: When the price reaches the upper band, it suggests an overbought condition, indicating a potential reversal or pullback. Conversely, when the price touches the lower band, it indicates an oversold condition, potentially signaling a price rebound. These conditions can be used to determine potential exit points or reversals in your trades.
Advanced Bollinger Bands Strategies
You can combine Bollinger Bands with other technical indicators to further enhance your trading approach. You can gain deeper insights and refine your trading decisions by integrating additional tools, such as Fibonacci retracements and moving averages.
A. Combining Bollinger Bands with other technical indicators
By integrating Fibonacci retracements and moving averages with Bollinger Bands, you can refine your analysis and increase the effectiveness of your trading strategy. These advanced strategies provide a comprehensive view of market dynamics and help you identify key levels and trends.
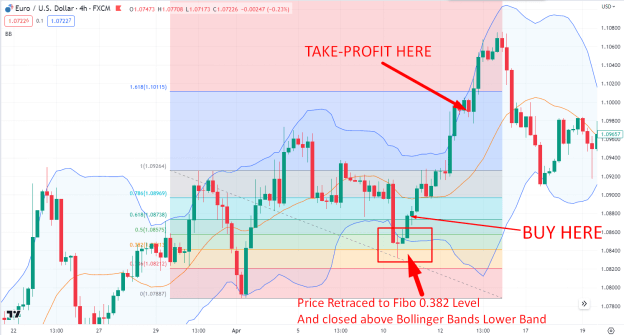
1. Fibonacci retracements: Fibonacci retracements are based on the concept of natural ratios found in nature and financial markets. You can identify potential support and resistance levels by overlaying Fibonacci retracement levels on Bollinger Bands. When these levels coincide with the upper or lower band, it provides a stronger indication of price reversals or trend continuations. This combination allows you to fine-tune your entry and exit points with increased accuracy.
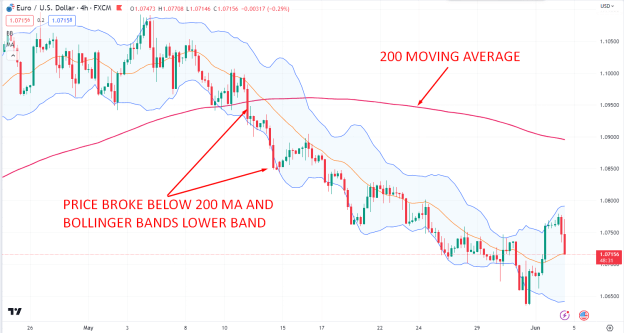
2. Moving averages: Moving averages smooth out price data and help identify the overall trend. Incorporating moving averages with Bollinger Bands allows you to spot trends and confirm potential breakout or reversal signals. For example, when the price breaks above both the upper Bollinger Band and a moving average, it suggests a strong bullish signal. Conversely, a price break below the lower Bollinger Band and a moving average can indicate a bearish signal. This combined approach adds an extra layer of confirmation to your trading decisions.
B. Bollinger Band squeeze strategy
One popular Bollinger Bands strategy is the Bollinger Band squeeze. This strategy is particularly useful when the market experiences low volatility and consolidates within a narrow range. The Bollinger Band squeeze helps you identify potential breakout opportunities.
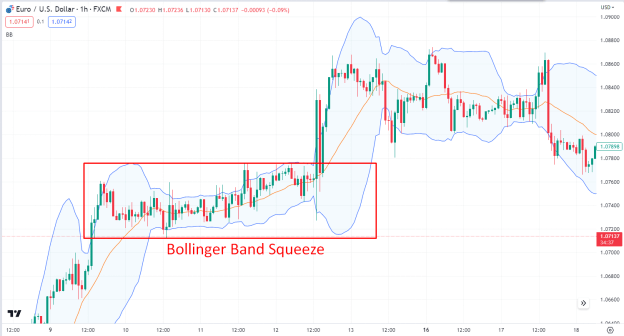
1. Definition of Bollinger Bands squeeze: A Bollinger Band squeeze occurs when the width between the upper and lower Bollinger Bands narrows significantly. This indicates a period of low volatility and a potential buildup of energy within the market. The squeeze signifies that a breakout move is likely to occur soon, as the price cannot remain compressed for an extended period.
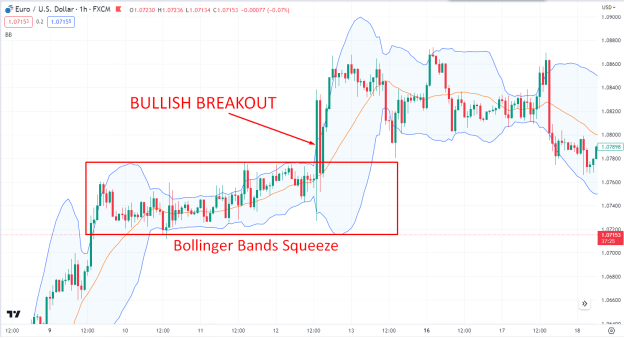
2. Using Bollinger Band squeeze to identify breakout opportunities: When the Bollinger Bands squeeze, it signals a potential increase in volatility and a breakout from the range-bound conditions. Traders often look for the breakout to happen in the direction of the underlying trend. For example, a bullish breakout above the upper Bollinger Band can be seen as a buying opportunity if the price has been in an uptrend. Conversely, a bearish breakout below the lower Bollinger Band in a downtrend can present a potential selling opportunity.
Remember, it is important to practice and backtest these strategies before applying them in live trading. Each market and instrument may exhibit unique characteristics, so adapting your approach is crucial. By combining Bollinger Bands with other technical indicators, you can gain a more holistic understanding of price action and make well-informed trading decisions. Consider the overall market context and use proper risk management techniques when implementing any trading strategy. The Bollinger Band squeeze strategy can be a valuable tool helping you capitalize on potential breakout moves and take advantage of increased market volatility.
Common mistakes to avoid with Bollinger Bands
While Bollinger Bands can be a powerful tool for trading ranges, breakouts, and more, it's essential to be aware of common mistakes that traders often make when using this indicator. Avoiding these pitfalls can enhance your trading effectiveness and minimize potential losses. Here are three key mistakes to watch out for:
A. Overreliance on Bollinger Bands signals
Bollinger Bands are not foolproof indicators and relying solely on their signals can lead to poor trading decisions. It's crucial to consider other technical indicators, market conditions, and fundamental factors to validate and confirm potential trading opportunities. By using Bollinger Bands in conjunction with other tools, you can increase the accuracy of your analysis and make more informed decisions.
B. Ignoring market fundamentals
Bollinger Bands provide valuable insights into price volatility and potential reversals, but they do not take into account fundamental factors that can influence the market. Economic data, news events, and geopolitical developments can significantly impact price movements. Ignoring these factors and focusing solely on Bollinger Bands can lead to misguided trades. Always stay informed about market fundamentals to complement your technical analysis.
C. Neglecting risk management strategies
Effective risk management is crucial in trading, and neglecting it can result in significant losses. Bollinger Bands alone cannot determine the appropriate position sizing, stop-loss levels, or risk-reward ratios. Implementing sound risk management strategies, such as setting stop-loss orders, using proper position sizing techniques, and adhering to a disciplined trading plan is essential. By incorporating risk management practices, you can protect your capital and preserve your trading longevity.
Nonetheless, Bollinger Bands are just one tool in a trader's toolbox. They should be used in conjunction with other indicators and analysis techniques to increase the probability of successful trades. By avoiding overreliance on Bollinger Bands, considering market fundamentals, and implementing proper risk management, you can enhance your trading skills and achieve better overall results.
Stay informed, stay disciplined, and continuously improve your trading approach to maximize the potential of Bollinger Bands and other trading strategies. Keep in mind that no strategy is foolproof, and market conditions can change rapidly. Always stay vigilant and use proper risk management techniques to protect your capital. You can leverage Bollinger Bands and other technical indicators with diligent practice and continuous improvement to enhance your trading performance.


Conclusion
breakouts, Fibonacci retracements, and moving averages. We learned how to use Bollinger Bands squeeze to identify potential breakout opportunities and discussed common mistakes to avoid when utilizing Bollinger Bands.
Moreover, it is essential to remember that Bollinger Bands should not be used in isolation. Combining them with other technical indicators and considering market fundamentals can provide a more comprehensive analysis and improve the accuracy of your trading decisions.
By applying the knowledge gained from this article and continuously educating yourself, you can harness the full potential of Bollinger Bands and refine your trading skills. Remember to stay disciplined, informed, and adaptable as you navigate the dynamic world of trading. Now that you have a solid foundation in Bollinger Bands, it's time to put your knowledge into practice and confidently embark on your trading journey.