The main goal of CFD trading is to predict future price movements. There's no ownership of any asset or currency. Hence, you can profit from both market sides by going long or short.
However, such decisions are like gambling if you don't have a precise technique to analyze the price.
The two most discussed methods are fundamental analysis and technical analysis.
Fundamental analysis involves understanding real-world factors and their impact on the market. On the contrary, technical analysis traders pay the most attention to price charts using tools to anticipate future actions.
While both methods will help you make more informed decisions, you may wonder which is better as a beginner. You'd want to pick and focus on only one style in CFD trading your career.
However, learning and using both analyses produces the best results. It will help you identify opportunities and manage risks easier, ultimately ensuring profitable trades.
Understanding Technical Analysis
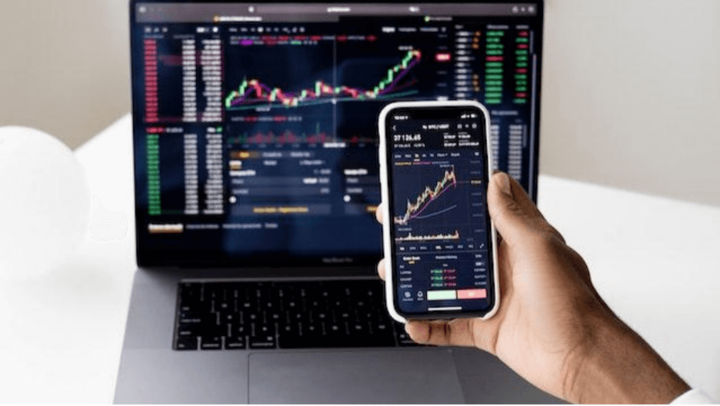
Technical analysis means studying price charts to observe past behaviors, expecting them to repeat in the future. They could be trends, patterns, or reactions to support & resistance levels.
Hence, you'd need to use several charting tools on trading platforms to discover such actions. Some are simple, like trend lines, but others are complex, like indicators.
Trading with technical analysis is unique, as two independent traders can't read the markets the exact way. Even if they do, the type of charts and tools used may be different.
Regardless, everyone can still be profitable with their strategies, as seen so far.

The Importance of Charts in Technical Analysis
Although every trading method eventually requires you to observe charts to place orders, technical analysts need them the most.
They will be your most helpful tool because they contain the price action you must study to frame future expectations.
Thus, with no consistent access to trading charts, technical analysis won't exist.
Below are the three most common types:
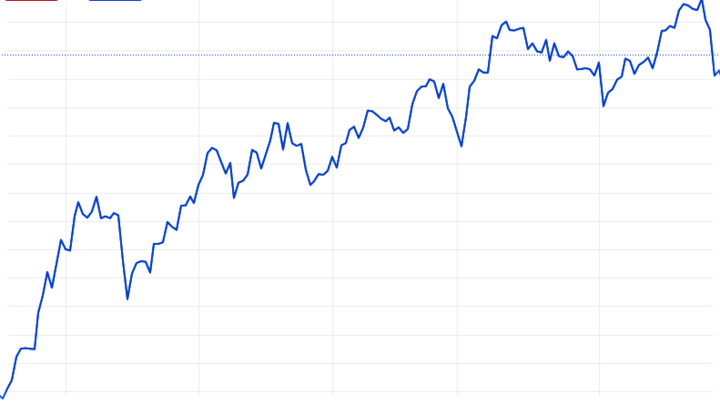
Line charts: These charts are the most basic, usually used to determine the market trend over a period. They contain a line that connects the closing prices of each period.
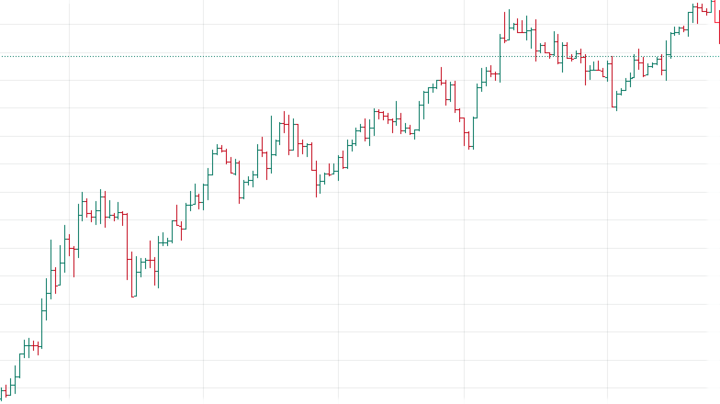
Bar charts: Bar charts represent the price movement within a period with its opening, closing, high, and low levels.
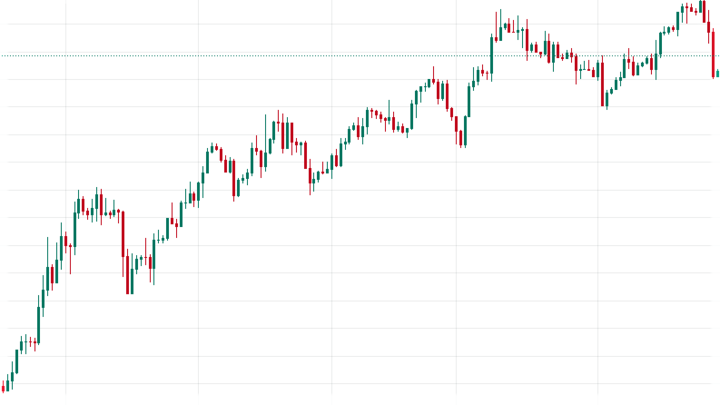
Candlestick charts: Candlestick charts are similar to bar charts. However, the opening to closing of each price representation is colored. It indicates whether it increased or decreased during the time.
How Indicators Work In Technical Analysis
Indicators are mathematical calculations of price movement, volatility, trend, or volume plotted on charts.
You can use them (single or combined) in the following ways:
● To generate buy or sell signals for potentially profitable trades.
● To confirm or deny a suspicion of price movement.
● To identify upcoming trends or reversals.
● To recognize patterns better.
● To discover when the price is ranging.
Below are some of the most popular indicators.
Moving Averages
The Moving Average (MA) calculates an asset's price over time and plots a line on the chart. Traders use it as a buy signal whenever bars or candlesticks move above or below it.
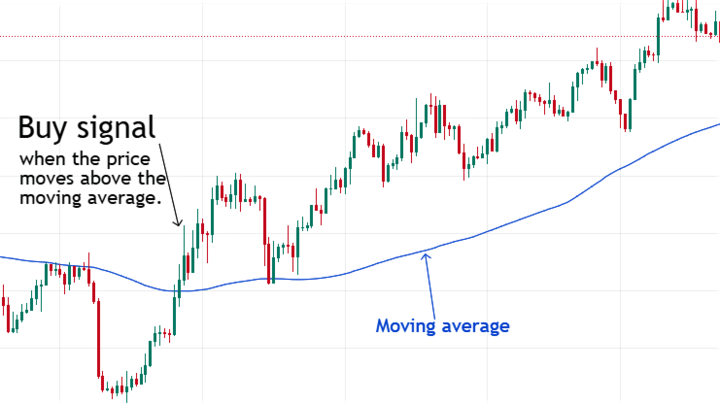
You can also combine two moving averages of different periods.
When the shorter-term moving average crosses the longer-term one below, it may signal a downtrend. Conversely, traders expect bullish markets when the shorter-term MA moves above the longer-term one.
Bollinger Bands
Bollinger bands are one of the most complex indicators. They consist of one moving average and two standard deviations above and below.
Therefore, you can use them in the following ways:
● Identify support and resistance levels when the price trades near the upper and lower band areas.
● Measure market volatility with their width. The market is more volatile when it is wide but less so when narrow.
● Expect potential trend reversals when the price moves outside the bands.
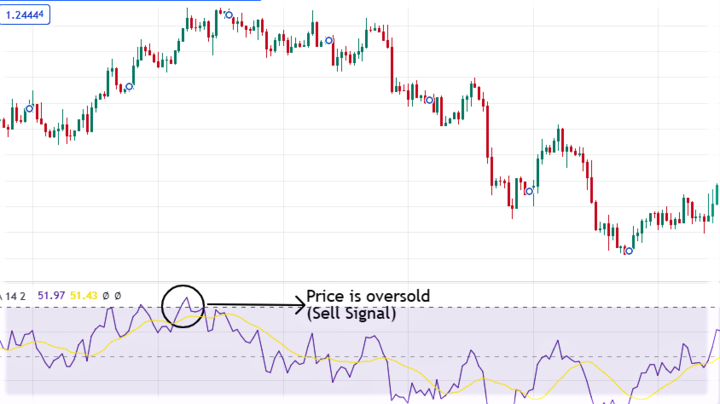
Relative Strength Index (RSI)
The relative strength index is a momentum indicator that can provide good trade entry signals during approaching trends.
Some traders use it as a divergence against the market price.
They expect a downtrend when the relative strength index makes lower highs & price makes higher highs. On the contrary, when the indicator makes higher lows & price makes lower lows, it can signify bullish conditions.
Also, other technical analysts use it as an overbought and oversold indicator.
It is oversold when it goes below 30, and you can expect an uptrend. However, it is overbought above 70, meaning there's an upcoming bearish market.
Looking for Patterns in Technical Analysis
From thorough studies, technical analysts have proven some price patterns repeat. They usually use tools such as horizontal, vertical, and trend lines to trace them.
These patterns can be excellent trade entry and exit signals when discovered. Hence, here are some of the most widely accepted ones:
Head and Shoulders
The head and shoulders pattern on candlestick charts indicates a trend reversal from bullish to bearish. However, traders also invert it to signify the turnaround from a bearish market to a bullish one.
As the name implies, the patterns have three peaks and troughs.
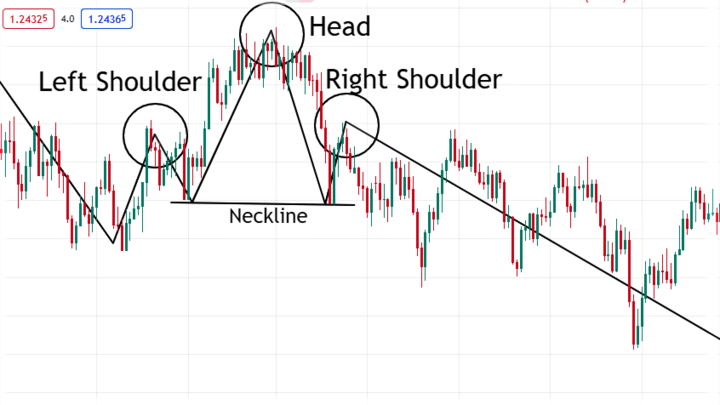
The one in the middle (the most extended) is the "head." Then, the two others at relatively equal levels are the shoulders.
It is complete when the price is below/above the neckline, providing an opportunity to enter trades.
Flags
Unlike the head and shoulders, flag patterns usually signify the continuation of a trend.
Each flag consists of two parts:
● Flagpole: The flagpole is a sudden (bullish or bearish) price movement.
● Flag: This is a brief consolidation after the quick price move. You can see it by drawing two parallel trend lines on its highs and lows.
The pattern is complete when the price finally breaks out of the flag in the same trend earlier.
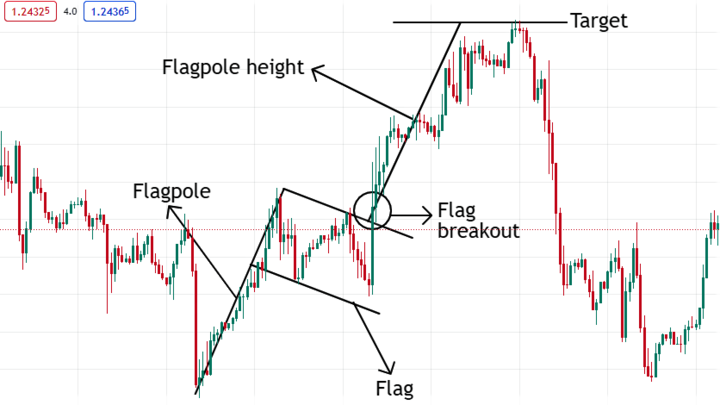
Thus, when the price is in the "flag," you can place trades in the former trend's direction. Your stop-loss should be below the consolidation while you can measure the flagpole's height for your take-profit.
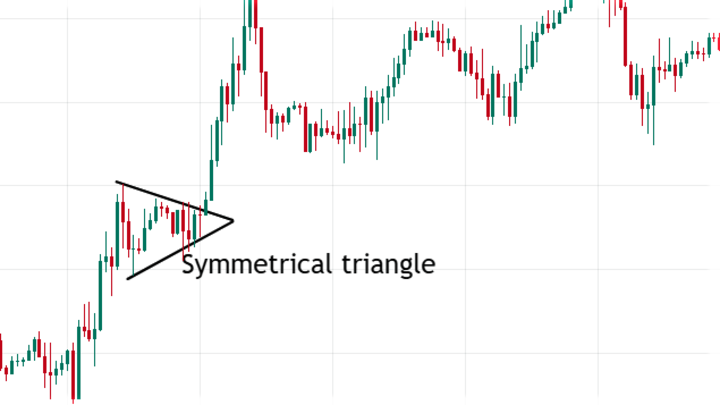
Triangles
The triangles are another mostly continuation pattern technical analysts use for trade signals. It consists of two trend lines meeting at a point before a possible breakout.
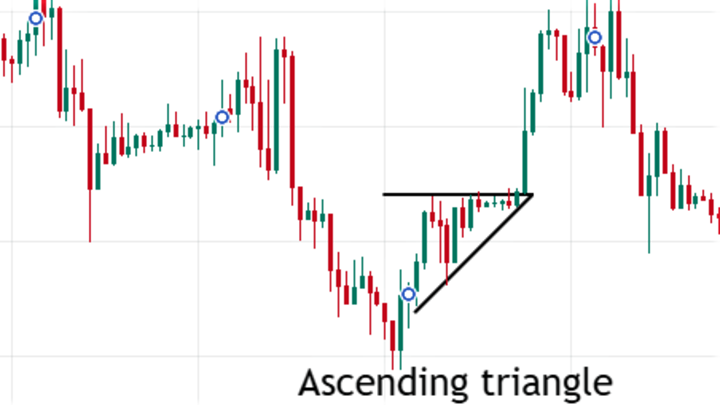
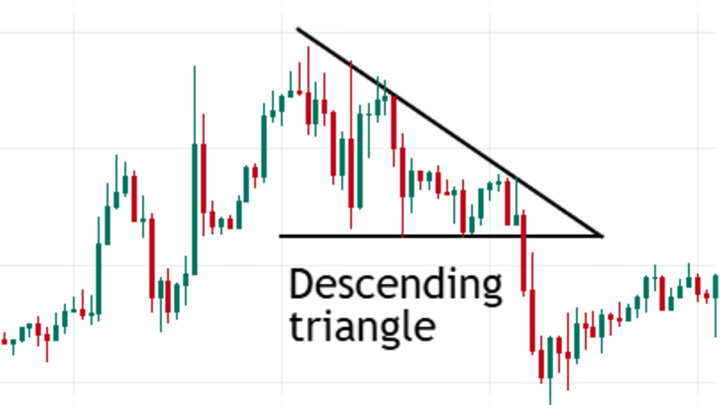
Based on the type of such lines, there are three types of triangle patterns:
Symmetrical triangle: A symmetrical triangle forms when a descending and an ascending trend line meets. Price may break out on either side of the pattern, so you can wait to confirm the direction before placing a trade.
Ascending triangle: Ascending triangles comprise a horizontal resistance line and an ascending trend line. It usually indicates a bullish condition, so you can wait for the break out above the pattern to open buy orders.
Descending triangle: A descending triangle forms when a falling trend line meets a horizontal support line. Thus, you can wait for the price to break below before entering trades with a stop loss above the descending trend line.
Benefits & Limitations of Technical Analysis
Technical analysis may demand time and attention to learn before crafting a suitable trading plan.
However, you will enjoy the following benefits once you can master it:
● Automation: They are easy to automate on trading platforms since it only requires details from the charts.
● Faster decision-making: As a technical analyst, you can make informed decisions faster based on price behaviors.
● Flexibility: Technical analysis works in almost every financial market. Therefore, you are free to engage with anyone on CFDs.
● Backed by history: Backtests can approve your technical analysis approach, which is essential to know if it works.
● Removes sentiments: With a solid technical analysis trading plan, your feelings will hardly impact your market executions.
Despite the benefits of technical analysis, you must be aware of the following setbacks:
● False signals: Indicators and patterns don't have 100% accuracy in providing signals. Thus, always obey your risk management rules to be safe.
● Biased: The uniqueness of technical analysis is another disadvantage. Ten different traders can define the market in various ways, opposing one another.
The kind of trader you learn technical analysis from will impact how you will trade.
● Changing market conditions: Technical analysis means expecting past price actions to repeat. Hence, it will be less effective when market conditions change.
An Overview of Fundamental Analysis
Fundamental analysis involves studying various factors that influence the prices of financial assets. They may be economic, political, or social.
In short, if such factors are positive, the prices will rise. Conversely, any unfavorable condition will lead to declining values.
For example, if several indicators like the CPI and GDP outputs suggest a country's economy is strong, fundamentalists will expect its currency to be more valuable (bullish market).
On the contrary, the currency prices will drop if there's any indication of a weak economy.
Another example, politically, is periods of doubt (like during elections). It will affect investors' confidence, increasing price volatility in almost every market class.
Even corporate reports, company events, natural disasters, and global pandemics can affect financial markets.
Hence, fundamental analysis aims to anticipate such occasions and their impact on prices.
Tools Used In Fundamental Analysis
Several real-life factors are what determine the intrinsic value of an asset or currency. Hence, you try to understand their relationship in fundamental analysis.
Unlike technical analysts, fundamentalists hardly spend hours with the charts. Instead, the following are some of their most used tools:
The News
News reports are some of the best sources of financial, economic, and political information that affect prices. They could be from blogs, broadcasts, newspapers, etc.
Here are some popular ways fundamentalists use them:
● Understand market sentiments affecting supply and demand.
● Identify significant events that influence the markets, like earnings announcements or economic reports.
● Track industry trends, such as new technologies that could improve or weaken the sector.
As discussed, if such reports are positive, the related assets' prices should soon be bullish, and vice-versa.
For example, imagine there was breaking news that the president signed an agreement with another country to reduce tariffs on certain goods. The goods demand may increase and benefit the commodity sector & companies involved.

Company Filings
Company filings are official documents submitted to regulated bodies. Regardless, they are available to the public for transparency.
These documents usually have information that can help shares CFD traders evaluate a company's performance. Hence, some of the most significant values to note include the following:
● Revenue growth
● Earnings per share
● Profit margin
● Cash flow
● Debt levels
You can also make informed decisions by understanding companies' administration, potential competition, risk management, etc.
Industry Reports
Industry reports (or profiles) contain in-depth insights into a sector of top-tier companies. Such sectors could be media, education, healthcare, etc.
Investors hoping to profit from one industry are usually the ones who seek analysis reports. However, fundamental CFD traders can also use them to guide their market executions.
For example, bullish conditions may be approaching an industry that expects new technologies or trends from its profile. Conversely, a projected growth decline due to changes in tariffs may cause lowering prices.
You can check this guide for how to create an industry analysis report.
Economic Calendars
Economic calendars are the most accessible fundamental analysis tool. They are also not as complicated as most others. Hence, almost everyone uses them.
These calendars contain dates of a country's market-moving events. They can be economic indicators, monetary policy, or political activities, like the following:
● GDP output
● Unemployment claims
● Interest rate changes
● Consumer spendings
● National elections
By anticipating and observing these reports, CFD traders can interpret them and make educated trading decisions.
For example, your economic calendar can remind you of Consumer Price Index (CPI) release tomorrow.
When the values come out and are higher than expected, it indicates increasing inflation. Thus, you can expect weaker existing bonds and lower share prices if the interest rates rise in response.

Nowadays, economic calendars also contain volatility codes (usually colors). They will help you determine how seriously the reports will affect price fluctuations.
Benefits and Limitations of Fundamental Analysis
Fundamental analysis is a unique approach to CFD trading for better decisions. It involves using market-driving reports to anticipate price movements.
Therefore, the following are the benefits of choosing this method of market analysis:
- A deeper understanding of price moves:The CFD market derives its values from the underlying financial assets. Hence, various financial, political, and economic factors determine them.
Fundamental analysis helps you understand the real reasons behind price moves. You won't be surprised when your preferred markets are in bullish, bearish, or ranging conditions.
- Identify long-term trends:Fundamental analysis is best for long-term trends due to the deep market insights it gives you.
It is a significant advantage to swing and position traders.
On the other hand, there are limitations to fundamental analysis, such as the following:
- Analyze all the variables:To arrive at a trading decision, you must assess several documents and follow different reports closely and accurately.
It isn't easy, especially for a beginner that doesn't like complex studies. After all the effort, it can even be more discouraging if your predictions are incorrect.
- Need to monitor events constantly:Fundamentalists are always alert to identify conditions that can impact the markets. It can range from wars to natural disasters and even social media posts from top leaders.
Thus, there's hardly room for rest during analysis.

- Unsuitable for short-term trading:You can't accurately use fundamental analysis for short-term CFD trading. Hence, you may be open to unpredictable conditions in lower time frames. They can have severe consequences without proper risk management strategies.
Combining Technical Analysis & Fundamental Analysis for CFD Trading
As a new trader, others may have advised you to pick one approach to market analysis.
To some, technical analysis seems better because history proves that some actions will always repeat. However, the fact that fundamentalists consider the true factors influencing price movement makes it the more logical choice.
Regardless of what fact you prefer, it's best to combine both for CFD trading.
With a fundamentalist mindset, you will understand when and why prices should move in any long-term direction. It won't feel like a random movement because real-world issues are quietly behind them.
Then, with such knowledge, you can use several strategies from technical analysis to enter and exit trades profitably.
Beginners may find this challenging, but it's not always the case with the right trading plan.
Trading Plan With Technical and Fundamental Analyses
Your trading plan guides all your market decisions, from charts-reading to executions. Hence, below are the ways your technical and fundamental analyses knowledge can combine to make it excellent:
The Best Trading Conditions - Fundamental Analysis
An in-depth trading plan has information about the best market conditions. It is usually during long-term trends.
Thus, through fundamental analysis, you can determine if an uptrend (bullish) or downtrend (bearish) is approaching.
It can even reveal periods when market prices will be uncertain during horizontal trends to stay away.
Periods of High Volatility - Fundamental Analysis
By following significant events in economic calendars, you can anticipate intraday periods when prices fluctuate the most. Some common examples include NFP reports, CPI announcements, GDP releases, etc.
Trade Entry & Exit Strategies - Technical Analysis
Entering and exiting short-term trades may still feel challenging despite anticipating a price trend through fundamental analysis.
Therefore, you need to use strategies from technical analysis for the best signals.
For example, you may prefer to go long or short with flag patterns when there's a price break. One or two more indicators can also provide more confidence.
Then, you can exit the trade when the price reaches the flagpole's height on the continued trend.
Risk Management Levels - Technical Analysis
Technical analysis will also help you determine the best price levels to place stop, trailing stop, and take profit orders.
With the flag pattern trading discussed earlier, the stops can initially be below the flag (consolidation). When it breaks the area, continuing the trend, you can move it manually or set a trailing stop order.
You can set the take profit at the flagpole's height, where the trend continues.
Final Thoughts
Fundamental and technical analyses may be unique enough for you to choose only one style. However, learning and implementing both is better, especially for beginners.
Technical analysis will help you with short-term executions, but with fundamental analysis, you can anticipate and learn why price moves in any long-term direction.
Therefore, your CFD trading plan should have rules regarding them, as discussed in this article.
Finally, you can test the trading plan on VSTAR Demo accounts that imitate live market conditions. You will also have access to numerous learning resources for both analyses.


As your skills improve, you will be profitable and achieve your trading goals.