


- Gasoline production and consumption rise, indicating growing demand for crude oil.
- U.S. crude oil imports slightly increase, reflecting potential shifts in global supply dynamics.
- Commercial crude oil inventories increase, signaling a potential oversupply situation.
- Mixed trends in refined product prices and moderate retail fuel price increases introduce market uncertainty.
The article dissects recent EIA data shaping market dynamics. From refinery inputs to global imports, explore the complexities influencing the price direction of CFDs on crude oil.
1. Refinery Inputs and Production
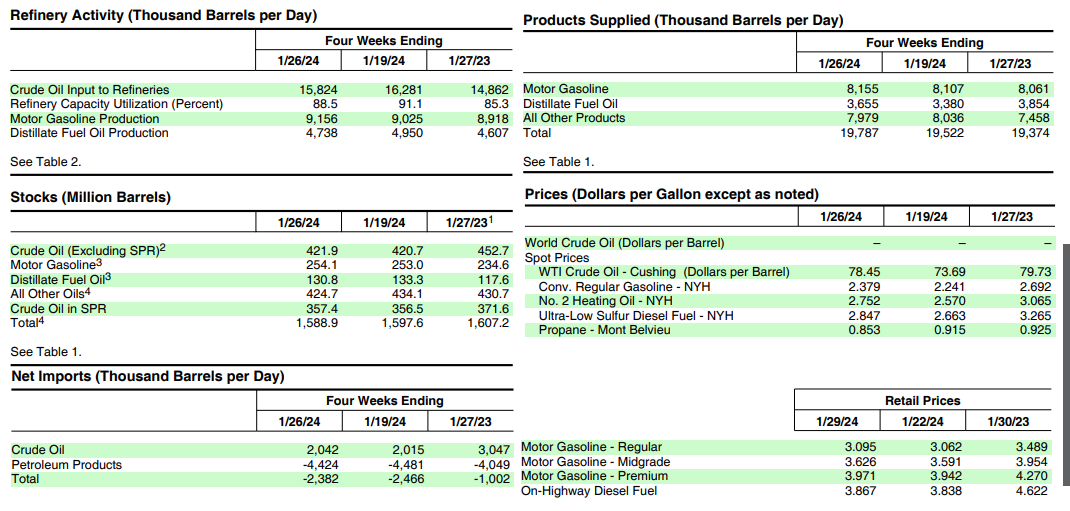
The decrease in U.S. crude oil refinery inputs by 428 thousand barrels per day during the week ending January 26, 2024, is a noteworthy observation. This decline signals a potential reduction in demand for crude oil by refineries, indicating a shift in production requirements. Refineries operated at 82.9% of their operable capacity, suggesting a moderate utilization rate. This metric is crucial as it reflects the industry's ability to respond to market demands. A higher utilization rate often indicates increased demand for refined products.
The increase in gasoline production to an average of 9.3 million barrels per day is a positive sign for the crude oil market. This suggests an uptick in demand for gasoline, potentially driven by increased economic activities such as travel and transportation. Gasoline is a major refined product derived from crude oil, and its production trends can influence the overall demand for crude oil.
Source: eia.gov
However, distillate fuel production decreased, averaging 4.4 million barrels per day. Distillate fuels include diesel, heating oil, and jet fuel. A decrease in production might indicate varying demand patterns for these products, which can be influenced by factors such as seasonal changes, industrial activities, and transportation needs.
2. Crude Oil Imports
U.S. crude oil imports averaged 5.6 million barrels per day, showing a slight increase of 25 thousand barrels per day from the previous week. Over the past four weeks, crude oil imports averaged about 6.2 million barrels per day, reflecting a 5.9% decrease compared to the same four-week period last year. This data highlights potential shifts in global supply dynamics.
The increase in weekly imports suggests a short-term adjustment, but the year-over-year decline indicates a more sustained trend. Geopolitical factors, OPEC decisions, and global economic conditions can significantly impact the import/export dynamics, influencing the price of crude oil. A sustained decrease in imports may contribute to a tightening of supply, potentially placing upward pressure on prices.
3. Commercial Crude Oil Inventories
U.S. commercial crude oil inventories (excluding the Strategic Reserve) increased by 1.2 million barrels from the previous week, reaching a total of 421.9 million barrels. While still 5% below the five-year average for this time of year, this increase might suggest a build-up in domestic crude oil supply. Inventories play a crucial role in market dynamics, and excess supply can put downward pressure on crude oil prices.
Total motor gasoline inventories increased by 1.2 million barrels from the previous week, standing about 1% above the five-year average. The rise in gasoline inventories may reflect increased production or reduced consumption, potentially contributing to a balanced market. The market closely monitors gasoline inventories as they are indicative of consumer demand and economic activities.
Distillate fuel inventories, on the other hand, decreased by 2.5 million barrels last week, placing them about 5% below the five-year average for this time of year. A decrease in distillate inventories could signal increased demand or production adjustments, impacting prices of related refined products and potentially influencing crude oil prices.
Propane/propylene inventories decreased by 5.3 million barrels from last week, standing 1% above the five-year average. While propane inventories might not directly impact crude oil prices, they do reflect broader trends in the energy market and can influence sentiment.
The overall commercial petroleum inventories, including crude oil and refined products, decreased by 9.6 million barrels last week. A decline in total inventories, if sustained, could contribute to a more bullish sentiment by signaling a potential reduction in oversupply.
4. Petroleum Product Supplied
Total products supplied over the last four weeks averaged 19.8 million barrels a day, up by 2.1% from the same period last year. This metric reflects the demand for various petroleum products and provides insights into consumption patterns.
Motor gasoline product supplied averaged 8.2 million barrels a day over the past four weeks, up by 1.2% from the same period last year. The increase in gasoline consumption suggests a positive trend for the crude oil market, as gasoline is a major driver of demand for crude.
Distillate fuel product supplied averaged 3.7 million barrels a day over the past four weeks, down by 5.2% from the same period last year. The decrease in distillate consumption may indicate reduced demand for diesel and heating oil, which could be influenced by factors such as warmer weather or shifts in industrial activities.
Jet fuel product supplied was up 1.7% compared with the same four-week period last year. The increase in jet fuel consumption suggests potential growth in the aviation sector, reflecting broader economic activities and impacting crude oil demand.
5. Price Trends
The price for West Texas Intermediate (WTI) crude oil was $78.45 per barrel on January 26, 2024. This represents a significant increase of $4.76 from the previous week. While the year-over-year decrease is marginal at $1.28, the weekly increase is substantial and requires careful consideration.
The New York Harbor spot price for conventional gasoline increased to $2.379 per gallon, up by $0.138 from a week ago. The year-ago price, however, was $0.313 higher. Gasoline prices are crucial as they directly impact consumer spending and are indicative of economic activities.
The spot price for No. 2 heating oil at New York Harbor rose $0.182 to $2.752 per gallon. While the weekly increase is notable, the price remains $0.313 less than the year-ago price. Heating oil prices are influenced by seasonal factors and can provide insights into consumer behavior and energy demand.
The national average retail price for regular gasoline rose to $3.095 per gallon on January 29, 2024. This reflects a $0.033 increase from the previous week but is $0.394 less than the year-ago price. Retail gasoline prices are critical for understanding consumer sentiment and can impact overall economic trends
The national average retail diesel fuel price rose $0.029 to $3.867 per gallon. While the weekly increase is moderate, the price is $0.755 lower than the price one year ago. Diesel prices are closely monitored as they affect transportation costs and can have broader implications for the economy.
Possible Implications on Price of CFDs on Crude Oil (Focus on Price Direction)
1. Bullish Factors:
- Increased Gasoline Production and Consumption: The rise in gasoline production and consumption, as indicated by higher refinery inputs and elevated gasoline product supplied, can be viewed as a bullish factor. This suggests a growing demand for crude oil to produce gasoline, potentially driving prices higher.
- Decline in Distillate Inventories: The decrease in distillate fuel inventories, coupled with a decline in distillate product supplied, may signal increased demand for diesel and heating oil. If this trend persists, it could contribute to a more bullish outlook for crude oil prices.
- Rising Jet Fuel Consumption: The increase in jet fuel product supplied points to growth in the aviation sector, reflecting economic activities. This could contribute to higher crude oil demand, particularly if the trend continues.
2. Bearish Factors:
- Increase in Crude Oil Inventories: The rise in U.S. commercial crude oil inventories, albeit still below the five-year average, indicates a potential oversupply situation. If this build-up continues, it may exert downward pressure on crude oil prices.
- Year-over-Year Decline in Crude Oil Imports: The sustained decrease in crude oil imports compared to the same period last year suggests a shift in global supply dynamics. A consistent decline in imports may lead to reduced competition and could contribute to a bearish sentiment in crude oil prices.
- Mixed Trends in Gasoline and Heating Oil Prices: While gasoline prices increased, the year-over-year decrease in both gasoline and heating oil prices suggests complex market dynamics. Mixed trends in refined product prices may contribute to uncertainty, impacting crude oil price direction.
3. Neutral Factors:
- Moderate Utilization of Refinery Capacity: Refineries operating at 82.9% of their operable capacity indicate a moderate utilization rate. This neutral factor suggests a balanced approach to production, neither excessively high nor low, reflecting stability in the refining sector.
- Total Petroleum Inventories Decrease: While there is a decrease in total commercial petroleum inventories, including crude oil and refined products, the sustainability of this decline needs monitoring. A continued reduction in inventories could contribute to a more neutral or even bullish sentiment.
- Moderate Increases in Retail Fuel Prices: The moderate increases in retail gasoline and diesel fuel prices, coupled with lower year-over-year prices, suggest a balanced consumer response to changing market conditions.
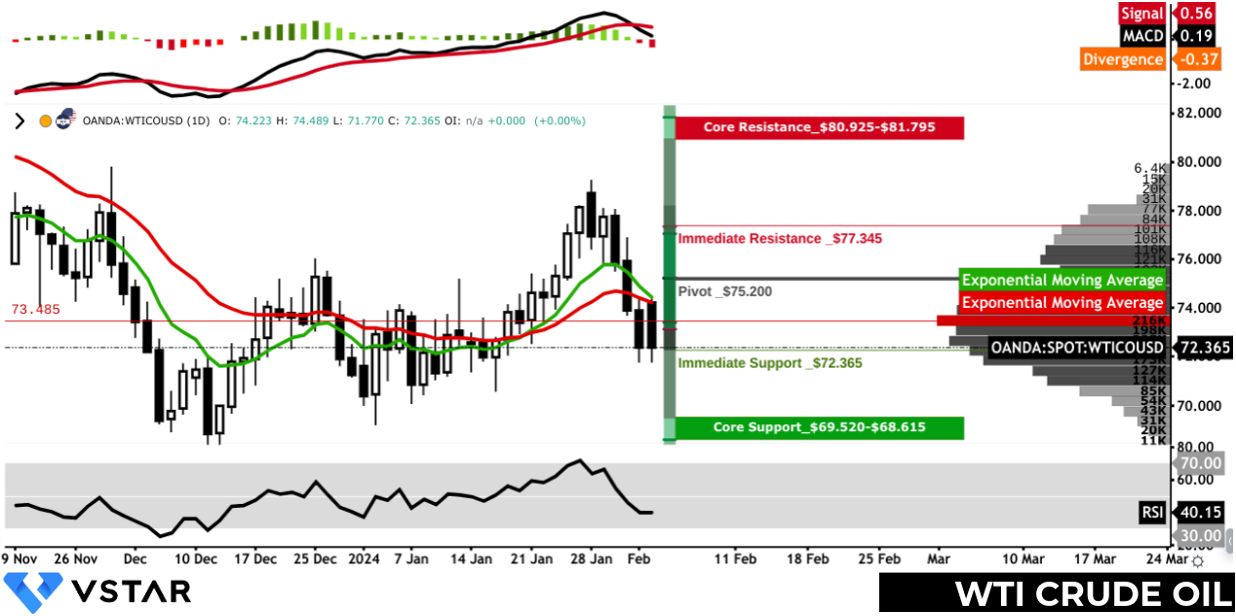
WTI Crude Oil CFDs: Technical Take

Source: gocharting.com
The price of CFDs on crude oil is at a support level of $72.365. The price may stabilize at the current level this week, with a resistance at the pivot of $75.200 on the upside. The moving average convergence/divergence (MACD) signals a downtrend. That may lead the price towards the core support range of $69.520-$68.615. Similarly, the relative strength index (RSI) is at 40, which signals further downside potential from the current level.
However, bullish factors at work with heightened volatility may push the price upward to $77.345. It should be noted that the current core resistance range is way up, and the price may not hit that level this week. The exponential moving averages (fast-green and slow-red) suggest neutral momentum. Overall, the price may move down until the next inventory report by EIA, considering the volume profile, RSI, and MACD.
In conclusion, crude oil CFDs have a complex interplay of factors indicating potential stable or downside price movements. Bullish signals from increased gasoline demand contrast with bearish indicators like rising inventories. The major fundamentals and technicals suggest a downside. Overall, the price may trend downward until the next EIA inventory report, guided by the volume profile, RSI, and MACD.


