


Insights from EIA Crude Oil Supply and Demand Trends
- Growing refinery inputs and increased crude oil imports signal rising demand, potentially pushing CFD prices on Crude Oil higher.
- Lower crude oil inventories and decreasing distillate fuel stocks suggest potential supply constraints, supporting upward pressure on CFD prices.
- The decline in crude oil prices and petroleum product spot prices may indicate oversupply or weakened demand, possibly leading to lower CFD prices.
- Despite mixed factors, market participants should remain vigilant, monitoring supply-demand dynamics, global events, and economic conditions to make informed decisions.
Interpretation of EIA Crude Oil Data
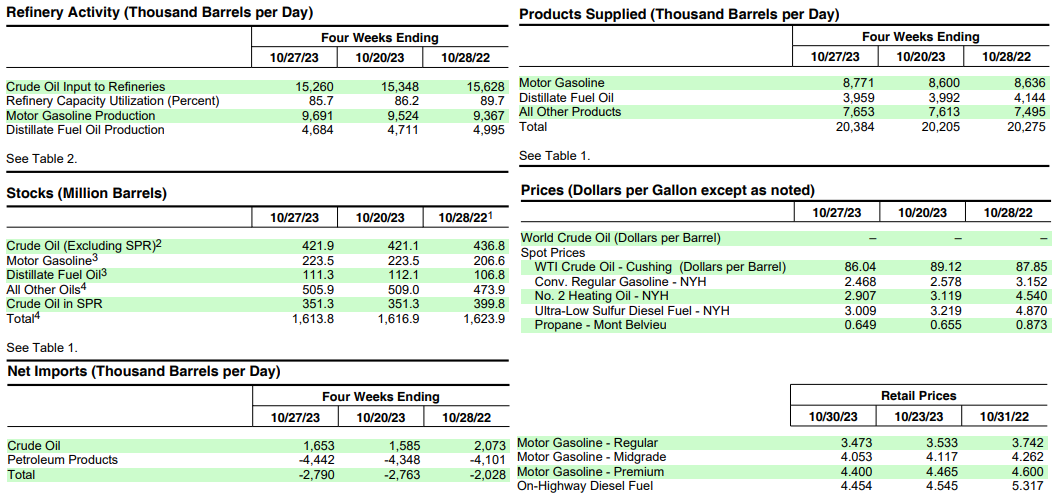
Refinery Inputs: U.S. crude oil refinery inputs increased by 62 thousand barrels per day, indicating a rise in demand for crude oil by refineries. This suggests a healthy demand for refined petroleum products, which could lead to an increase in the price of CFDs on Crude Oil due to higher demand for the underlying commodity.
Source: eia.gov
Crude Oil Imports: The 1.4% year-over-year increase in crude oil imports, along with a weekly increase of 412 thousand barrels per day, suggests sustained demand. This rising demand can contribute to a positive impact on CFD prices, pushing them higher.
Crude Oil Inventories: While there was a slight 0.8 million barrel increase in crude oil inventories, they remain 5% below the five-year average. Lower inventory levels relative to historical averages may signal potential supply constraints, which could exert upward pressure on CFD prices.
Gasoline and Distillate Fuel Inventories: Gasoline inventories increased slightly, but distillate fuel inventories decreased by 0.8 million barrels, putting them at 12% below the five-year average. The reduction in distillate fuel inventories suggests rising demand for this product, which can positively impact CFD prices.
Petroleum Product Supplied: A 0.5% increase in total products supplied, with notable growth in motor gasoline and jet fuel product supplied, reflects rising demand for petroleum products. This trend can be supportive of higher CFD prices.
Crude Oil Prices: The WTI crude oil price decreased by $3.08 in a week and was $1.81 lower than the year-ago price. Lower spot prices for crude oil may imply an oversupply or weaker demand, which could lead to lower CFD prices.
Gasoline and Diesel Prices: The significant decline in gasoline and heating oil prices compared to the previous year suggests potential oversupply or reduced demand. This may lead to lower CFD prices.
National Average Retail Prices: Decreases in the national average retail prices for gasoline and diesel can stimulate demand for these products. Lower prices may positively impact CFD prices by increasing consumer and industrial consumption of petroleum products.
Possible Implications on Price of CFDs on Crude Oil
Bullish Scenario
Increasing refinery inputs, rising imports, and decreasing distillate fuel inventories indicate a growing demand for crude oil and petroleum products, which can push CFD prices higher.
The 5% shortfall in crude oil inventories compared to the five-year average may create concerns about future supply, further supporting higher CFD prices.
Bearish Scenario
The decline in crude oil prices, alongside significant drops in gasoline and heating oil prices, indicates potential oversupply or reduced demand, which may lead to lower CFD prices.
If global economic conditions worsen, leading to reduced industrial and consumer activity, it could negatively impact CFD prices as demand for crude oil and its derivatives declines.
Technical Analysis: CFDs on Crude Oil
CFD prices have found support at $80.85. The upcoming week may witness a price range oscillating between $89.10 and $80.85. The critical juncture resides at $84.85, where it intersects with the 200 EMA (black line). However, if heightened volatility arises, prices could dive toward $75.75 to test the support level, possibly driven by positive geopolitical developments. In a less likely scenario, rapid bullish moves may reach $94.30 as a weekly high to establish a close above the 200 EMA and the upper pivot range, possibly triggered by negative geopolitical events. $102.40 and $67.50 are ideal entry points for strategic short and long positions.
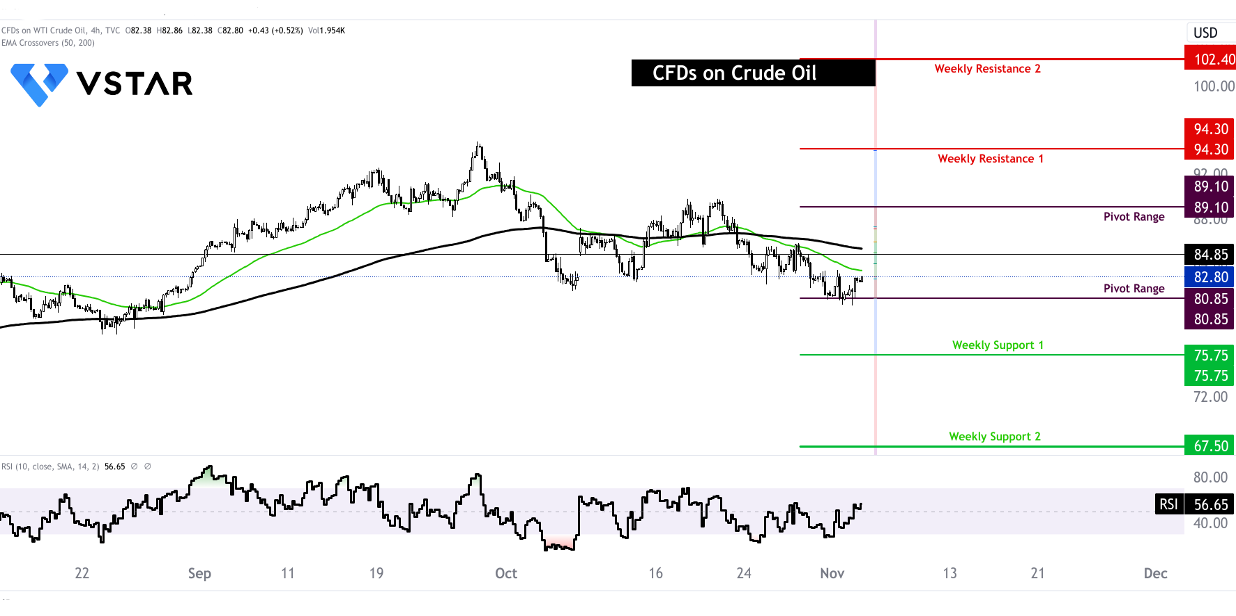
Source: tradingview.com (4-hour price chart)


