
Introduction
EURUSD trading, the exchange of the Euro against the US Dollar, stands as a cornerstone of the forex market. Over the years, it has garnered immense attention due to its volatility and potential for profit. In this guide, we'll provide you with actionable insights that incorporate the latest developments up to 2023, offering you a strategic advantage in your trading endeavors.
Through real-world examples, we'll illuminate the playbook of expert EURUSD traders. From trend-following strategies to breakout techniques, each trade example encapsulates a distinct approach. We'll showcase the strategies that experts have employed to navigate the currency's movements in the fast-paced landscape.
Whether you're an experienced trader seeking new perspectives or a newcomer eager to grasp the essentials, this guide will walk you through step-by-step, ensuring that you understand the core concepts, tactics, and nuances. By embracing these strategies and staying attuned to the most recent market trends, you can position yourself for success in EURUSD trading today.
Fading the Pin Bar Reversal
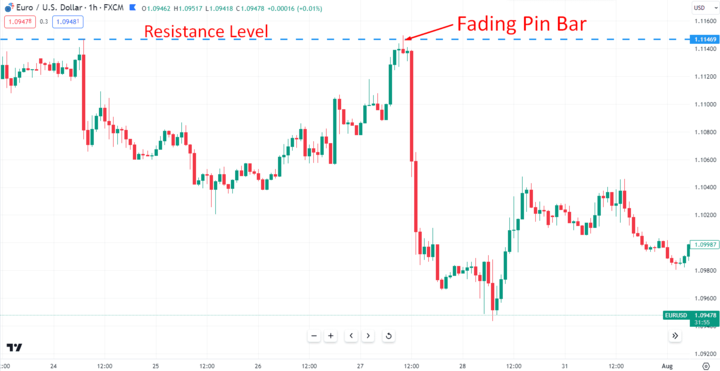
Image Source: TradingView
One effective approach is "Fading the Pin Bar Reversal," which involves a strategic combination of technical analysis and risk management. By understanding this strategy and its real-world applications, you can elevate your trading game and achieve consistent success.
The "Fading the Pin Bar Reversal" strategy is built on the observation of a bearish pin bar forming at a significant resistance level on the EURUSD chart. This candlestick pattern signifies a potential reversal in the current trend, making it an opportune moment to enter a short trade. As the pin bar closes, you initiate your trade, positioning yourself to capitalize on the anticipated downtrend.
Imagine the EURUSD chart depicting a bearish pin bar materializing at a pivotal resistance level. This price action signals a potential reversal, offering a unique entry point. As an astute trader, you seize this opportunity by initiating a short trade upon the close of the pin bar. This tactical move aligns with the prevailing market sentiment and sets the stage for your trading success.
EURUSD forms bearish pin bar at the resistance
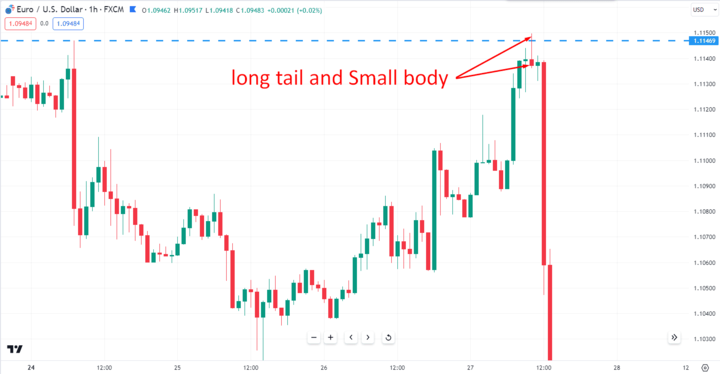
Image Source: TradingView
Scan the EURUSD chart for bearish pin bars forming at resistance levels. These candlestick patterns, characterized by a long tail and small body, hint at an impending reversal.
Taking short trade on pin bar close
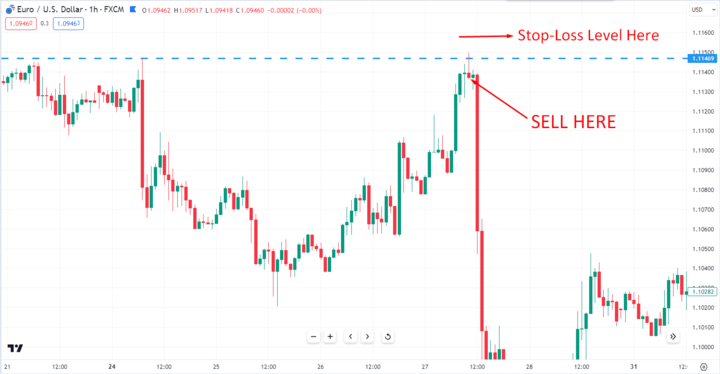
Image Source: TradingView
Once you've identified a bearish pin bar, consider initiating a short trade as soon as the pin bar closes. This involves entering the market with a sell order, taking advantage of the potential downward movement. While trading, it's essential to manage your risk effectively. As the trade progresses, set a stop-loss order above the high of the pin bar. This safeguards your capital in case the market takes an unexpected turn.
Managing trade with trendline break

Image Source: TradingView
To further enhance your trading strategy, keep an eye on trendlines. If the price breaks below a trendline after your short trade, it can be a strong confirmation of a downtrend. This can guide you in deciding whether to hold onto the trade or consider exiting with your profits intact.
The "Fading the Pin Bar Reversal" strategy empowers you to capitalize on market dynamics with precision. By acknowledging its effectiveness and applying it in real-time scenarios, you can enhance your EURUSD trading prowess. Remember, trading success lies in a careful balance of strategy, risk management, and adaptability.
Trading the Double Bottom Breakout
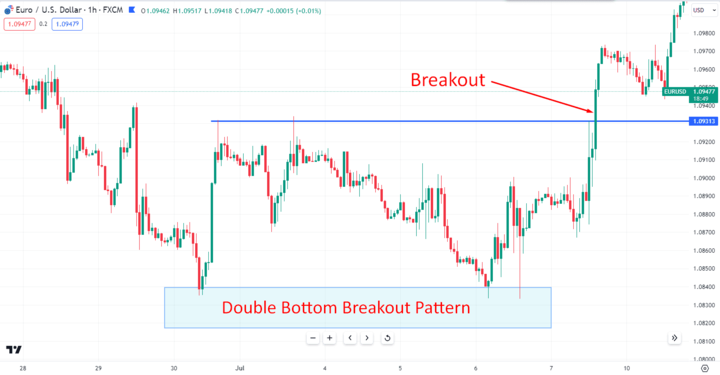
Image Source: TradingView
One such strategy that experts rely on is "Trading the Double Bottom Breakout". This technique, grounded in technical analysis and risk management, offers a powerful means to navigate the EURUSD market with precision and expertise.
The "Trading the Double Bottom Breakout" strategy hinges on identifying a specific chart pattern - the W Bottom, also known as the double bottom pattern. This pattern suggests a potential trend reversal from a bearish phase to a bullish one. Traders watch for the formation of this pattern as a signal to prepare for a potential buying opportunity.
EURUSD forms W bottom pattern
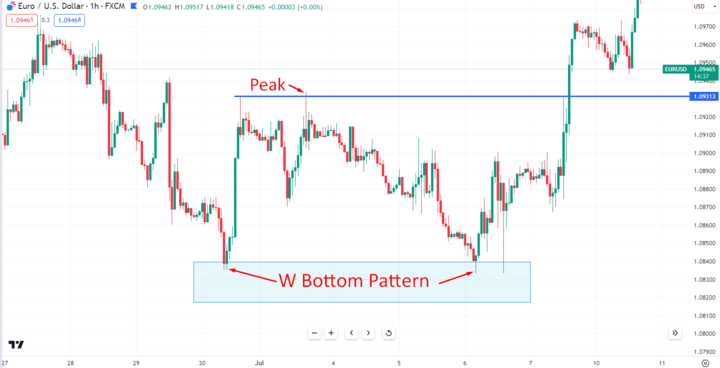
Image Source: TradingView
A Double Bottom pattern is a bullish reversal pattern that forms after a downtrend. It consists of two consecutive troughs (low points) that are roughly equal in height and separated by a peak (high point) in between. The pattern resembles the letter "W," which is why it's often called a "W bottom" pattern. The second trough's pullback doesn't breach the first trough's low, suggesting potential buying interest and a potential trend reversal.
Buying break above the neckline
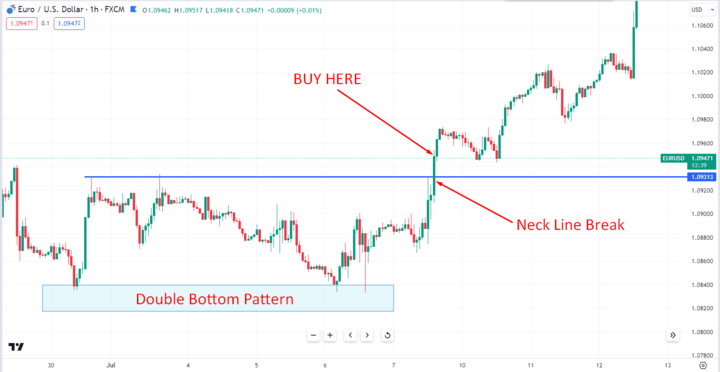
Image Source: TradingView
The neckline is a horizontal line drawn across the peak between the two troughs in the Double Bottom pattern. The breakout occurs when the price breaks above the neckline. As part of your strategy, you plan to enter a buy trade when the price closes above the neckline. This breakout suggests that the bullish momentum is gaining strength and that the price could potentially move higher.
Setting risk/reward parameters

Image Source: TradingView
Managing risk and reward is crucial in trading. You should determine how much you're willing to risk (your stop-loss level) and how much you aim to gain (your target or take-profit level) for each trade.
- Stop-Loss:This is the level at which you'll exit the trade if the price moves against you. You might place your stop-loss below the lowest point of the Double Bottom pattern or another relevant support level.
- Take-Profit: This is the level at which you'll exit the trade if the price moves in your favor. You could place your take-profit at a distance that provides a favorable risk-to-reward ratio. This could be based on previous resistance levels, Fibonacci retracement levels, or other technical factors.
- Risk-to-Reward Ratio: A common guideline is to aim for a risk-to-reward ratio of at least 1:2 or higher. This means that for every unit of risk, you're willing to take (your stop-loss distance), you're aiming for at least two units of potential reward (your take-profit distance).
To master this approach, meticulous attention to risk management and the execution of precise entries and exits is crucial. Setting appropriate stop-loss levels and profit targets enables traders to optimize their risk-to-reward ratio effectively.
Range Breakout Strategy

Image Source: TradingView
Range Breakout Strategy stands out as a versatile technique that harnesses both technical analysis and strategic risk management, enabling experts to navigate the intricacies of the market with finesse and precision.
At the heart of the "Range Breakout Strategy" lies the art of recognizing and capitalizing on price ranges. Seasoned traders understand that markets often alternate between periods of consolidation and trending movement. By identifying these ranges on the EURUSD chart, traders can anticipate potential breakout opportunities that could lead to significant gains.
Once a range is identified, experts monitor the price action closely, waiting for a breakout that is accompanied by volume confirmation. This synergy of price movement and volume lends greater credibility to the breakout, indicating a potentially strong and sustained move. This confirmation serves as the catalyst for initiating a trade, allowing traders to position themselves strategically.
Identifying range on EURUSD chart

Image Source: TradingView
First, you need to identify a trading range on the EURUSD chart. A trading range occurs when the price of a currency pair moves within a relatively tight range, characterized by clear support and resistance levels. These levels can be identified through technical analysis tools such as horizontal trendlines, moving averages, or Bollinger Bands.
Trading breakout with volume confirmation

Image Source: TradingView
Once you've identified the trading range, you'll wait for a breakout to occur. A breakout happens when the price moves beyond the established range, potentially indicating a new trend direction. To increase the probability of a successful breakout trade, you can use volume confirmation. The higher trading volume during the breakout suggests increased market participation and can provide more confidence in the validity of the breakout.
Protecting profits with trailing stop
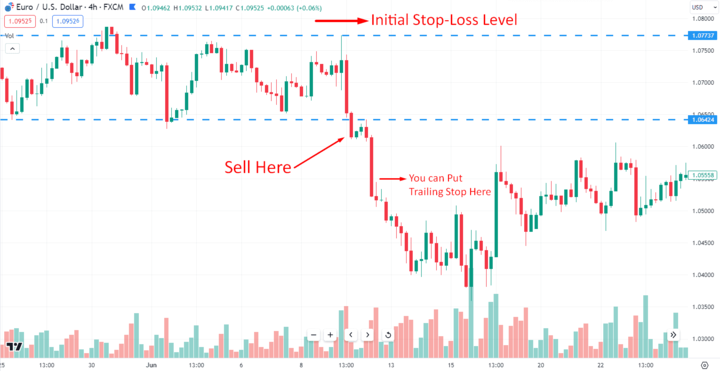
Image Source: TradingView
After entering the trade, it's important to manage your risk and protect your profits. A trailing stop is a stop-loss order that moves with the price as it moves in your favor. This means that if the price moves in the direction you anticipated, the trailing stop will adjust to lock in profits and provide a buffer against sudden reversals.
Pullback Entry in a Downtrend

Image Source: TradingView
Pullback Entry in a Downtrend technique stands as a powerful tool, allowing expert traders to navigate complex market dynamics with finesse and precision.
The foundation of the "Pullback Entry in a Downtrend" strategy lies in identifying and capitalizing on pullbacks within a well-established downtrend. Expert traders use moving averages to define the prevailing downtrend on the EURUSD chart. By analyzing the relationship between shorter and longer-term moving averages, traders gain insights into the strength and direction of the trend.
Once the downtrend is confirmed, traders await a pullback to the 20-period moving average (MA), which acts as a dynamic support level. This pullback provides an attractive entry opportunity, aligning with the broader downtrend. Expert traders recognize that these pullbacks often offer optimal risk-to-reward ratios, positioning them for potential gains.
Defining EURUSD downtrend with moving averages
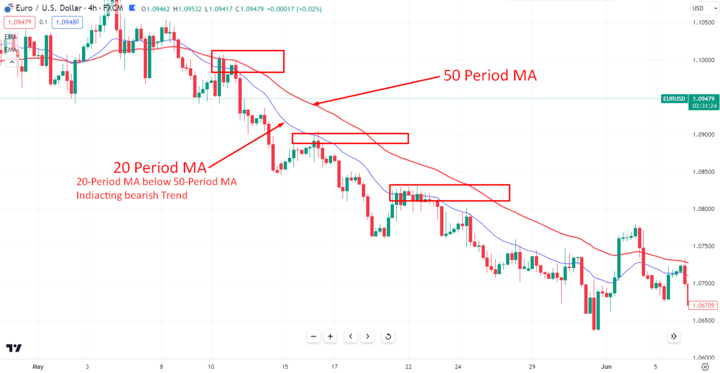
Image Source: TradingView
To identify a downtrend, you can use moving averages (MAs) as trend indicators. For this strategy, you might consider using two moving averages: a longer-term moving average ( 50-period MA) and a shorter-term moving average ( 20-period MA). In a downtrend, the shorter-term MA should be below the longer-term MA, indicating a bearish bias.
Buying pullback to 20-period MA
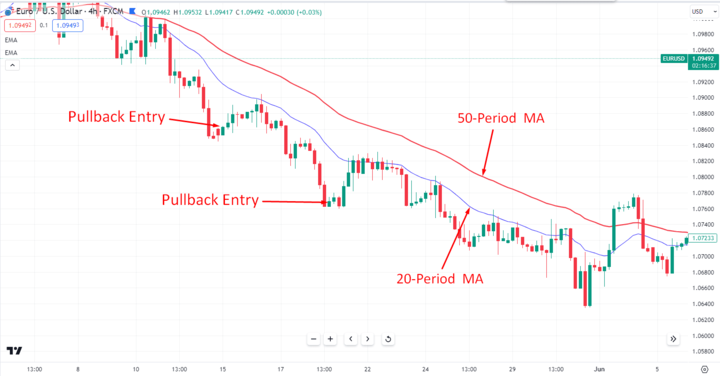
Image Source: TradingView
When you observe a downtrend on the EUR/USD chart and you're looking for a pullback entry, follow these steps:
- Wait for the price to make a retracement or pullback against the prevailing downtrend.
- Monitor the price as it approaches the 20-period MA (which should be positioned below the 50-period MA).
- Look for signs of price stabilization, such as candlestick patterns or a decrease in selling pressure, as the price interacts with the 20-period MA.
- Once you see potential signs of a reversal or slowing of the pullback, consider entering a long position (buy) if the price starts to move back in the direction of the downtrend.
Managing uptrend/downtrend transitions
![]()
Image Source: TradingView
To manage transitions between uptrends and downtrends, it's important to remain vigilant for potential changes in market conditions. Consider the following:
- Moving Average Crossovers: Keep an eye on the interaction between the 20-period and 50-period moving averages. A crossover where the 20-period MA crosses above the 50-period MA could signal a potential reversal or transition to an uptrend.
- Confirmation: Look for additional confirmation signals, such as candlestick patterns, chart patterns, or momentum indicators, to validate a potential change in trend direction.
- Stop-Loss and Trailing Stop: Place a stop-loss order below the recent low of the pullback to protect against potential losses. As the trade moves in your favor, you can consider using a trailing stop to protect profits while allowing for potential further gains.
Inside Bar Momentum Breakout
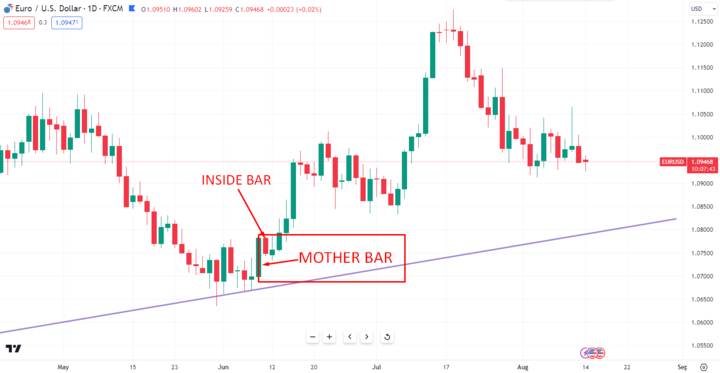
Image Source: TradingView
EURUSD trading calls for an arsenal of sophisticated strategies. Among these advanced techniques, the "Inside Bar Momentum Breakout" strategy stands out as a dynamic tool, empowering expert traders to navigate the complexities of the market with precision and foresight.
The essence of the "Inside Bar Momentum Breakout" strategy lies in identifying and capitalizing on a specific candlestick pattern, the inside bar, as it emerges following an uptrend in the EUR USD pair. This pattern reflects a momentary consolidation, often signifying a temporary pause before the prevailing trend resumes. Expert traders anticipate the potential breakout of this pattern to continue riding the established trend.
EURUSD forms inside bar after uptrend
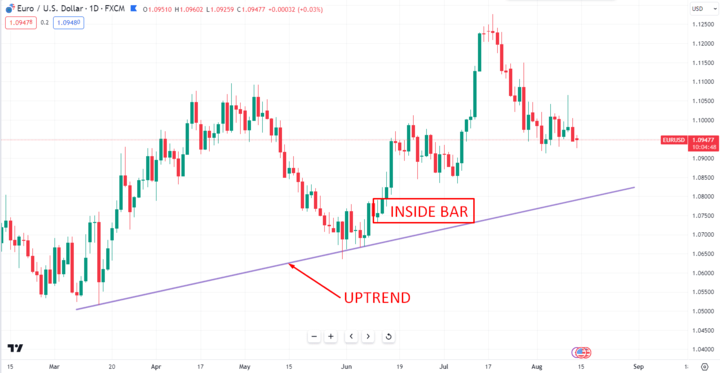
Image Source: TradingView
An inside bar is a candlestick pattern where the entire price range (high to low) of the current candle is contained within the range of the previous candle. In this case, you're looking for an inside bar pattern that forms after an uptrend. This indicates a potential pause or consolidation in the prevailing trend.
Buying break above inside bar high
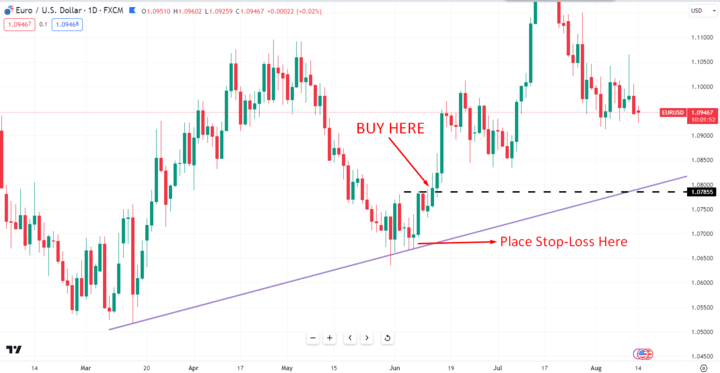
Image Source: TradingView
Once you've identified an inside bar after an uptrend, you can consider the following steps:
- Wait for the price to break above the high of the inside bar. This breakout suggests a potential continuation of the uptrend.
- Enter a long position (buy) as soon as the price breaks above the inside bar high.
- Place a stop-loss order below the low of the inside bar to limit potential losses.
Using momentum oscillator for confirmation

Image Source: TradingView
To add confirmation to your entry decision, you can incorporate a momentum oscillator, such as the Relative Strength Index (RSI) or Moving Average Convergence Divergence (MACD). These indicators can help you assess the strength of the momentum behind the breakout. Here's how you might use the RSI:
- Check the RSI indicator to see if it's in an overbought or neutral zone before the breakout.
- After the breakout occurs and you're considering entering a trade, ensure that the RSI is confirming the upward momentum by moving higher or staying in the overbought territory.


Conclusion
Mastering EUR/USD trading is a journey that demands a comprehensive playbook of advanced strategies, as showcased throughout this guide. By delving into various techniques, expert traders gain valuable insights into the intricacies of the market, enabling them to navigate the dynamic landscape with precision and expertise.
EURUSD trading success is a multifaceted one that combines technical analysis, pattern recognition, and strategic decision-making. By mastering the art of integrating candlestick patterns and indicators, expert traders position themselves to navigate the volatility and opportunities of the market with confidence and proficiency. As you reflect on the insights gleaned from these advanced strategies, remember that continuous learning, adaptability, and disciplined execution are the cornerstones of achieving lasting success in EURUSD trading.