Introduction to Technical Analysis
Are you looking to enhance your CFD trading skills? Mastering GBPUSD technical analysis is an extensive guide tailored for you to enhance your CFD trading skills. In this article, we'll delve into the fundamentals of technical analysis, its relevance in the current market scenario of 2023, and its application in the context of GBPUSD trading.
Understanding technical analysis is crucial as it aids traders in predicting price movements by analyzing historical market data. By differentiating it from fundamental analysis, which focuses on the intrinsic value of assets, we emphasize the significance of technical indicators in the fast-paced world of CFD trading.
Chart Patterns in GBPUSD
Image Source: Unsplash
Chart patterns in GBPUSD are specific formations that traders observe on the price chart of the British pound to US dollar currency pair. These patterns can provide insights into potential price movements and trend reversals, helping traders make informed trading decisions. Here are some common chart patterns seen in GBPUSD trading:
Major reversal patterns
In GBPUSD, chart patterns that signal a potential change in the prevailing trend of the British pound to US dollar currency pair. Some of the major reversal patterns include:
Head and Shoulders: This pattern consists of three peaks/bottoms where the middle peak/bottom (head) is higher/lower than the other two (shoulders). It signals a potential trend reversal from bullish to bearish or vice versa.
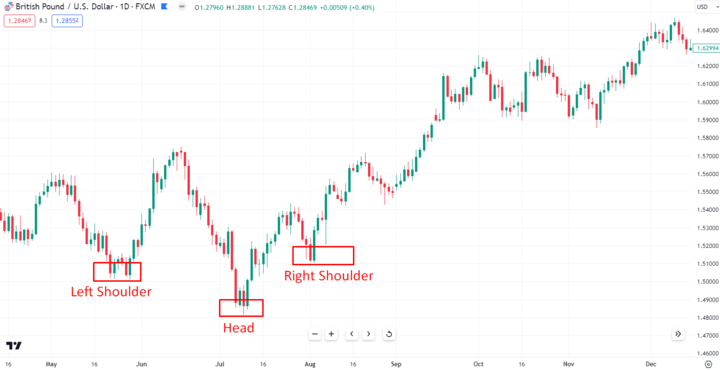
Image Source: TradingView
Double Tops/Bottoms: These patterns occur when the price reaches two nearly identical peaks (tops) or troughs (bottoms). A double top indicates a potential trend reversal from bullish to bearish, while a double bottom suggests a reversal from bearish to bullish.
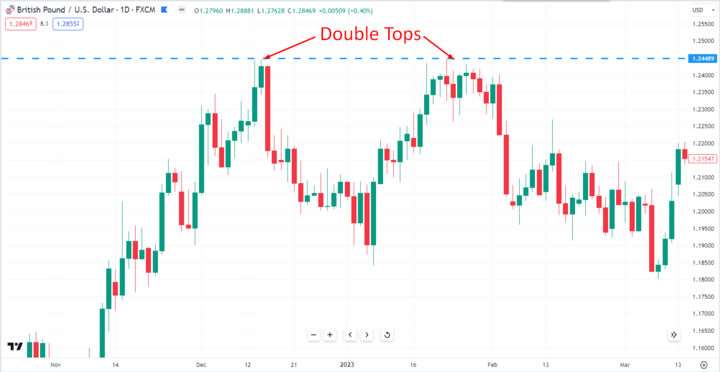
Image Source: TradingView
Triple Tops/Bottoms: Similar to double tops/bottoms, but with three peaks or troughs. Triple tops/bottoms are rarer but carry stronger reversal signals.
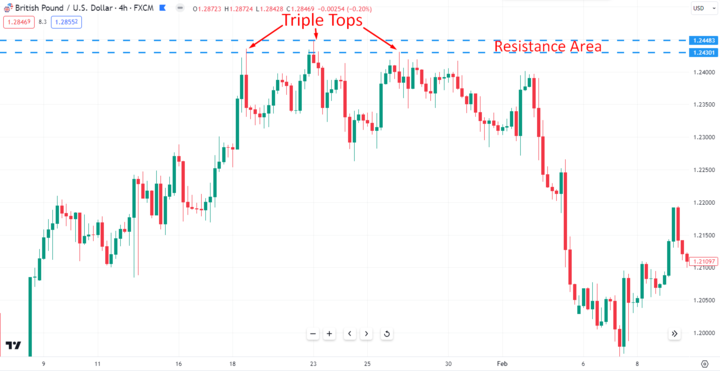
Image Source: TradingView
Continuation patterns
In GBPUSD chart patterns that suggest the continuation of the prevailing trend in the British pound to US dollar currency pair. Traders use these patterns to anticipate that the existing trend, whether it's upward or downward, is likely to persist after the pattern is formed. Some common continuation patterns include:
Flags: These patterns are characterized by a sharp price movement followed by a consolidation phase in the form of a rectangular flag. Flags suggest that the market is likely to continue in the direction of the initial price movement.
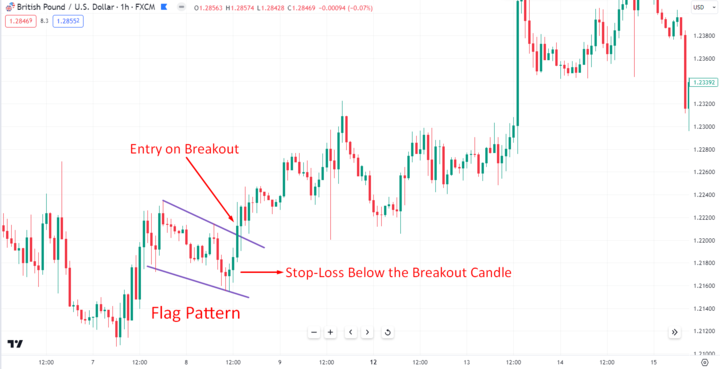
Image Source: TradingView
Pennants: Similar to flags, pennants are also consolidation patterns, but they have a triangular shape. They indicate a brief pause in the trend before it resumes its previous direction.
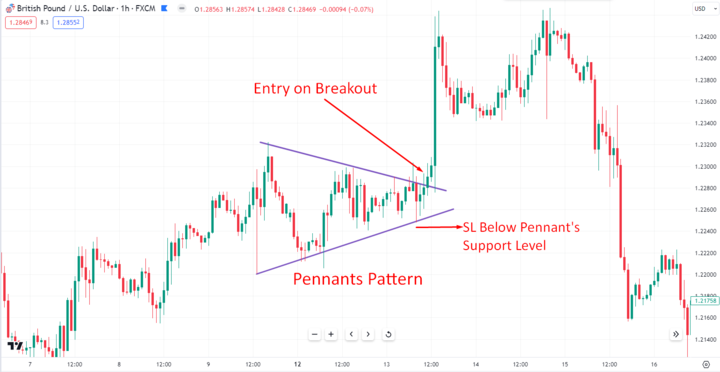
Image Source: TradingView
Rectangles: These patterns form when the price trades within parallel horizontal lines, indicating a period of indecision before a potential continuation of the trend.
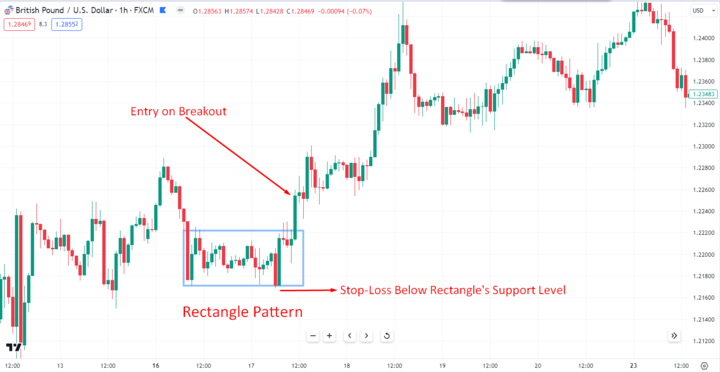
Image Source: TradingView
Triangles: Triangles can be ascending, descending, or symmetrical. They represent a period of decreasing volatility and indicate an impending breakout.
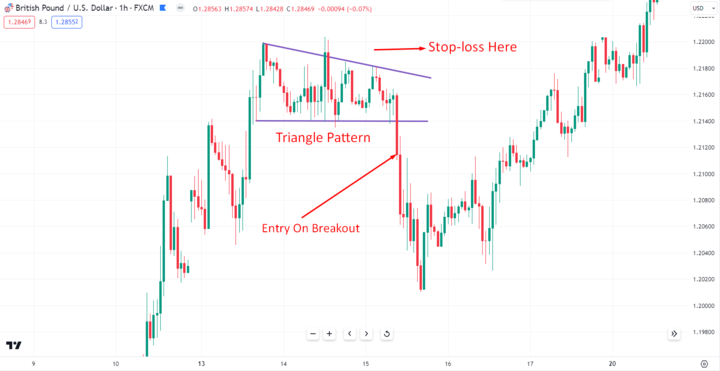
Image Source: TradingView
Trends and Channels
As a CFD trader, understanding trends and channels is crucial for making informed trading decisions in the dynamic GBPUSD market. Identifying overall trends allows you to gauge the general direction of the market, whether it's in an uptrend, downtrend, or moving sideways.
Identifying overall trends
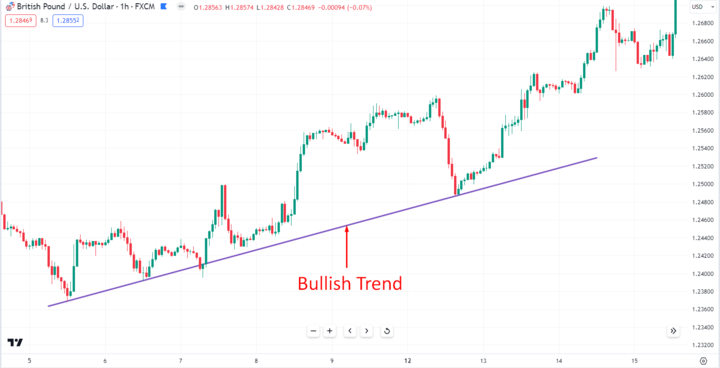
Image Source: TradingView
To effectively identify trends, draw trendlines connecting successive higher lows in an uptrend or successive lower highs in a downtrend. Sideway markets are characterized by price movements that lack a clear up or down direction. Once you have identified a trend, drawing channels can further help you visualize price movements within a defined range. These trendlines act as dynamic support and resistance levels to help you make informed trading decisions.
Drawing Trendlines and Channels
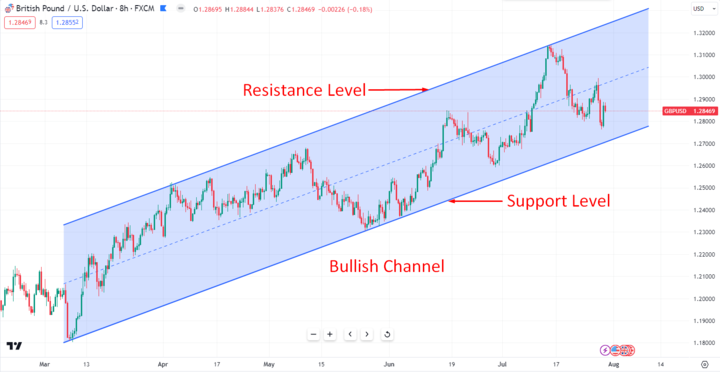
Image Source: TradingView
Drawing trendlines and channels enables you to visualize the trend's direction and potential trading opportunities. Channels are created by drawing parallel lines connecting consecutive highs and lows in a trend. They provide valuable insights into potential price targets and areas of price containment. In an uptrend, the channel encompasses the rising price action, while in a downtrend, it encapsulates the falling price action.
Trading pullbacks and breakouts
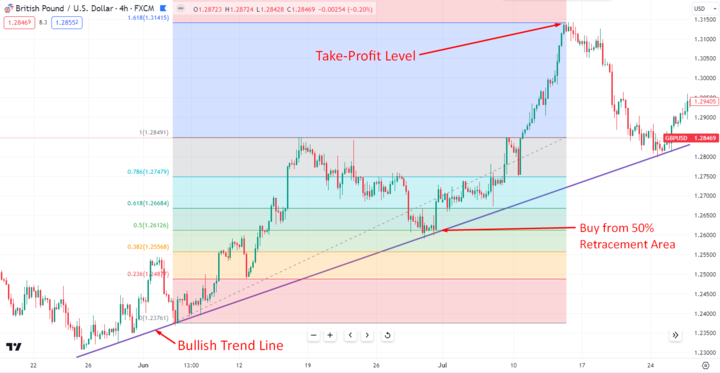
Image Source: TradingView
Trading pullbacks and breakouts within trends can be profitable strategies. A pullback occurs when the price briefly retraces against the trend before resuming its direction. You can identify potential pullback opportunities using Fibonacci retracement levels or other oscillators.
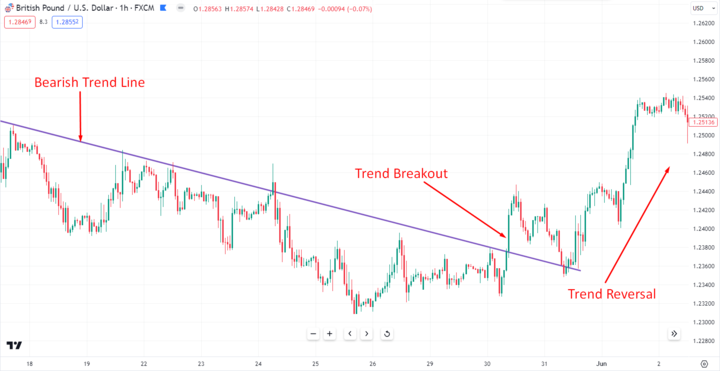
Image Source: TradingView
Breakouts, on the other hand, occur when the price breaches a trendline or channel boundary, signaling a potential shift in the trend. Combining breakout confirmation with increased trading volume can enhance the reliability of such signals.
Using moving averages to define trends
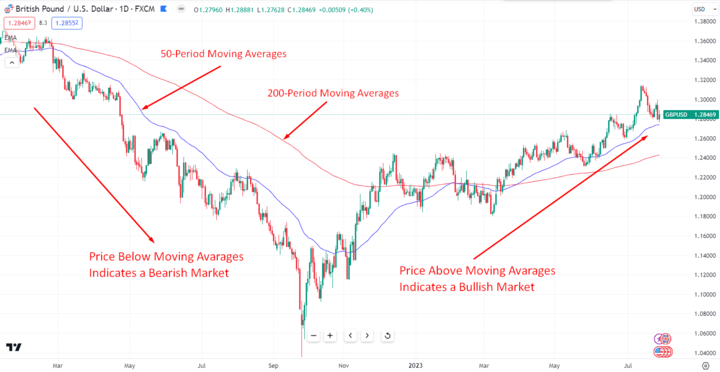
Image Source: TradingView
Moving averages can be useful tools for defining trends, as they smooth out price fluctuations over a specific period. The intersection of short-term and long-term moving averages can provide additional confirmation of trend changes. The 50-day and 200-day moving averages are commonly used by traders to assess the overall trend direction. If the price stays above the moving averages, it indicates an upward trend, and if it stays below them, it indicates a downward trend.
Support and Resistance Levels
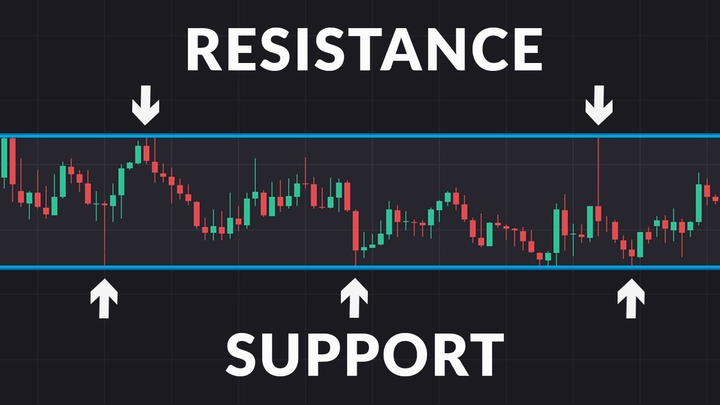
Image Source: istockphoto
Support and resistance levels are key concepts in the technical analysis used to identify potential price levels where the GBPUSD currency pair is likely to experience buying (support) or selling (resistance) pressure. These levels can act as psychological barriers for traders and can influence their decisions, such as entering or exiting positions, setting stop-loss orders, or taking profit targets.
Understanding support and resistance concepts
Support levels are price levels where the GBPUSD exchange rate historically tends to find buying interest, preventing further decline. Resistance levels, on the other hand, are price levels where selling interest typically emerges, halting upward movements. Identifying these key S/R levels from past price actions can offer valuable insights into future market behavior.
Identifying key support and resistance levels from past price action
Support levels refer to price levels where the demand for an asset is strong enough to prevent it from falling further. Traders often identify support levels by observing past price action, looking for areas where the price has bounced back after reaching a certain point.
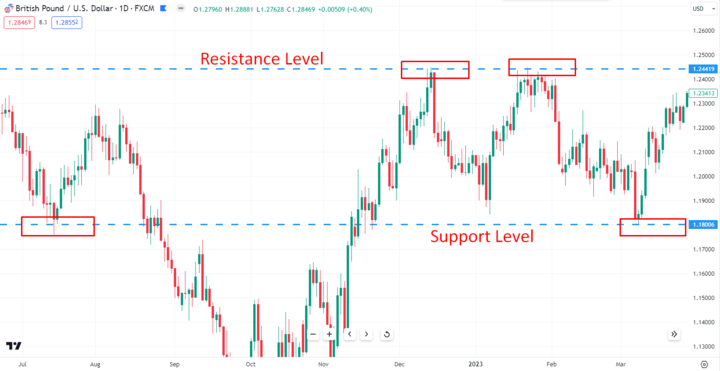
Image Source: TradingView
Resistance levels, on the other hand, are price levels where the selling pressure is sufficient to prevent an asset from rising further. Traders can pinpoint resistance levels by studying historical price data to identify areas where the price has struggled to break above.
Trading bounces from support and resistance levels
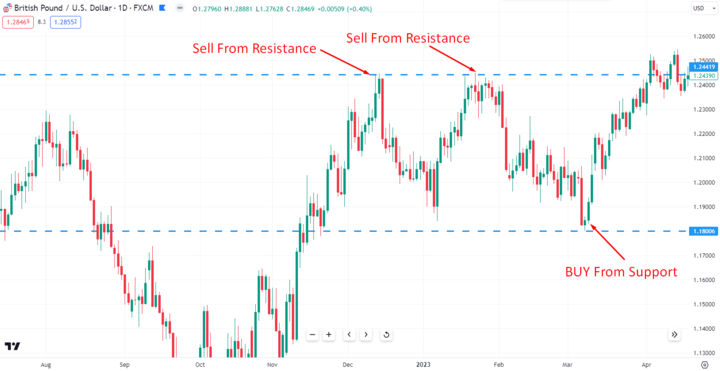
Image Source: TradingView
When trading bounces from support or resistance levels, you look for the price to reverse direction once it reaches these levels. Buying on support and selling on resistance can be a profitable strategy, but it's crucial to wait for confirmation signals, such as candlestick patterns or momentum indicators, to increase the probability of a successful trade.
Breaks and breakouts from support and resistance levels
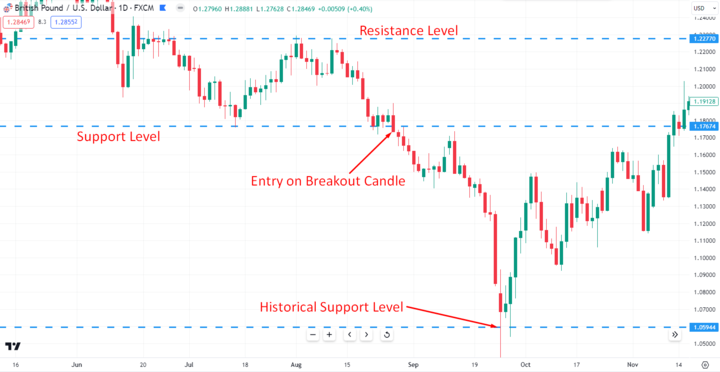
Image Source: TradingView
Breaks and breakouts from support and resistance levels are equally important to consider. A break occurs when the price moves decisively through a support or resistance level, signaling a potential trend change. On the other hand, a breakout happens when the price moves beyond a key support and resistance level, indicating a potential continuation of the current trend.
Indicators and Oscillators

Image Source: Unsplash
Indicators and oscillators in GBPUSD refer to various technical analysis tools that traders use to analyze price movements and identify potential trends, momentum, and market conditions. These tools are mathematical calculations based on historical price and volume data. Here are some common indicators and oscillators used in analyzing the GBPUSD currency pair:
Moving averages
Moving averages in GBPUSD are widely used technical indicators that help traders analyze the average price of the currency pair over a specific period of time. The moving average smooths out price fluctuations and provides a clearer picture of the prevailing trend.
- Exponential Moving Average (EMA):This gives more weight to recent price data, making it more responsive to current market conditions compared to the SMA. It calculates the average by applying a weighting factor to the most recent price data and then gradually decreasing the weight for older data points.
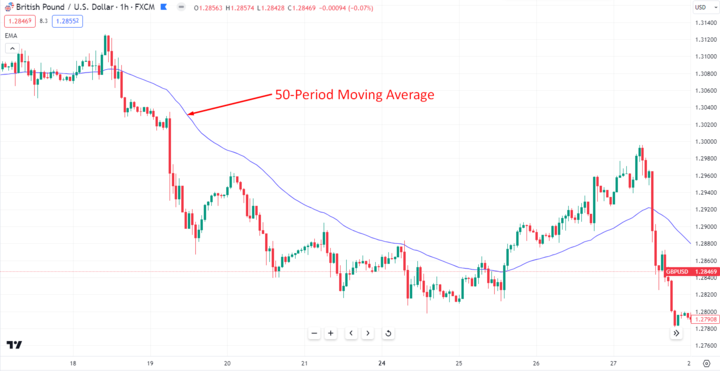
Image Source: TradingView
- Simple Moving Average (SMA):Provides equal weight to all price data points, offering a smoother representation of the trend. The SMA is calculated by adding the closing prices of GBPUSD over a defined number of periods and then dividing the sum by the number of periods. For example, a 50-day SMA will add up the closing prices of the past 50 days and divide it by 50 to get the average. The SMA reacts more slowly to recent price changes, making it more suitable for identifying long-term trends.
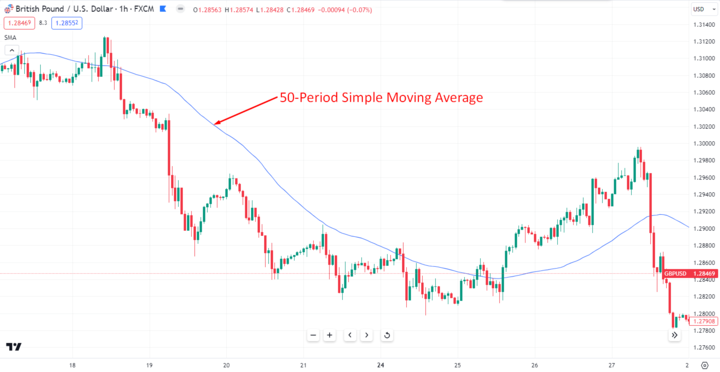
Image Source: TradingView
- Weighted Moving Average (WMA): The WMA is another type of moving average, but it assigns different weights to each price data point. It places more emphasis on recent prices, similar to the EMA, but with a different calculation method and the weightings can vary based on the trader's preference.
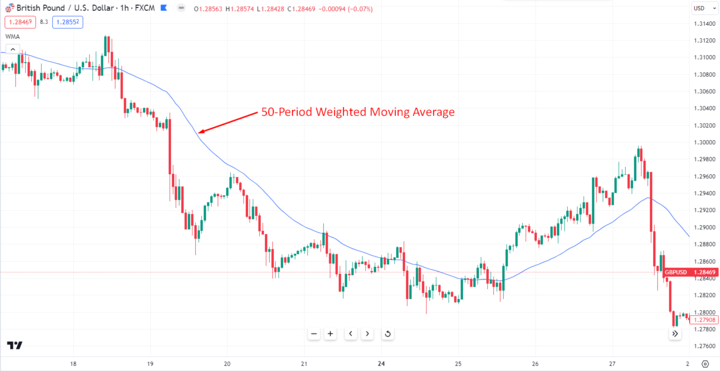
Image Source: TradingView
Momentum oscillators
These are technical indicators used to gauge the speed and strength of price movements in the British pound to the US dollar currency pair. These oscillators help traders identify overbought and oversold conditions, potential trend reversals, and the general momentum in the market. Some common momentum oscillators used in GBPUSD trading include:
- Relative Strength Index (RSI): Measures the speed and change of price movements, indicating overbought and oversold conditions.
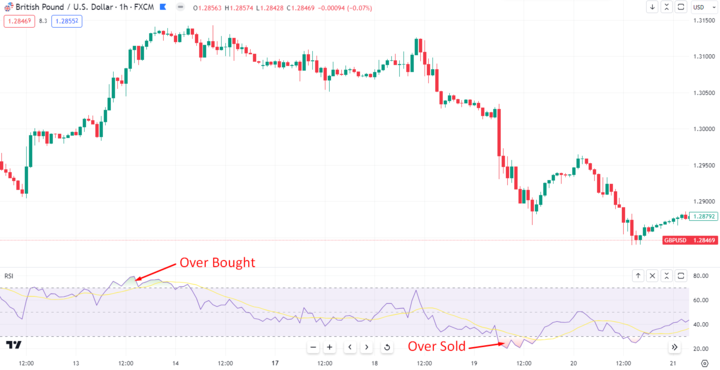
Image Source: TradingView
- Stochastic Oscillator: Compares a security's closing price to its price range over a specific period, signaling potential trend reversals.
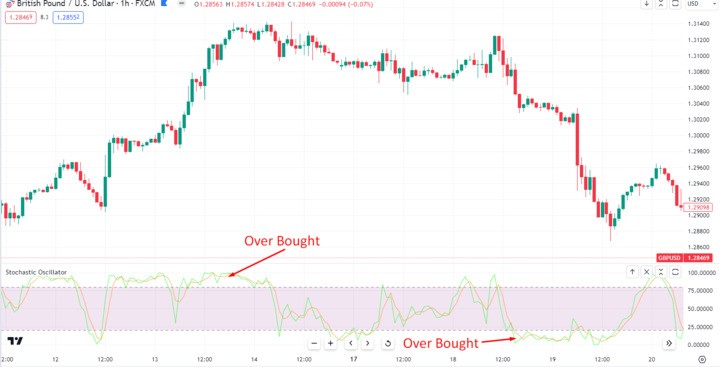
Image Source: TradingView
- Moving Average Convergence Divergence (MACD): Consists of two moving averages and reveals changes in the strength and direction of a trend.
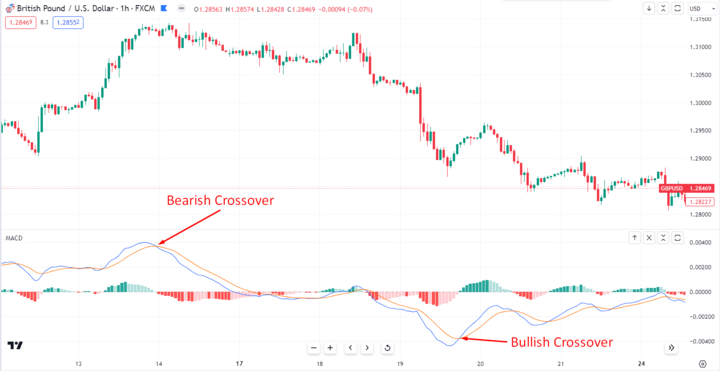
Image Source: TradingView
Using indicators to confirm trade signals
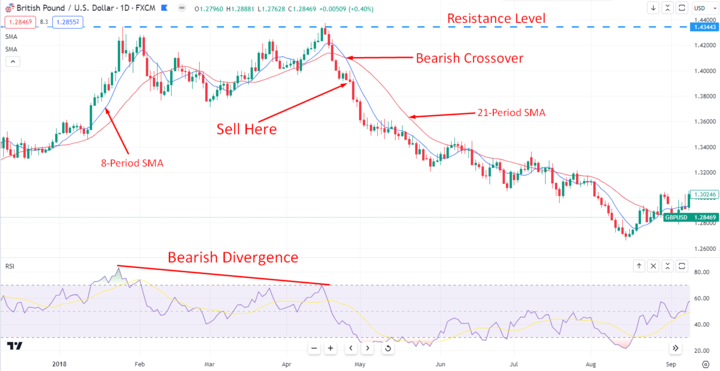
Image Source: TradingView
By using these indicators, you can confirm potential trade setups and make well-informed decisions. To improve the accuracy of your trading decisions, combine multiple indicators. For instance, when a moving average crossover coincides with a bearish RSI divergence, it strengthens the validity of a potential downtrend entry signal.
Divergence analysis
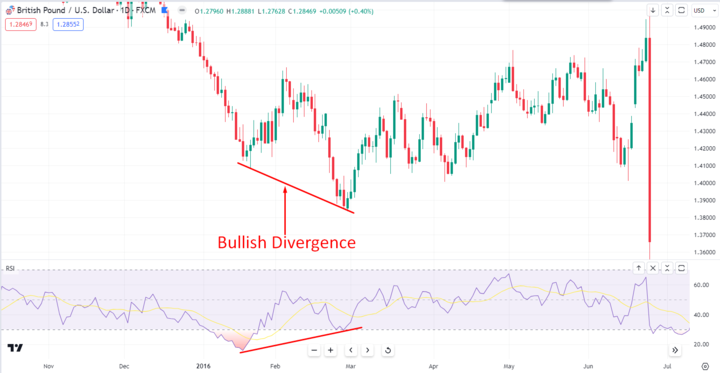
Image Source: TradingView
Divergence occurs when the direction of an indicator diverges from the price movement. Bullish divergence happens when the price makes lower lows while the indicator makes higher lows, suggesting a potential trend reversal to the upside, and vice versa for bearish divergence.
Candlestick Patterns
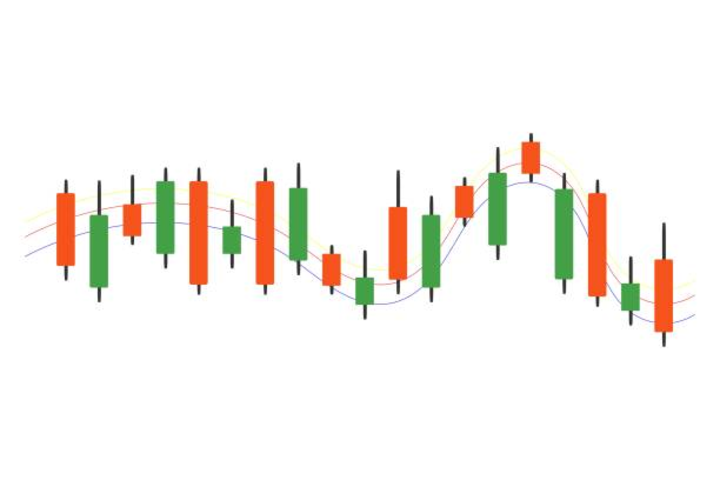
Image Source: Unsplash
Candlestick patterns are specific formations that traders observe in candlestick charts, providing insights into potential price movements and trend reversals in the British pound to US dollar currency pair.
Common candlestick signals
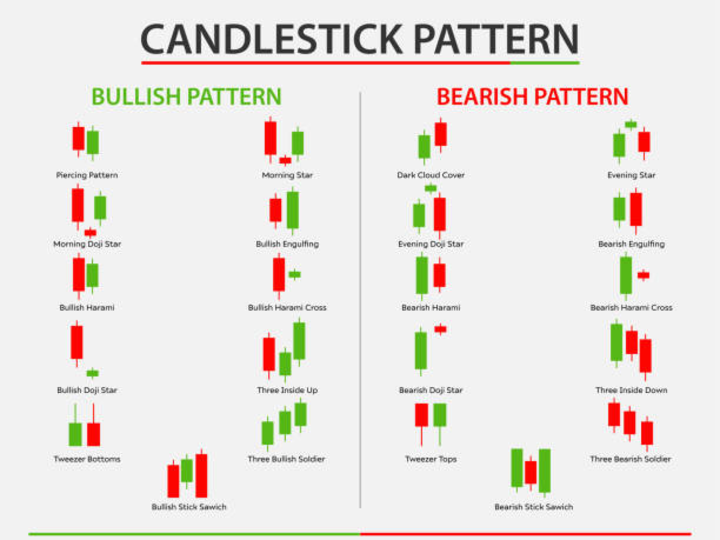
Image Source: Unsplash
Common candlestick signals refer to specific patterns or formations that traders observe in candlestick charts, which can provide insights into potential price movements or trend reversals in the British pound-to-US dollar currency pair. Here are some of the common candlestick signals:
- Doji: This pattern indicates indecision in the market, where the opening and closing prices are nearly the same, creating a cross-like appearance. A Doji suggests a potential trend reversal or continuation, depending on its position relative to preceding candles.
- Hammer: A Hammer pattern forms when the price has been declining but reverses sharply during the trading session, closing near its high. It signals a potential bullish reversal.
- Shooting Star: The Shooting Star is the opposite of the Hammer, occurring after an uptrend. It has a small body near the low and a long upper shadow, signaling a potential bearish reversal.
- Engulfing Patterns: Bullish and bearish engulfing patterns occur when one candle completely engulfs the previous one. They indicate potential trend reversals.
Candlestick pattern analysis and limitations
While candlestick patterns can provide valuable insights, they are not infallible and should be used in conjunction with other technical tools for confirmation. Additionally, they may produce false signals, particularly in volatile markets.
Combining candles with other indicators
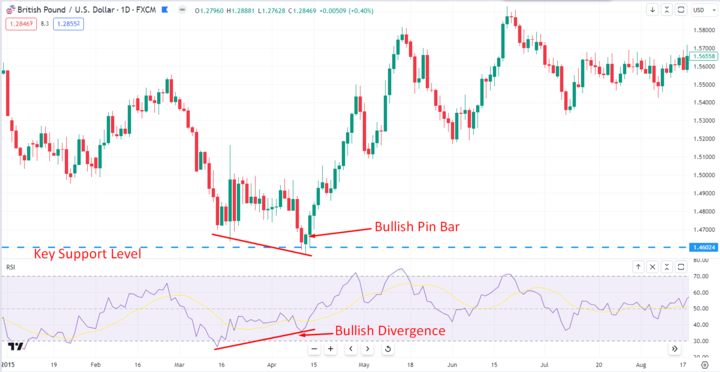
Image Source: TradingView
To increase the accuracy of your analysis, consider combining candlestick patterns with other technical indicators, such as moving averages, RSI, or support and resistance levels. This comprehensive approach can enhance your understanding of market trends and potential trade setups.
Trading Ranges and Volatility
Image Source: Unsplash
The combination of trading ranges and volatility in the GBPUSD can significantly impact trading strategies and risk management. For instance, during periods of low volatility and a clear trading range, traders might adopt range-bound strategies. On the other hand, during high volatility, traders might focus on breakout strategies or use additional risk controls to manage potential exposure to sudden price swings.
Identifying trading ranges and Channels
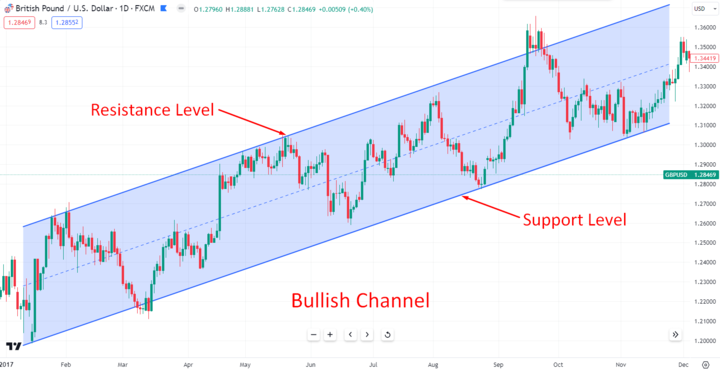
Image Source: TradingView
To identify trading ranges, look for horizontal price movements where the price repeatedly bounces between support and resistance levels. Drawing trendlines can help visualize these ranges. Channels are similar but include upward or downward slopes, indicating potential trend directions within the range.
Assessing volatility and its implications
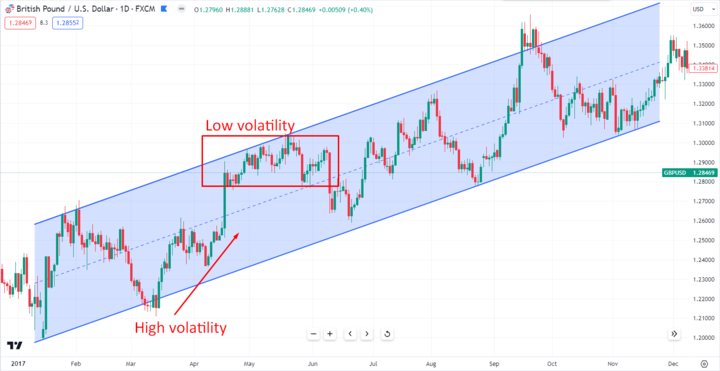
Image Source: TradingView
High volatility signifies large price swings, presenting both opportunities and risks. Low volatility, on the other hand, indicates price stability, potentially leading to narrower trading ranges. Understanding volatility helps traders adjust their strategies accordingly.
Trading breakouts and trading within range
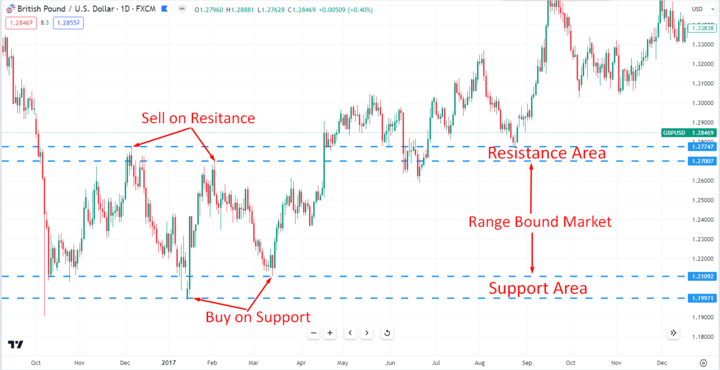
Image Source: TradingView
During periods of low volatility, trading within the range can be profitable by buying at support and selling at resistance. In contrast, during high volatility, trading breakouts becomes more attractive, as positions are taken when the price breaks above resistance or below support, anticipating significant price movements.
Advanced Technical Techniques

Image Source: Unsplash
Advanced technical techniques in GBPUSD CFD trading involve employing sophisticated analysis and tools to gain deeper insights into price movements and make more informed trading decisions. Here are some advanced techniques:
Fibonacci retracements, projections, and arcs
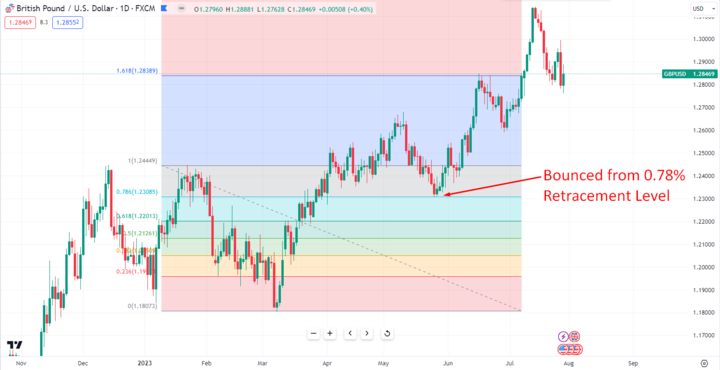
Image Source: TradingView
Fibonacci tools are based on the mathematical ratios discovered by Leonardo Fibonacci. Traders use Fibonacci retracements to identify potential support and resistance levels based on the key Fibonacci ratios (38.2%, 50%, and 61.8%). Fibonacci projections, on the other hand, help estimate future price targets. Additionally, Fibonacci arcs plot arcs based on Fibonacci ratios, providing further insights into potential price levels.
Elliott Wave Theory
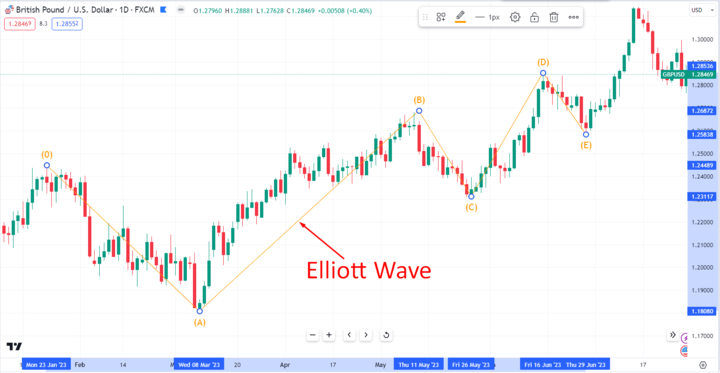
Image Source: TradingView
The Elliott Wave Theory postulates that markets move in repeating wave patterns influenced by investor psychology. Traders use wave counts to identify potential trends and corrections, helping them anticipate future price movements.
Ichimoku Cloud, Kagi charts
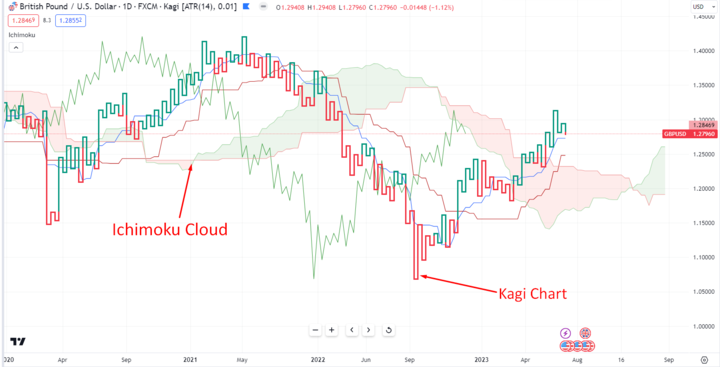
Image Source: TradingView
The Ichimoku Cloud is a comprehensive indicator that offers insights into support, resistance, trend direction, and momentum. Kagi charts are unique charts that use varying line thicknesses to filter out market noise, making trends more apparent.
Charting and Analysis Best Practices
Charting and analysis best practices in GBPUSD CFD trading involves using effective tools and techniques to make well-informed trading decisions. Here are some key practices to consider:
Multiple timeframe analysis
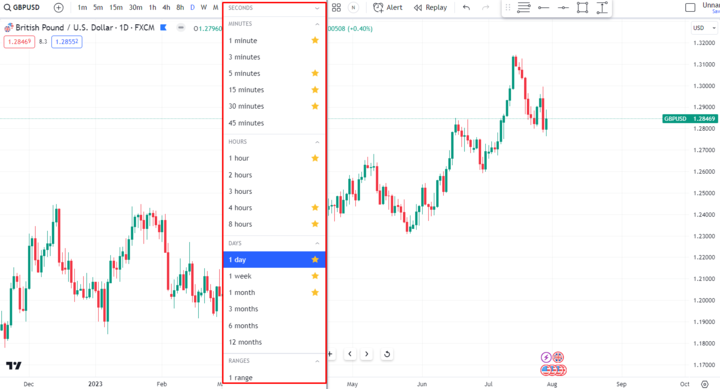
Image Source: TradingView
Utilize multiple timeframe analyses to gain a comprehensive view of the market. Assessing the price action on different timeframes, such as daily, hourly, and even minute charts, can help you identify trends, key support and resistance levels, and potential trade setups.
Accounting for false signals and invalidations
No technical analysis tool is immune to false signals or invalidations. It's crucial to be aware of this possibility and to avoid overreacting to single signals. Always seek confirmation from other indicators or techniques before making a trading decision.
Combining different techniques for confluence
Confluence occurs when multiple technical indicators or techniques align to support a particular trading idea. Combining various tools, such as trendlines, moving averages, candlestick patterns, and Fibonacci levels, can provide a higher level of confidence in your analysis.


Conclusion
In this comprehensive guide for GBP/USD CFD traders in 2023, we have covered key technical analysis concepts to successfully navigate the dynamic GBP USD market. From understanding chart patterns, trends, and support/resistance levels to exploring advanced techniques like Fibonacci analysis and Elliott Wave theory, you've gained valuable insights into market dynamics.
Remember, technical analysis is a continuous learning process that requires practice and discipline. Combining technical analysis with fundamental analysis can provide a holistic view of the market, enhancing your decision-making process. Stay updated with the latest market trends, use multiple timeframes for analysis, and be open to adjusting your approach as the market evolves.