Introduction
Recently, gold price has surged as global political and financial instability has increased due to the escalation of the Palestinian-Israeli conflict and the rise in U.S. bond yields. Gold prices typically rise during wars, recessions and financial crises because it is considered a relatively safe asset that provides a store of value and a safe haven. However, gold prices are also affected by other factors such as supply and demand and market expectations. This article provides a framework for analyzing the gold market, focusing on the relationship between long-term real interest rates and gold trends.
Gold as a safe haven
Recently, with the conflict in the Middle East and the rise in the term premium on U.S. debt, gold has returned to investors' attention as a safe-haven asset. From the perspective of the major global asset classes, gold is a special case. On the one hand, the price of gold has the strongest negative correlation with the U.S. dollar among major commodities, and its correlation with the prices of other commodities is generally low; on the other hand, gold, like other commodities, is a raw material for many industries, and its supply is limited. Unlike national currency, which can be issued at will. As a result, gold is one of the rare assets that is both a currency and a commodity, and is considered a safe haven asset. The drivers of the gold price are therefore complex.
The need to optimize investment portfolios over economic cycles
Different asset classes can have different return characteristics in different market cycles. Investing funds in different asset classes (such as stocks, bonds, real estate, gold, commodities, etc.) and different markets (such as stock markets, bond markets, commodities, etc.) helps reduce the impact of specific risks on the overall portfolio. When one asset or market segment declines, other segments may perform better, balancing the overall risk.
For example, stocks tend to perform well during economic booms, while bonds tend to perform better during recessions. By diversifying your investments, you can balance the performance of different asset classes and hopefully achieve stable returns in a variety of market conditions.
In 2004, Merrill Lynch introduced the concept of the Merrill Lynch Clock, which first appeared in the report "The Investment Clock: Making Money from Macro. The report uses U.S. economic data over the past 30 years, using the year-over-year growth rate and output gap data of the Consumer Price Index (CPI) as a reference, and divides the economic cycle into four distinct stages: Recovery, Overheat, Stagflation and Reflation, and also provides optimal asset allocation recommendations based on these different stages.
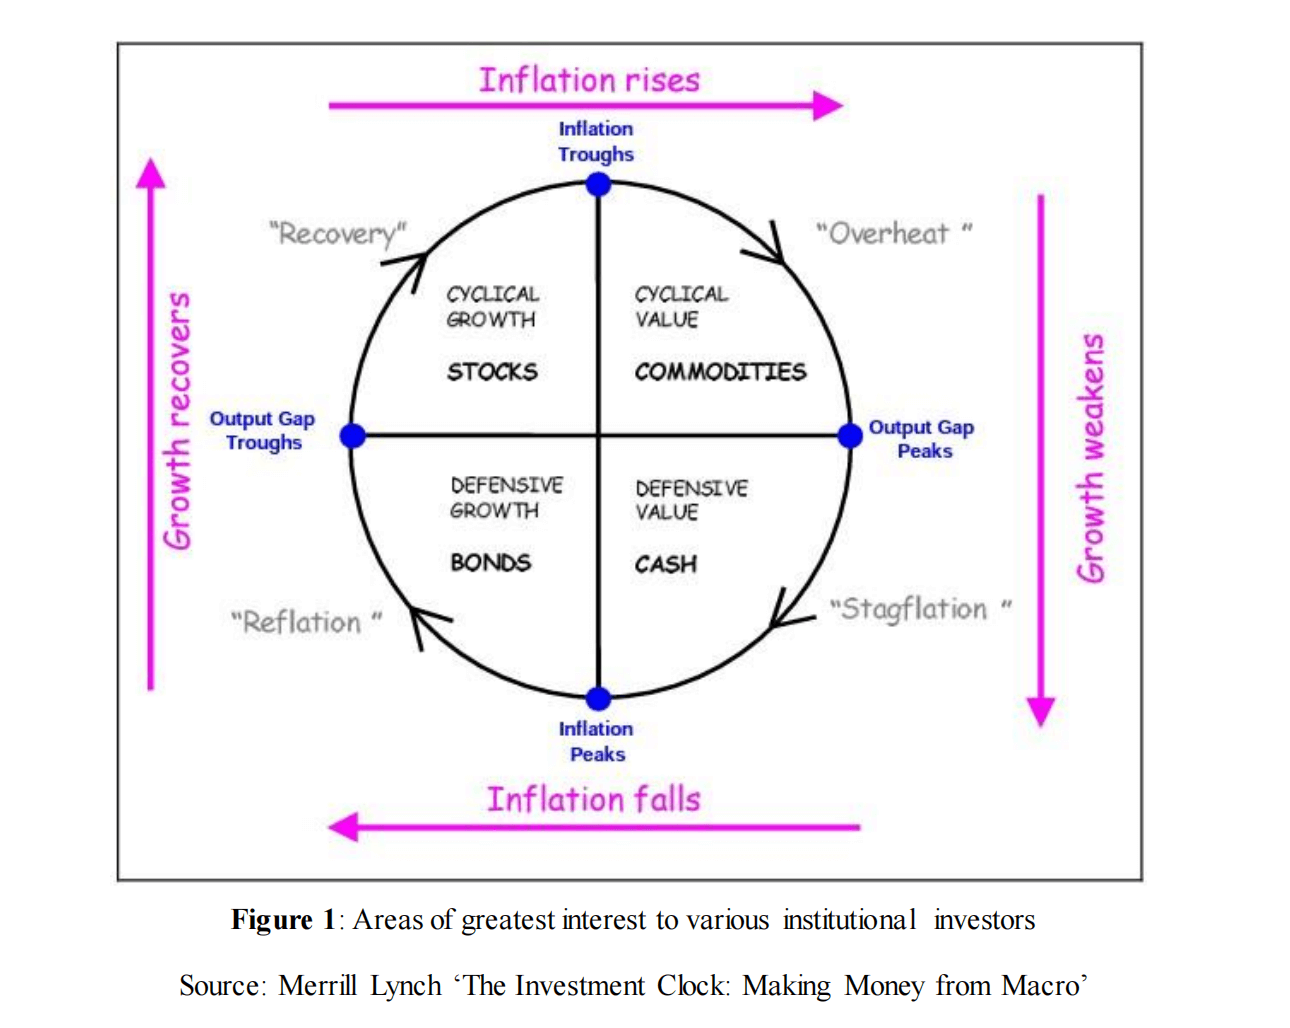
As shown in the figure above, the core idea of the Merrill Lynch Clock is to define different economic cycles based on the two main factors of economic growth and price levels, and to select different asset allocations for each cycle accordingly to take full advantage of conditions in different cycles. Differences in the performance of different asset classes. The basic logic is that a country's macroeconomic conditions will affect the various assets in that country's market and lead the government to make monetary and fiscal policy adjustments. These policy adjustments will, in turn, affect various assets in the market and, in turn, affect the country's economic conditions. In summary, cyclical changes in macroeconomic conditions and economic policies will affect the cyclical performance of various asset classes.
According to the Merrill Lynch Clock Framework, the economic cycle can be divided into four stages, and each stage has corresponding strong assets:
Reflation period: During this period, economic growth and price levels decline together, and there may even be a negative year-over-year growth rate in GDP or CPI. During this phase, commodity prices fall and corporate earnings fall, causing stocks to fall while the bond yield curve shifts downward and steepens. Typically, the central bank will begin to cut interest rates to stimulate a recovery in economic growth. During this period, bonds are often the best investment option, while defensive stocks tend to be favored in equities. Commodities tend to be the worst performers.
Recovery period: During the recovery phase, low interest rate monetary policies and stimulus programs help the economy gradually return to normal growth. Although idle capacity is still not fully utilized, i.e. the output gap is still negative, product prices continue to fall. CPI data continues to fall. Equity markets typically perform best during this period, especially cyclical and short-term value stocks, as loose monetary and fiscal policies spur a gradual recovery in corporate earnings. Product prices continue to fall, inflation continues to decline, and commodities begin to perform well. Money flows from the bond market into the stock market, causing bonds to underperform.
Overheat period: During the expansion period, production capacity gradually recovers, the output gap gradually narrows, and the inflation rate begins to rise. Central banks usually begin to raise interest rates to ensure sustainable economic growth and avoid overheating, but economic growth remains strong. During this period, bonds begin to fall and the yield curve becomes flat. The stock market faces a balance between corporate earnings growth and high valuations, with cyclical and short-term value stocks generally outperforming. As inflation is typically high and central banks begin to raise interest rates, real yields on bonds, cash, and equities are negatively impacted, while commodities perform strongly.
Stagflation period: During stagflation, GDP growth slows and productivity declines. However, because the output gap is positive and demand is strong, companies raise product prices to cope with the rising wage-price spiral and protect profits. During this period, central banks typically tighten monetary policy until inflation recedes, which weighs on bond performance, while equities fall on tighter monetary policy and lower corporate earnings, and commodities also underperform. During this period, cash is usually the best investment option, while in the equity market, defensive and long-term value stocks are more likely to be chosen.
Therefore, it is very important to allocate gold investment portfolios to assess the current economic cycle and predict the possible future direction through economic and inflation data.


Mismatch between economic cycle and financial cycles
However, there is a certain mismatch between the business cycle and the financial cycle. Financial markets often react quickly to changes in the economy, so their cycles may precede macroeconomic cycles. Investors in financial markets may act on their expectations, which can lead to an advance or a lag in the financial cycle. International factors, geopolitical events and other external factors can also cause inconsistencies between economic and financial cycles. The linkages between the global economy and financial markets, as well as the activities of multinational corporations, may further complicate this misalignment.
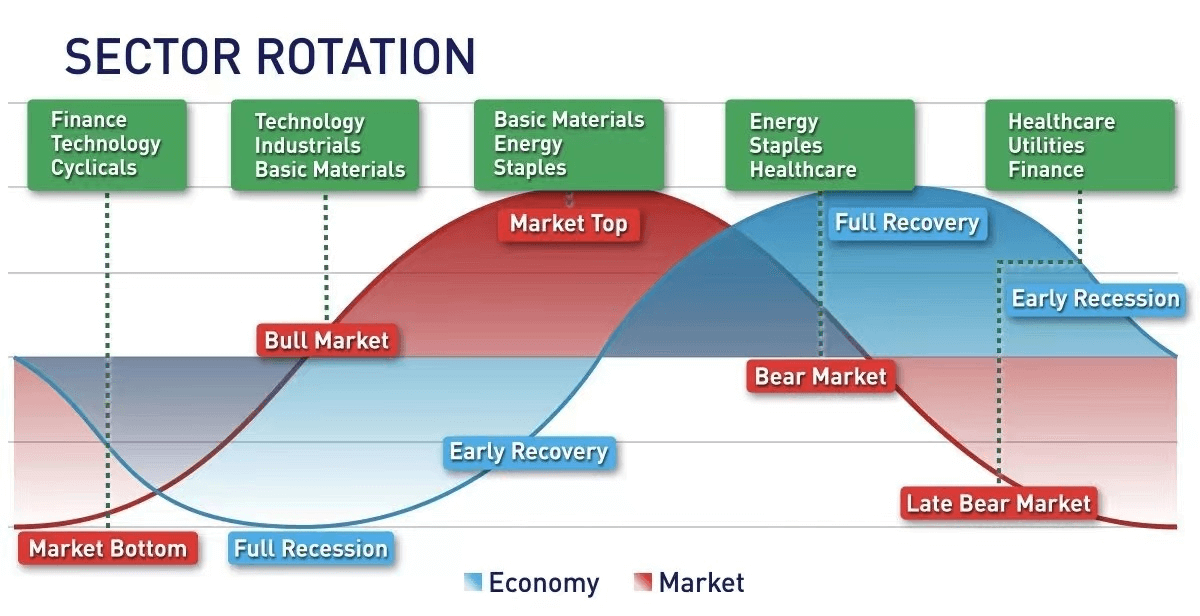
Generally speaking, the market will have bottomed before the economy enters a full-blown recession, and forward-looking investors will start buying assets at the bottom before the recession is severe. While the economy is in the midst of a recovery, the bull market may be halfway through. Before the economy fully recovers, the market will have peaked, and early investors will decide to sell to take profits at that time, causing a bear market to begin. By the time another recession occurs, a bear market has begun.
Generally speaking, the rise in the price of gold in a bull market far exceeds the decline in a bear market, which is why the price of gold is still well above its historical average.
Combining the predictions of the economic and financial cycles, we can roughly estimate whether the demand for gold, as a special commodity with hedging properties, will rise or fall in the current period.
US Bonds and Gold
Another factor closely related to gold's performance, and one that is easier to observe intuitively than the business and financial cycles, is the long-term real interest rate in the United States.
U.S. long-term real interest rates are long-term bond yields adjusted for inflation (the rate of inflation). It reflects investors' willingness to hold long-term bonds to earn real returns above the rate of inflation. Long-term real rate = long-term nominal rate - long-term inflation expectation. The level of long-term real interest rates is influenced by the nominal interest rate of the previous period and by long-term inflation expectations.
Typically, the 10-year US Treasury rate is used as a proxy for long-term bonds. The negative correlation between the U.S. 10-year Treasury bond yield and the price of gold is relatively obvious:
When inflation rises more than interest rates, real interest rates fall, driving gold prices higher (as people are more inclined to seek safe havens to fight inflation). In addition, when interest rates rise more than inflation, real interest rates rise, causing the price of gold to fall (as people are more willing to hold higher-yielding assets for higher interest income).
When interest rates and prices rise:
Inflation increase > Interest rate increase → Real interest rate decreases → Gold price increases (high inflation, anti-inflationary motivation increases)
Interest rate rise > Inflation rise → Real interest rate rises → Gold price falls (motivation to earn interest rises)
When both inflation and interest rates fall, the fall in inflation is greater than the fall in interest rates, and the real interest rate rises, causing the price of gold to fall (as the demand to fight inflation weakens). In addition, if interest rates fall by more than the decline in inflation, real interest rates will fall, causing the price of gold to rise (as people become more willing to hold non-interest-bearing assets such as gold for income).
When interest rates and prices fall:
Fall in inflation > Fall in interest rates → Rise in real interest rates → Fall in gold price (anti-inflationary motivation weakens)
Decline in interest rates > Decline in inflation → Decline in real interest rates → Increase in gold price (significant easing, weakening of the motivation to earn interest)
In short, by observation, changes in U.S. 10-year Treasury yields tend to have an inverse relationship with the performance of gold prices. When Treasury yields fall, gold prices tend to rise, and vice versa.
During periods of high inflation volatility, large swings in inflation expectations affect changes in long-term real interest rates, which in turn have a dominant influence on gold price movements. The level of long-term real interest rates reflects the opportunity cost of holding gold, which also influences the driver of gold price movements from an investment decision perspective.
During interest rate hike cycles in the United States, there is typically an inversion in long-term and short-term U.S. Treasury rates, signaling heightened concerns about an economic recession. As the Fed attempts to curb inflation by raising interest rates, short-term interest rates rise as the federal funds rate increases. At the same time, long-term interest rates are heavily influenced by market expectations of future economic prospects. Although they rise at the same time, they tend to rise less than short-term rates. This has led to a gradual narrowing or even reversal of term spreads.
Such a narrowing of interest rate differentials (such as the recent sell-off in long-term bonds, which turned term premiums positive) is typically followed by a significant decline in GDP growth. In addition, when pessimistic economic expectations emerge, it means that the likelihood of future interest rate cuts to stimulate economic growth increases, so the price of gold tends to rise.
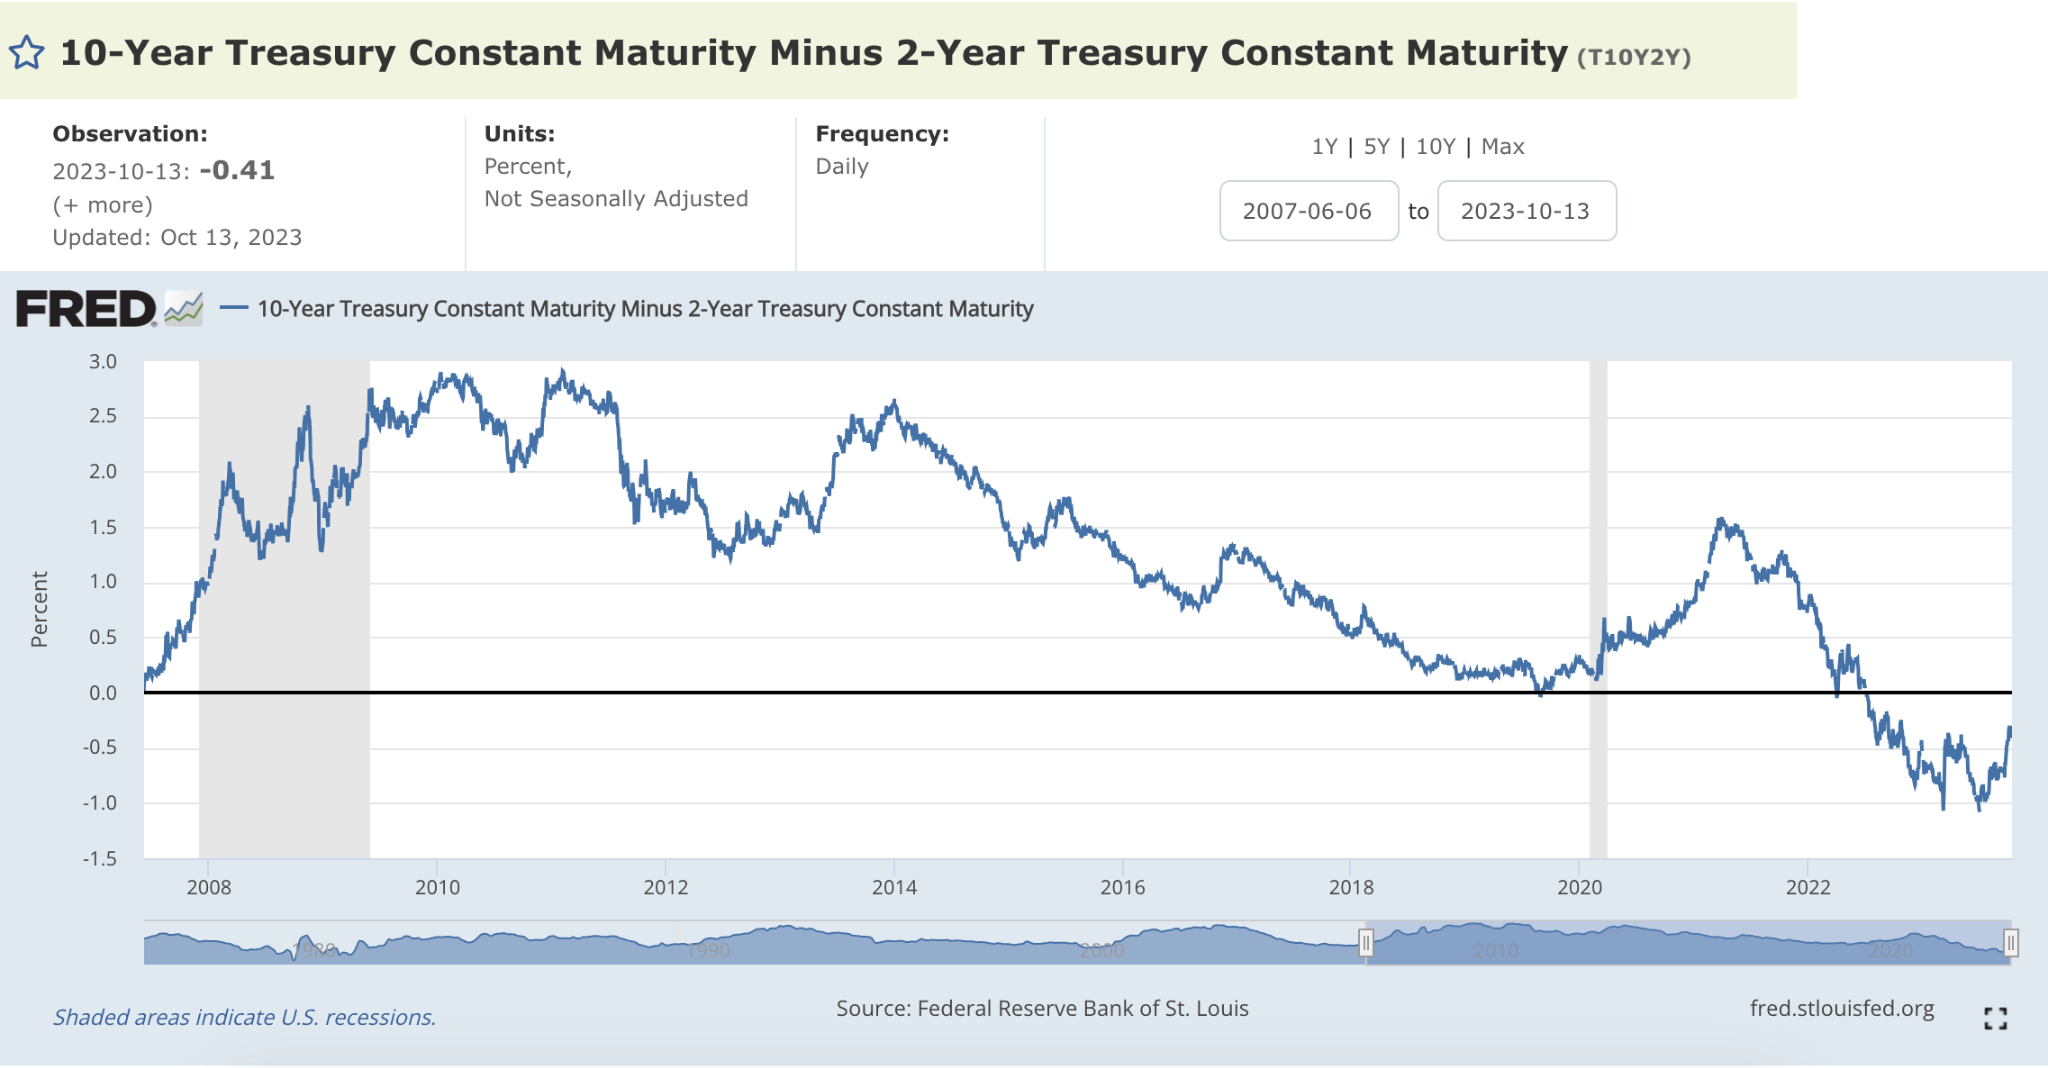
Chart: U.S. long-term and short-term Treasury yield spreads
Consider the term spread between 10-year and 2-year US Treasuries. Since July 2022, this spread has been inverted until recently when the term premium shrank or even turned positive. Real GDP growth has been weak, and manufacturing PMI data has also fallen to near the boom-bust line. This points to growing concerns about a US recession.
Therefore, it is expected that as the downward pressure on the macroeconomy intensifies, the room for U.S. interest rate hikes will be limited and gradually come to an end. Against this backdrop, with the real interest rate center moving upward, the price of gold may begin an upward cycle.