


- Net Income and EPS: JPMorgan's reported net income of $9.3 billion and EPS of $3.04 underscore its profitability and operational efficiency.
- Revenue Generation: The bank's substantial revenue of $39.9 billion highlights its diverse and robust business lines.
- ROTCE: A Return on Tangible Common Equity (ROTCE) of 15% reflects strategic focus, underpinning sustainable growth.
- Business Segment Performance: Strengths in Consumer & Community Banking, Banking & Wealth Management, and Corporate & Investment Banking contribute to JPMorgan's solid position.
Exploring different business segments, from Consumer & Community Banking to Corporate & Investment Banking, the article uncovers the multifaceted performance of JPMorgan's operations during Q4 2023. However, like any financial giant navigating the complexities of the market, there are considerations for potential risks. This article focuses on a balanced assessment, objectively presenting key metrics, segment performances, and 2024 projections while acknowledging the uncertainties that could shape JPMorgan's journey in 2024.
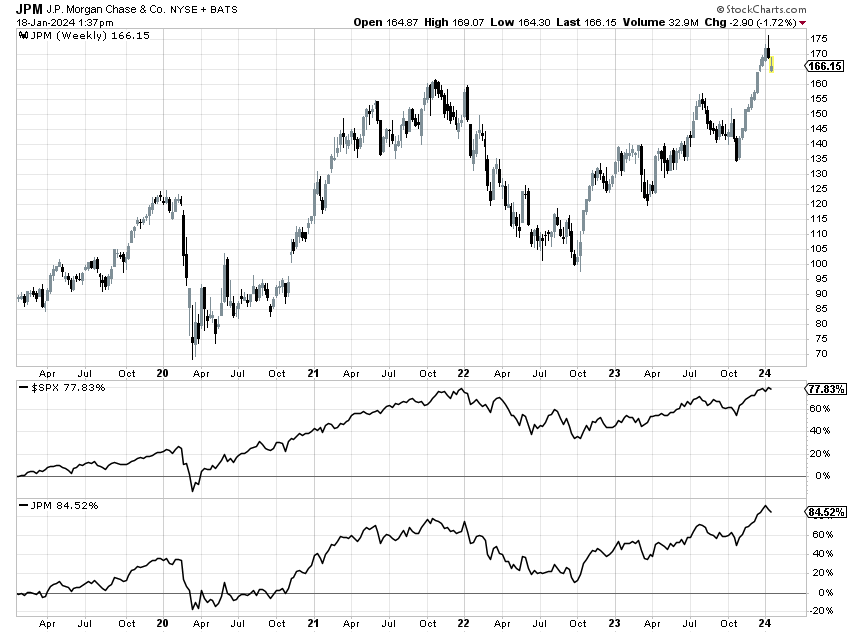
Source: stockcharts.com (Price Performance)
JP Morgan Financial Performance
Net Income and Earnings Per Share (EPS):
JPMorgan's robust financial performance is a primary fundamental strength supporting its rapid growth potential. The reported net income of $9.3 billion and EPS of $3.04 underscore the bank's profitability. Net income provides a holistic view of the overall earnings generated by the bank, while EPS measures the earnings attributable to each outstanding share, serving as a key metric for investors. JPMorgan's ability to consistently deliver strong net income and EPS reflects its operational efficiency and effective management of resources.
Revenue Generation:
The reported topline of $39.9 billion further highlights JPMorgan's strong revenue generation capability. Revenue is a critical metric for financial institutions, indicating the total income generated from various business activities. JPMorgan's substantial revenue underscores its diverse and robust business lines, contributing to its overall financial strength. The ability to generate significant revenue is a fundamental strength that supports the bank's growth potential.
Return on Tangible Common Equity (ROTCE):
The Return on Tangible Common Equity (ROTCE) of 15% reported by JPMorgan is a key indicator of the bank's efficiency in utilizing its tangible common equity to generate returns. ROTCE is a critical metric for assessing a financial institution's profitability and value creation for shareholders. JPMorgan's ROTCE of 15% reflects its strategic focus on optimizing returns and indicates a strong foundation for sustainable growth.
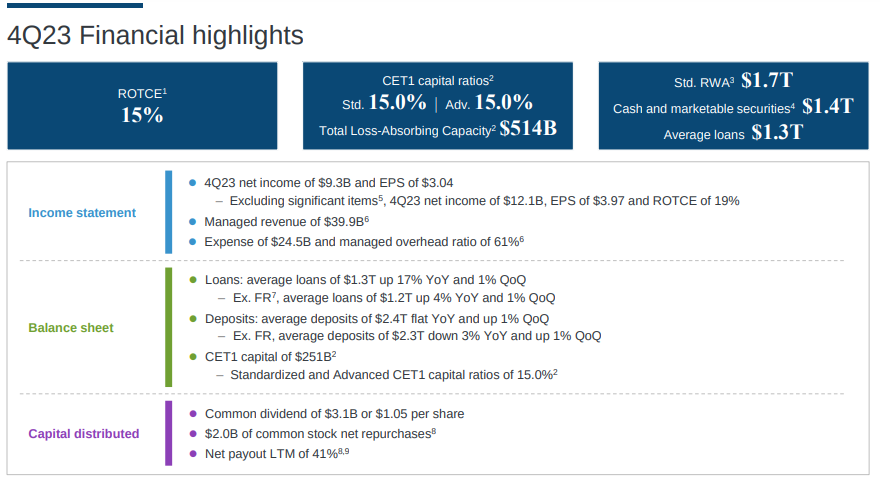
Source: Earnings Presentation
JPMorgan Business Segment Performance
Consumer & Community Banking (CCB):
Debit and Credit Card Spend:
In the Consumer & Community Banking segment (CCB), the reported 7% year-on-year increase in total debit and credit card spend showcases the bank's strength in consumer banking. The growth in card spend is a positive indicator, reflecting strong account growth and stable consumer spending patterns. This fundamental strength positions JPMorgan well in the retail banking sector.
Banking & Wealth Management:
The 6% year-on-year increase in revenue in Banking & Wealth Management highlights the bank's ability to navigate higher interest rates. Higher Net Interest Income (NII) due to increased rates, along with growth in client investment assets, demonstrates effective wealth management strategies. A record year for retail net new money further strengthens JPMorgan's position in wealth management.
Card Services & Auto:
The 8% year-on-year increase in revenue in Card Services & Auto, driven by higher card services Net Interest Income (NII) and strong account acquisition, showcases the bank's success in the credit card and auto financing sectors. With a 14% increase in card outstandings and a 32% rise in auto originations, JPMorgan demonstrates its market share gains and profitability in these segments.
Corporate & Investment Banking (CIB):
Investment Banking Revenue:
The CIB segment's reported net income of $2.5 billion on revenue of $11 billion reflects the bank's strength in investment banking. A 13% year-on-year increase in investment banking revenue, with notable growth in debt and equity underwriting fees, positions JPMorgan as a leader in capital markets activity. The bank's number one rank with a wallet share of 8.8% underscores its strong position in the investment banking landscape.
Markets Revenue:
In Markets, the total revenue of $5.8 billion, up 2% year-on-year, highlights JPMorgan's resilience in navigating market fluctuations. A record fourth quarter in fixed income, up 8%, indicates strength in the securitized products business. Despite an 8% decline in equity markets revenue, the bank's overall performance in Markets reflects its diverse capabilities.
Commercial Banking:
Revenue and Credit Performance:
Commercial Banking's reported net income of $1.5 billion on revenue of $3.7 billion demonstrates the bank's strength in serving commercial clients. A 7% year-on-year increase in revenue, driven by higher NII and payments revenue, highlights JPMorgan's ability to navigate changes in interest rates. Despite challenges in credit costs, with a net reserve build of $142 million driven by commercial real estate valuation outlook, the segment's performance showcases resilience.
Asset & Wealth Management (AWM):
Net Income and AUM Growth:
Asset & Wealth Management reported net income of $925 million with a pretax margin of 28%. The 2% year-on-year increase in revenue, driven by higher management fees and strong net inflows, reflects the bank's success in wealth management. Record client asset net inflows of $489 billion for the year contribute to the segment's robust growth. With AUM of $3.4 trillion and client assets of $5 trillion, JPMorgan's AWM segment demonstrates its ability to attract and retain clients.
Corporate:
Revenue and Expense Dynamics:
Corporate's reported net loss of $689 million and revenue of $1.8 billion highlight the impact of the FDIC special assessment and net investment securities losses. NII of $2.5 billion, up $1.2 billion year-on-year, underscores the segment's resilience in navigating higher rates and balance sheet mix. Despite the net loss in NIR, the segment's dynamics, including expenses driven by the FDIC special assessment, contribute to the overall understanding of JPMorgan's financial landscape.
JP Morgan Chase Full-Year Results and Capital Position
Full-Year Performance:
JPMorgan's full-year results reveal net income of $50 billion, EPS of $16.23, and revenue of $162 billion. Achieving an ROTCE of 21% for the full year emphasizes the bank's consistent profitability. The ability to deliver such strong results across diverse business segments positions JPMorgan as a key player in the financial industry.
Balance Sheet and Capital Position:
Ending the quarter with a Common Equity Tier 1 (CET1) ratio of 15%, up 70 basis points versus the prior quarter, reflects JPMorgan's robust capital position. Factors contributing to this increase include net income, Accumulated Other Comprehensive Income (AOCI) gains, and lower Risk-Weighted Assets (RWA). Despite the ongoing pace of capital distributions, the bank maintains a strong capital buffer, aligning with Basel III Endgame requirements.
JPMorgan Chase Outlook for 2024
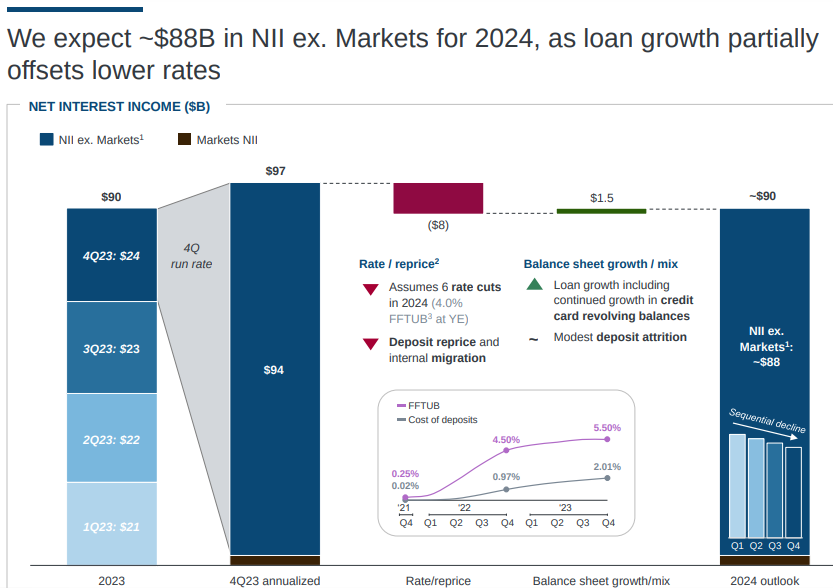
Source: Earnings Presentation
Net Interest Income (NII) and Expenses:
JPMorgan's outlook for 2024 forecasts NII ex-Markets to be approximately $88 billion. The outlook considers the impact of anticipated rate cuts and expectations for modest balance changes. Strong loan growth in Card is expected to offset some of the effects of lower rates, contributing to the overall NII. The expected expenses of about $90 billion for 2024 reflect the bank's strategic investments, including growth initiatives and ongoing business expansion.
Credit Performance:
The guidance for the 2024 card net charge-off rate to be below 3.5% underlines JPMorgan's commitment to managing credit risk effectively. Despite economic and geopolitical uncertainties, the bank maintains a prudent approach to credit management, ensuring a balanced and sustainable growth trajectory.
JPM Stock Technical Take
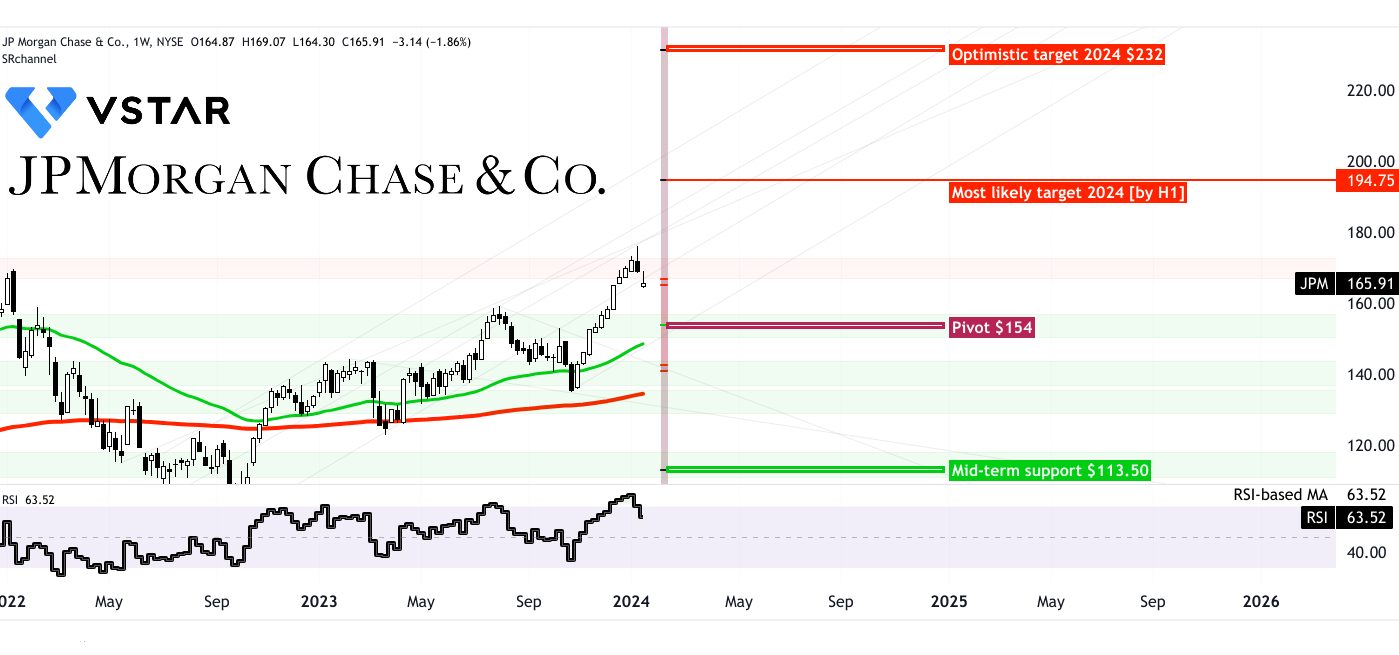
Source: tradingview.com
The JPM stock price may hit $195 by the end of 2024 H1 as a most likely scenario based on Fibonacci retracement and current momentum (projected forward). The current momentum is bullish, as can be observed in the alignment of 50-week and 200-week exponential moving averages (EMAs).
The JP Morgan stock has already taken support at the 200-week EMA in early 2023 and is taking dynamic support at the 50-week EMA. However, the stock is currently interacting with resistance. Therefore, a correction can be expected, where the stock price may test the pivot level near $154.
In detail, this projection is based on the RSI (relative strength index), which is currently at 64 and may go back towards level 50 before jumping back towards an overbought signal above 70. At the same time, there are also chances of more upside that may lead to the emergence of a bearish divergence.
On the upside, with an optimistic perspective, the price can hit $232 by the end of 2024, but only if the price can deliver a proper close above $195 by H1 2024. Again, a correction can be expected if the close price experiences severe resistance near $195.
On the downside, the Fed's rapid rate cuts or a recessionary economic environment may bring a large correction in the price back to the pivot. In cases of heightened volatility, the price may drop to $113.50, which serves as a mid-term support. But this is less likely.
Specific Risks and Downsides
JPMorgan's Net Interest Income (NII) outlook plays a pivotal role in understanding the fundamental weakness that may hinder the company's rapid growth potential. The outlook is indicating a decline in the face of anticipated interest rate cuts. This aspect is crucial as NII represents a substantial portion of a bank's revenue and is directly impacted by the prevailing interest rate environment.
Interest rates have a significant influence on a bank's profitability, especially in terms of the spread between the interest earned on assets and the interest paid on liabilities. In the case of JPMorgan, the outlook for NII indicates a cautious stance, with an estimated NII for 2024 ex-Markets at approximately $88 billion. This projection is notably lower than the reported quarterly NII ex-Markets run rate of $94 billion. The assumption behind this outlook includes expectations of interest rates following the forward curve, which incorporates six cuts throughout the year.
The sensitivity of NII to interest rate changes is a critical factor to consider. JPMorgan, being asset-sensitive, faces challenges in maintaining optimal margins when interest rates decrease. The more dovish Fed environment might alleviate some repricing pressure. However, the expectation of modest growth in deposits and the decline in NII due to lower rates are significant concerns.
While JPMorgan's financial strength and segment performances remain commendable, the outlook for 2024 introduces caution, particularly in Net Interest Income (NII). The potential impact of anticipated interest rate cuts on NII serves as a critical consideration, raising questions about the bank's ability to maintain optimal margins in a changing economic environment.


