Powerful Technical Indicators to Enhance Your CFD Trading Strategy
If you are looking for a trading system, there are a handful of indicators that traders tend to look toward. However, it's a process and not When looking to build a trading system, the amount of choices can be overwhelming. Learn more from VSTAR.
something that is simply “plug and play.” There are a lot of combinations available, with each trader needing to figure out what is best for them. In this article, we will look at some of the most common indicators that you can start looking at for guidance.
Introduction

The term "CFD" stands for "Contract for Difference". Without holding the underlying asset, CFD trading allows you to speculatively predict the price movement of a financial instrument, such as stocks, commodities, indexes, or currencies. Instead, you make a contract with a broker to trade the difference in the asset's price between the contract's opening and closing dates.
You choose the asset to trade and the quantity of money to invest when you begin a CFD trade. The next step is to decide if you believe the asset's price will increase or decrease. You initiate a "buy" position when you anticipate a price increase. If you anticipate a price decrease, open a “sell” position.
The ability to trade on margin, which allows you to control a greater position with a smaller initial investment, and the flexibility to go short (sell) and long (buy) on an asset are only two benefits of CFD trading. It comes with a lot of risks, though, like the chance of losing more than your initial investment if the market turns against you.
CFD trading can be a useful tool for seasoned traders trying to profit from short-term market moves, but it's crucial to be aware of the risks involved and to have a thorough grasp of the markets you are trading in.
Importance of technical analysis in CFD trading
In CFD trading, technical analysis is crucial since it enables traders to examine past price and volume data to spot trends and patterns that might guide their trading decisions. Technical analysis can assist traders by analyzing charts and indicators to help them choose entry and exit locations, create stop-loss orders, and control risk. Technical analysis can also shed light on market sentiment, which can be very helpful in choppy markets.
Technical indicators as tools for analysis
Technical indicators are mathematical calculations based on the historical price and volume data of an asset, which are used by traders to identify patterns and trends in the market. Technical indicators can provide insights into market sentiment, momentum, and volatility, which can help traders to make informed trading decisions.
There are many types of technical indicators, such as moving averages, oscillators, and trend lines, each with strengths and weaknesses. Moving averages, for example, are commonly used to identify trends and provide support and resistance levels, while oscillators can help to identify overbought or oversold conditions in the market.
Moving Averages (MA)
The Moving Average is considered to be one of the most basic indicators that technical traders use, and they are flexible in their usage.
Explanation of moving averages and how they work
The Moving Average (MA) is a technical indicator most frequently employed in CFD trading. The price of an asset is averaged over a predetermined amount of time to determine MAs. MAs are "moving," as their name implies, which refers to the fact that they are frequently updated with the most recent data points.
The indicator plots a series of dots on a chart to show the average price of the last “N” periods. When these dots are plotted, they appear as a line on a chart, which changes over time as the newest candles replace the oldest ones in the data series.
Different types of moving averages (SMA, EMA, and WMA)
Simple Moving Averages (SMA), Exponential Moving Averages (EMA), and Weighted Moving Averages (WMA) are just a few examples of moving averages. The weight assigned to the most recent data points is the primary distinction between various kinds of MAs. While EMAs and WMAs give more weight to recent data points, SMAs give equal weight to all data points.
Use of moving averages to identify trends, support, and resistance levels, and crossover strategies
Finding market trends is one of the main purposes of MAs. MAs can be used by traders to detect whether an asset is moving upward or downward, as well as to pinpoint important levels of support and resistance. For instance, an asset's price is typically deemed to be in an uptrend if it is consistently above its 200-day SMA and in a downtrend if it is below its 200-day SMA.
MAs can be utilized in crossover tactics in addition to trend analysis. A shorter-term MA, like a 20-day SMA, crosses above or below a longer-term MA, such as a 50-day SMA, which is known as a crossover. These crossovers can be used by traders to spot potential buy or sell signals.
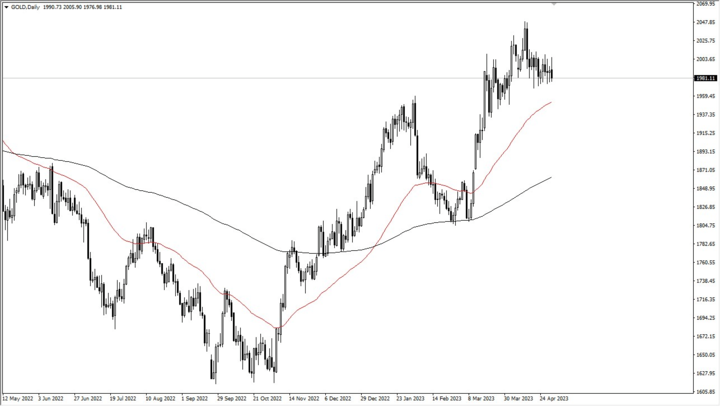
Examples of using moving averages in CFD trading
Let's look at an illustration of MAs being used in CFD trading. Consider that you want to locate important support levels in case the rising trend in the market you are trading reverses. If the price breaches the support, you might utilize the 50-day SMA as a crucial support level and place a stop-loss order immediately below it to reduce your losses.
Alternatively, look for probable purchasing opportunities using a crossover technique. Take the crossing of a 20-day SMA above a 50-day SMA as a buy signal and open a long trade. There is a seemingly endless combination of moving averages that traders will use, but there are some more common ones in the markets.
Some of the more common moving average combinations include:
· 50 and 200
· 100 and 200
· 9 and 20
· 20 and 50
· 10 and 20
Relative Strength Index (RSI)
RSI is used by many technicians to determine where a market may change directions in the hope that the trader can enter the new trend as early as possible.
Explanation of RSI as a momentum oscillator
A well-liked momentum oscillator that CFD traders use to gauge the rapidity and consistency of price changes in an asset is the Relative Strength Index (RSI). The average gain and loss of an asset over a given time period are used to compute the RSI, an oscillator with a range of 0 to 100.
Market overbought and oversold conditions can be determined using RSI values. The asset may be overvalued and need correction if the RSI exceeds 70, regarded as an overbought zone. However, the asset may be undervalued and due for a recovery if the RSI is below 30, which is regarded as oversold.
Calculation of RSI values and what they indicate
The average gains and losses of an asset over a given time period, usually 14 days, are compared to determine the RSI values. The RSI formula uses the following steps: The average gain and loss for the given period are first computed. Second, the average gain is divided by the average loss to determine the relative strength (RS). The RSI formula is RSI = 100 - (100 / (1 + RS)).
Use of RSI to identify overbought and oversold conditions
The RSI can be used by traders in various ways to guide their trading decisions. For instance, traders may decide to sell or short an asset when the RSI is in an overbought area, hoping for a price drop. On the other hand, when the RSI is in an oversold area, traders can decide to purchase an asset in anticipation of a price increase.
However, it is rare for traders to use just the RSI indicator to make a trading decision, but rather as part of a larger trading process. The RSI is a widely followed indicator but also will need to be confirmed by other means.
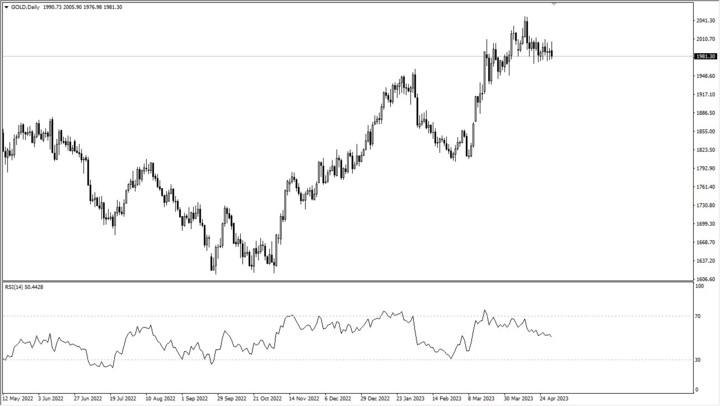
Examples of using RSI in CFD trading
Let's look at an illustration of RSI usage in CFD trading. Consider trading a currency pair when you see the RSI has been in an overbought zone for several days. This can suggest that the currency pair needs a correction since it is overpriced. As a result, you can choose to start trading the currency pair short in anticipation of a price decline.
Alternatively, you can also consider going long or buying a currency pair when the RSI has been in an oversold condition. This is often used with price action, trendlines, candlestick patterns, and other technical features.
Moving Average Convergence Divergence (MACD)
The MACD is an oscillator that many traders will not only look for momentum but also where something “under the surface” suggests that the market may be ready to reverse.
Explanation of MACD as a trend-following momentum indicator
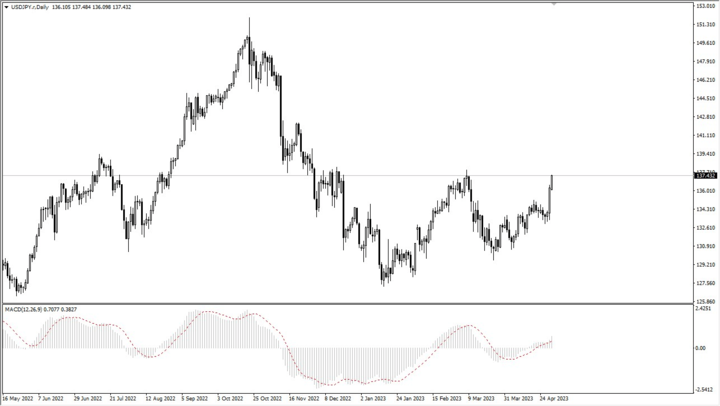
A common momentum indicator that CFD traders use to determine trend direction, potential trend reversals, and bullish or bearish signals in an asset is the Moving Average Convergence Divergence (MACD). Two moving averages are used to generate the MACD, and the result is a signal line plotted on a separate chart, normally at the bottom of the price chart.
The indicator is quite popular, and over the years, an almost unlimited number of trading systems have been designed around it. The traders will either look for the moving averages to cross the zero line for a signal or see the moving averages cross each other as a signal. (Much like a moving average crossover system.) There is also the idea of looking for a lack of momentum in one direction in the MACD while the price continues, something called divergence.
Calculation of MACD and signal lines
The MACD line, the signal line, and the histogram are the three elements used to calculate the MACD. The 26-day exponential moving average (EMA) is subtracted from the 12-day EMA to create the MACD line. The MACD line is smoothed using a 9-day EMA to create the signal line. The signal line is subtracted from the MACD line to produce the histogram. It’s also worth noting that some traders will “tweak” the settings for their systems.
Use of MACD to identify bullish and bearish signals, trend direction, and divergence strategies
The MACD can be used by traders in various ways to guide their trading decisions. For instance, it may be viewed as a bullish signal, indicating that the asset will likely trend upward when the MACD line crosses above the signal line. In contrast, a bearish signal may be considered when the MACD line crosses below the signal line, indicating that the asset is likely to trend lower.
The MACD can also be used by traders to determine trend direction. The asset is believed to be in an uptrend when the MACD line is above the signal line and in a downtrend when the MACD line is below the signal line.
To spot future trend reversals, traders can also employ MACD divergence tactics. Divergence is when an asset's price and MACD line move in different directions, signaling that the trend is waning.
Examples of using MACD in CFD trading
Let's look at an illustration of the MACD used in CFD trading. If you were trading a market, you might observe that the MACD line has just crossed over the signal line. This bullish indication suggests that the stock will probably go upward. As a result, you can choose to buy the asset in anticipation of a price increase.
Bollinger Bands
Bollinger bands are commonly used to determine volatility and the possibility of a market that may have gone too far in the short term in one direction.
Explanation of Bollinger Bands and how they work
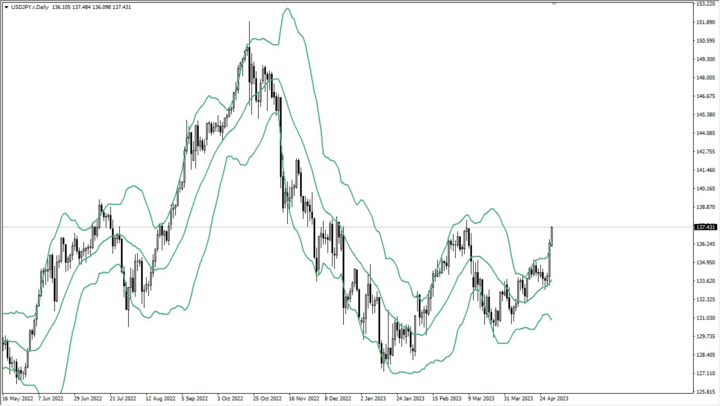
CFD traders frequently employ Bollinger Bands, a well-liked technical indicator, to assess volatility and spot potential overbought and oversold levels in an asset. Three lines make up Bollinger Bands: a simple moving average (SMA) in the middle and two bands that indicate the SMA's standard deviations above and below.
Use of Bollinger Bands to measure volatility and identify overbought and oversold conditions
Look at the upper and lower bands to see potential overbought and oversold scenarios. An asset's price is seen as being overbought when it touches or crosses the upper band and oversold when it touches or crosses the lower band.
The Bollinger Bands' breadth fluctuates in response to the market's level of volatility. The bands widen during periods of increased market volatility and compress during periods of decreased market volatility.
Potentials of Bollinger Bands as Signals for potential reversals
The Bollinger Bands can be used to spot future reversals as well. It may signal a probable reversal to the downside if the price of an asset rises above the upper band before falling back within the bands. On the other hand, it may be a sign of a potential upside reversal if the price of an asset drops below the lower band before rising again inside the bands.
Examples of using Bollinger Bands in CFD trading
Let's look at a CFD trading example using Bollinger Bands. Consider that you are trading a currency pair and that the price has been continuously approaching or crossing the upper band of the Bollinger Bands over the past few days. This is an overbought situation, suggesting a price correction may be overdue. As a result, you can choose to start trading the currency pair short in anticipation of a price decline.
Conclusion

Technical analysis is vital in enhancing your Contract for Difference (CFD) trading strategy. This article has explored various technical indicators such as Moving Averages (MA), Relative Strength Index (RSI), Moving Average Convergence Divergence (MACD), and Bollinger Bands, which offer unique insights into market trends, momentum, and volatility.
Moving Averages, with their different types (SMA, EMA, and WMA), provide essential information about market trends, support, and resistance levels. The RSI, a momentum oscillator, helps traders identify overbought and oversold market conditions, while the MACD, a trend-following momentum indicator, gives insights into bullish and bearish signals and potential trend reversals. Lastly, Bollinger Bands offer valuable indications of market volatility and possible overbought and oversold scenarios.
These indicators are not foolproof, and their effectiveness may vary based on market conditions and the asset being traded. While they can provide valuable insights, they should be used with other analysis tools and trading strategies to increase their effectiveness. Understanding and effectively applying these technical indicators can significantly improve a trader's ability to make informed trading decisions, manage risk, and potentially enhance profitability in the highly volatile world of CFD trading. Remember, however, that as with any trading strategy, there is a risk of loss, and it is essential to understand these risks before engaging in CFD trading.


The combination of indicators, or even the lack of them, can be a personal choice. The trader's job is to understand the indicators that work for them. It is also important to understand that traders use indicators not found in a vacuum. Traders often use fundamental and sentiment analysis to add to these indicators to formulate trading decisions.
Generally, it is wise to paper trade each indicator you are interested in and determine which ones work for you. This is also true with the various combinations you may choose to use in the markets. Also, it is important to note that some markets will perform better in various situations with various indicators. It's a process that takes a lot of work and statistical analysis to determine what is best for you.