
What is MACD? MACD stands for Moving Average Convergence Divergence and is a popular technical analysis tool used by traders and investors to identify potential buying and selling opportunities in the financial markets. It is a trend-following momentum indicator that helps analyze the relationship between two moving averages of an asset's price.
First introduced by Gerald Appel in the 1970s, the MACD has since gained widespread recognition for its effectiveness in predicting market trends. Traders rely on this indicator to identify potential trend reversals, confirm the strength of an existing trend, and generate trading signals.
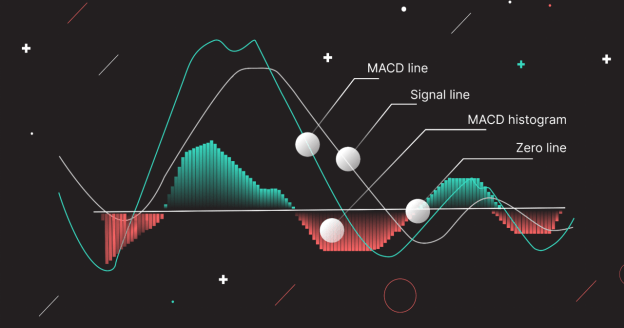
The MACD consists of three main components: the MACD line, the signal line and the histogram. The MACD line represents the difference between two exponential moving averages, while the signal line is a smoothed moving average of the MACD line. The histogram visually represents the distance between the MACD line and the signal line, which indicates the strength of the trend.

Understanding MACD
Understanding the components of the MACD is crucial as it provides insight into market trends, helps identify potential entry and exit points, and helps determine the overall strength of a trend. By incorporating MACD into your trading strategy, you can make more informed decisions and improve your trading results.
A. Definition of the MACD indicator
The MACD (Moving Average Convergence Divergence) indicator is a powerful technical analysis tool used to identify potential trading opportunities in the financial markets. By analyzing the relationship between two moving averages of an asset's price, the MACD helps traders gauge the momentum and direction of a trend.
B. Components of MACD
To fully grasp the concept of MACD (Moving Average Convergence Divergence), it's essential to understand its components and how they work together. MACD is a popular indicator used in technical analysis to identify potential trends and generate trading signals.
The MACD indicator consists of three key components:
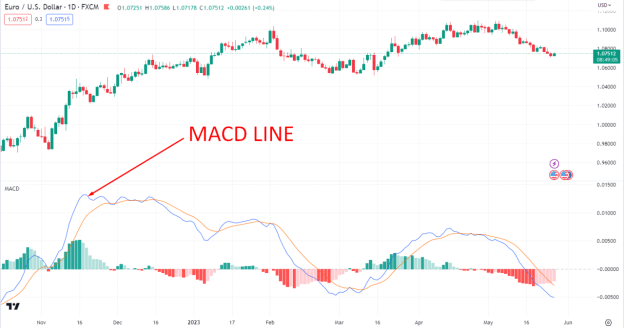
1. MACD Line: This line represents the difference between two exponential moving averages, typically a shorter-term moving average and a longer-term moving average. It reflects the recent price action and provides signals for potential trend reversals.
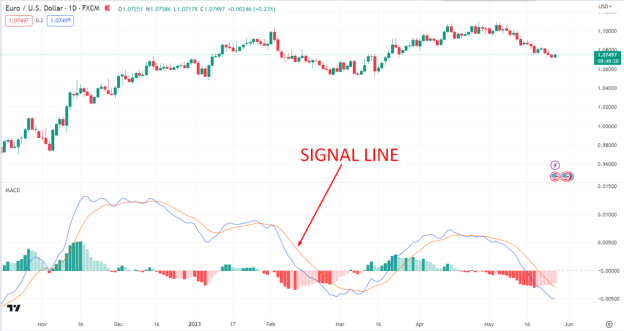
2. Signal Line: The signal line is a Smooth Moving Average of the MACD line. It helps to confirm the trend direction and generates trading signals when it crosses above or below the MACD line.
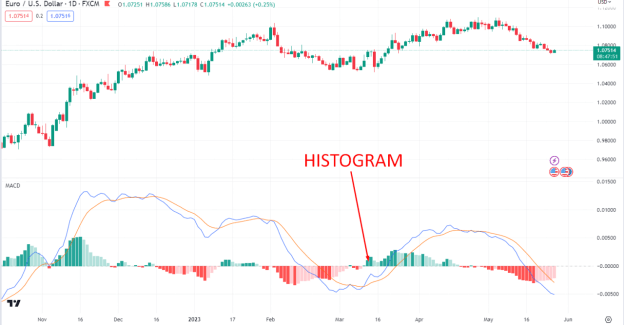
3. Histogram: The histogram represents the vertical bars on the MACD chart. It visually represents the distance between the MACD line and the signal line. Positive values indicate bullish momentum, while negative values indicate bearish momentum.
C. MACD Formula
Understanding the MACD formula will enable you to effectively interpret the indicator's signals and incorporate them into your trading strategy. The MACD (Moving Average Convergence Divergence) indicator is calculated using a specific formula that includes the following steps:
1. Calculate the MACD Line: Subtract the longer-term exponential moving average (EMA) from the shorter-term EMA. The commonly used time periods for the EMAs are 12 and 26 days for daily charts.
2. Calculate the Signal Line: Apply a smoothing factor (usually a 9-day EMA) to the MACD Line to generate the Signal Line.
3. Calculate the Histogram: Find the difference between the MACD Line and the Signal Line. This difference is represented by vertical bars called the histogram.
The MACD formula helps visualize the relationship between moving averages and highlights potential changes in momentum and trend direction. Traders often use the MACD histogram to identify bullish or bearish signals when it crosses above or below the zero line.
D. Interpreting the MACD with Examples
Knowing how to read MACD will allow you to use the indicator effectively in terms of identifying potential trend reversals, confirming trend strength and generating trading signals. Remember that MACD should be used in conjunction with other technical analysis tools to enhance your decision-making process.
Positive Divergence
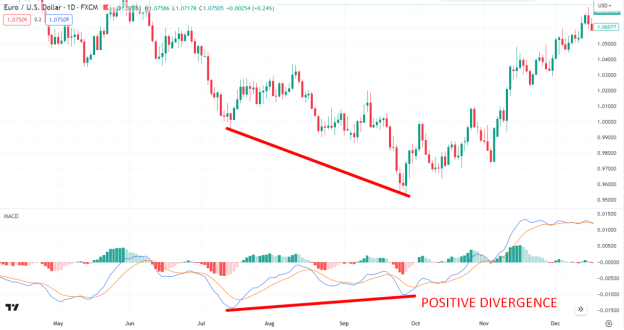
Positive divergence occurs when the price of an asset makes lower lows, but the MACD indicator makes higher lows. This indicates a possible trend reversal and a bullish signal. For example, if the price of a stock is falling and making lower lows, while the MACD indicator is making higher lows, this may indicate that selling pressure is weakening and a bullish reversal may be imminent.
Negative Divergence
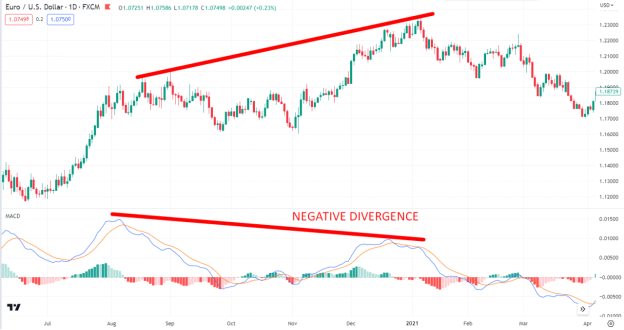
Negative divergence is the opposite of positive divergence. It occurs when the price of an asset is making higher highs, but the MACD indicator is making lower highs. This indicates potential weakness in the current uptrend and a possible reversal to the downside.
For example, if the price of a stock is rising and making higher highs, but the MACD indicator is making lower highs, this may indicate that buying momentum is waning and a price correction or reversal is likely.
Moving Average Crossover
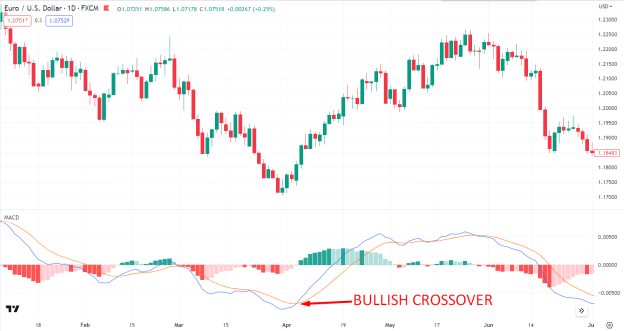
A moving average crossover is a widely used signal generated by the MACD indicator. When the MACD line crosses above the signal line, it generates a bullish signal, indicating a potential buying opportunity.
Conversely, when the MACD line crosses below the signal line, it generates a bearish signal, indicating a potential selling opportunity. Traders often use these crossovers to confirm trend changes and enter or exit trades accordingly.
Zero Line Crossover
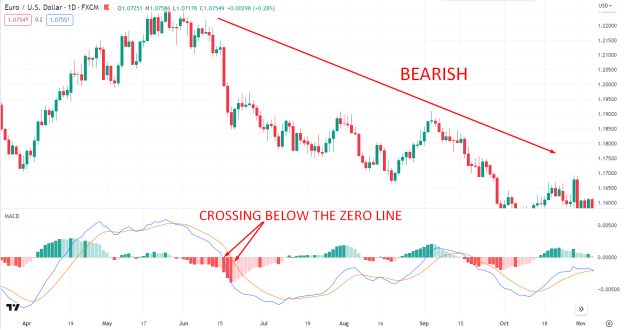
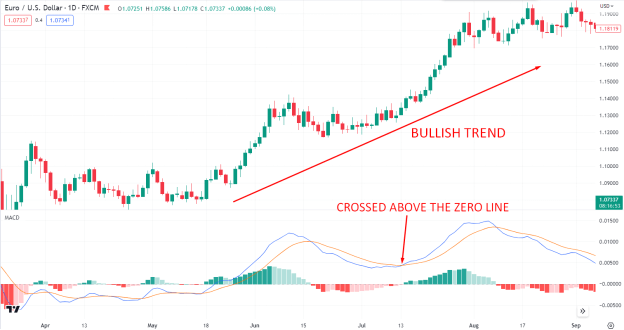
A zero line crossover occurs when the MACD line crosses above or below the zero line. When the MACD line crosses above the zero line, it indicates a shift from a bearish to a bullish trend, signaling potential buying opportunities.
On the other hand, when the MACD line crosses below the zero line, it indicates a shift from a bullish to a bearish trend, suggesting potential selling opportunities.
Histogram Convergence and Divergence
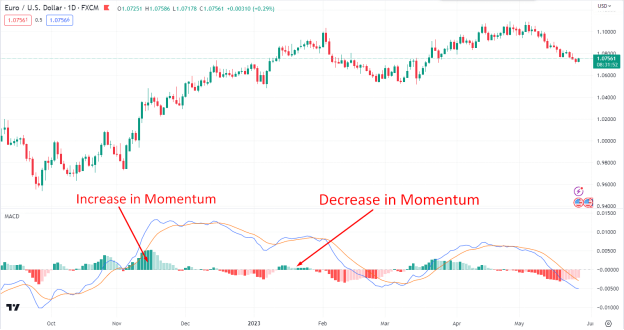
The histogram shows the distance between the MACD line and the signal line. When the histogram converges towards the zero line, it indicates a decrease in momentum. Conversely, when the histogram diverges away from the zero line, it indicates an increase in momentum.
Traders look for these convergences and divergences to assess the strength of a trend and potential trading opportunities.
How to Use MACD in Trading
As a trader, it is important for you to know how to utilize MACD as a trend-following indicator, a momentum indicator, and an overbought/oversold indicator to enhance your trading decisions. Remember to combine MACD analysis with other technical indicators and risk management strategies to create a well-rounded trading plan.
A. MACD as a trend-following indicator
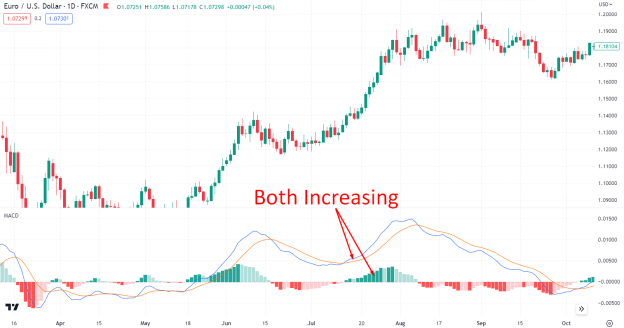
The MACD is a valuable tool for identifying market trends. By analyzing the relationship between the MACD line and the signal line, you can determine the direction of the trend. When the MACD line crosses above the signal line, and both lines are above the zero line, it suggests a bullish trend.
Conversely, when the MACD line crosses below the signal line, and both lines are below the zero line, it indicates a bearish trend. For example, if you observe the MACD line rising above the signal line while both lines are above the zero line, this can be a signal to enter a long position and take advantage of the upward trend.
B. MACD as a momentum indicator
MACD can also be used to measure the strength of market momentum. When the MACD line and histogram rise, it indicates strong upward momentum. Conversely, when the MACD line and histogram are decreasing, it indicates increasing downward momentum. By paying attention to the size of the histogram bars, you can estimate the intensity of the momentum.
For example, if you notice that the histogram bars are getting taller, it implies an increase in momentum, which presents potential trading opportunities.
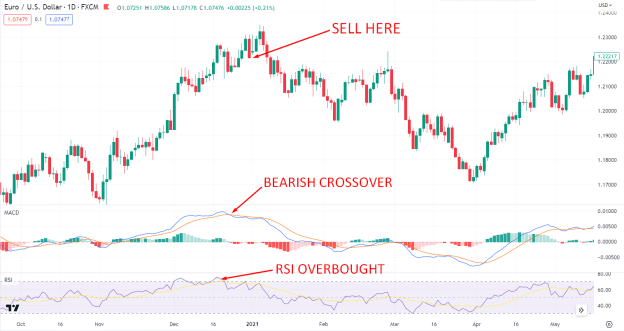
C. MACD as an overbought/oversold indicator
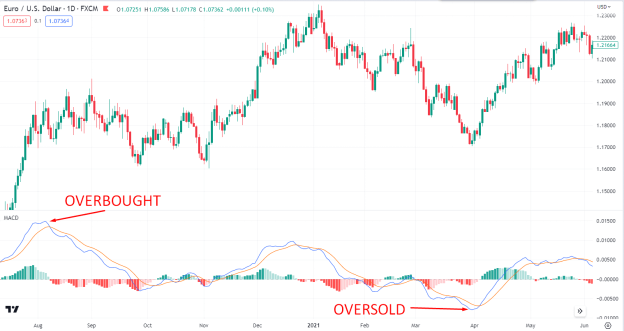
The MACD can help identify overbought and oversold conditions in the market. When the MACD reaches extreme levels, such as significantly above or below the zero line, it suggests the possibility of a reversal or correction.
For example, if the MACD reaches a very high positive value, it indicates that the market may be overbought and a downward correction may occur. Conversely, when the MACD reaches an extremely low negative value, it indicates that the market may be oversold, and an upward price correction may be expected.
D. Trading Strategies using MACD
MACD (Moving Average Convergence Divergence) offers various trading strategies that can help you make informed decisions in the market. Here are some popular strategies, along with examples:
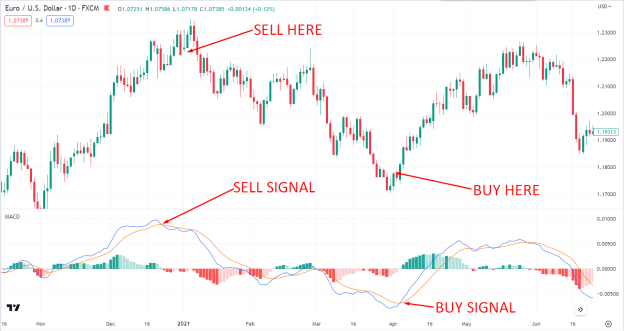
MACD Crossover Strategy
This strategy involves the crossover of the MACD line and the signal line. When the MACD line crosses above the signal line, it generates a buy signal, indicating a potential uptrend. Conversely, when the MACD line crosses below the signal line, it generates a sell signal, suggesting a potential downtrend.
For instance, if you observe the MACD line crossing above the signal line, this could be a signal to buy a stock or other financial instrument.
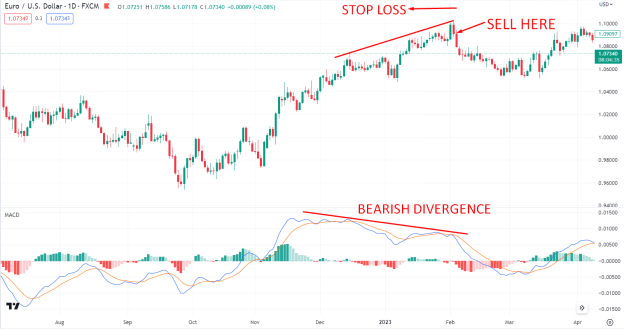
MACD Divergence Trading Strategy
Divergence occurs when the price of an asset moves in the opposite direction of the MACD indicator. Bullish divergence happens when the price forms lower lows while the MACD forms higher lows. This signals a potential upward reversal.
Conversely, a bearish divergence occurs when the price forms higher highs while the MACD forms lower highs, indicating a potential downward reversal. By identifying divergences, you can anticipate trend reversals and adjust your trading accordingly.
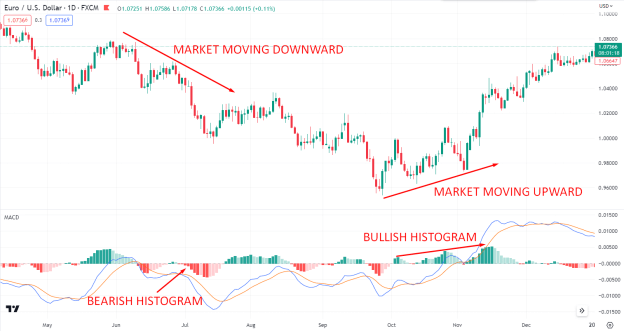
MACD Histogram Strategy
The MACD histogram measures the difference between the MACD and the signal lines. Positive histogram bars indicate bullish momentum, while negative bars indicate bearish momentum. Traders often look for histogram patterns, such as rising or falling bars, to gauge the strength of the trend.
For example, observing a series of rising histogram bars indicates increasing momentum and a potential trading opportunity.
MACD RSI Strategy
Combining the MACD with the Relative Strength Index (RSI) can provide valuable signals. When the MACD generates a buy signal (e.g. a crossover) and the RSI is below an oversold threshold (e.g. 30), it can indicate a strong buying opportunity.
Conversely, when the MACD generates a sell signal and the RSI is above an overbought threshold (e.g., 70), it suggests a potential selling opportunity. This strategy helps to confirm trade entries and exits based on both trend and momentum indicators.
Limitations of MACD
MACD helps traders identify potential trend reversals, entry and exit points, and overall market momentum. However, it's important to understand that while MACD is a valuable tool, it does have its limitations. Here are some of the limitations.
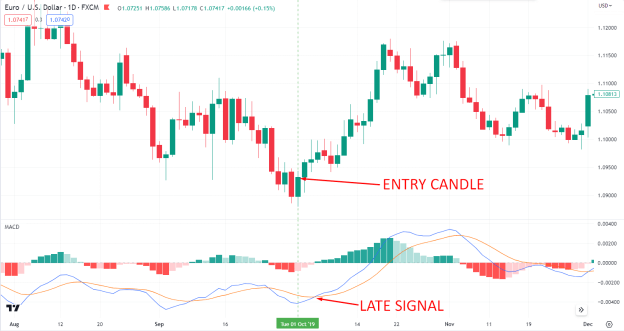
A. Delay in Signals
One limitation of MACD is the possibility of delayed signals. The indicator relies on moving averages, which are lagging indicators by nature. This means that MACD may not capture sudden price movements or changes in trend promptly.
For example, during a volatile market, MACD might give a signal after a significant price move has already occurred, resulting in missed opportunities or delayed reactions.
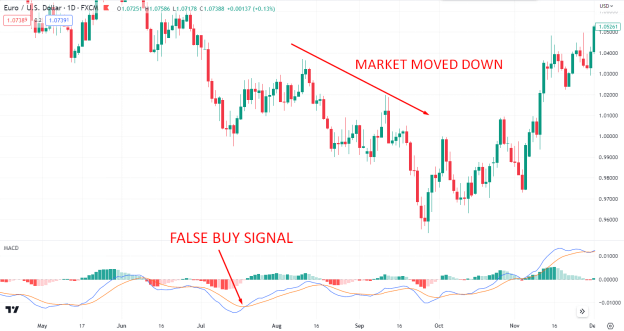
B. False Signals
Another limitation of MACD is the occurrence of false signals. False signals occur when the indicator signals a trend reversal or a trading opportunity, but the market does not follow through.
This can cause traders to enter or exit trades prematurely, resulting in losses. Traders must be cautious and use additional confirmation tools to filter out false signals and avoid unnecessary risk.
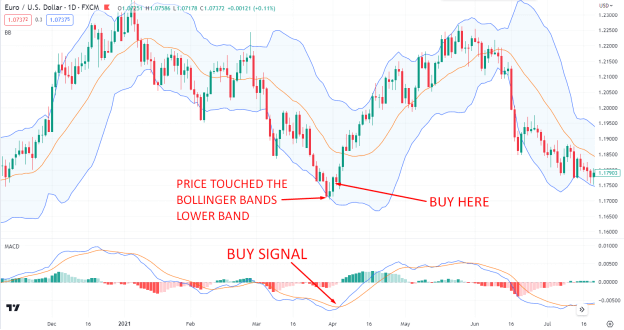
C. Limited use as a sole decision-making tool
Although the MACD is a powerful indicator, it should not be used as the sole basis for making trading decisions. It is important to consider other factors, such as fundamental analysis, market sentiment, and additional technical indicators, to validate MACD signals.
For example, using the MACD alongside other indicators like the Relative Strength Index (RSI) or Bollinger Bands can provide a more comprehensive view of the market and increase the accuracy of trading decisions.
D. Market Conditions with example
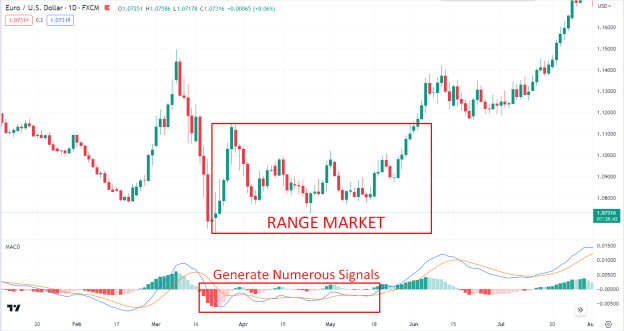
MACD's effectiveness can also be influenced by market conditions. Certain market environments, such as low volatility or choppy sideways movements, can lead to inconsistent or less reliable signals. For instance, during a range-bound market, the MACD may generate numerous signals, resulting in whipsaws or false indications of trend direction.
Conclusion
In conclusion, the MACD is a powerful technical analysis tool that helps traders identify trends, entry/exit points, and market momentum. Its popularity stems from its effectiveness in providing valuable insights into market dynamics.
As we wrap up, it's essential to remember that while the MACD is valuable, it has limitations. Traders should combine it with other indicators and consider market conditions for a comprehensive trading strategy.


To further enhance your understanding of MACD and its application, here are some recommended resources:
● "Mastering the MACD Indicator: A Step-by-Step Guide" (Link to a comprehensive tutorial)
● "MACD Strategies for Different Market Environments" (Examples of MACD strategies in varying market conditions)
● "Utilizing MACD Divergence for Enhanced Trading Decisions" (Insights into using MACD divergence for improved accuracy)
By exploring these resources, you can deepen your knowledge of MACD and refine your trading approach. Remember, continuous learning and adaptation is the key to success in the dynamic world of financial markets.