


EURUSD
Fundamental Perspective
The policymakers from the Federal Reserve left the interest rate benchmark floating between 5.25%- 5.50% in an announcement last Wednesday. Meanwhile, they also published their quarterly summary of SEP or dot plots, revealing macroeconomic projections.
The document posted a clear indication to connect the dots. As forecasts revealed, policymakers upgraded their real GDP view in 2024 to 2.1%. However, inflation revised gradually alongside the PCE index, and the unemployment rate declined in 2024 to 4.0%.
The FED signaled upcoming rate cuts multiple times despite increasing inflation, and it said the risks of the economy have decreased alongside the fear of recession. Although the primary impact was negative for USD, the greenback comes after the dust settled due to positive US data signals of a stable economy.
On the other hand, the ECB accelerated the possibility of a June rate cut. Multiple officials from the ECB confirm the June rate cut remains alive, although they signal it would depend on macroeconomic data. Christine Lagarde, ECB president, said upcoming growth projections and repeated policymakers' expectations about inflation easing in forthcoming months.
On a positive note, the Union has improved sentiment on the Euro. While the recovery of the current situation was not remarkable, Germany published the ZEW survey for March, which shows improved sentiment. The IFO business climate survey also beat expectations by surging to 87.8 from 85.7.
Technical Perspective
The EURUSD pair has declined for two consecutive weeks after reaching a peak near 1.098 level.
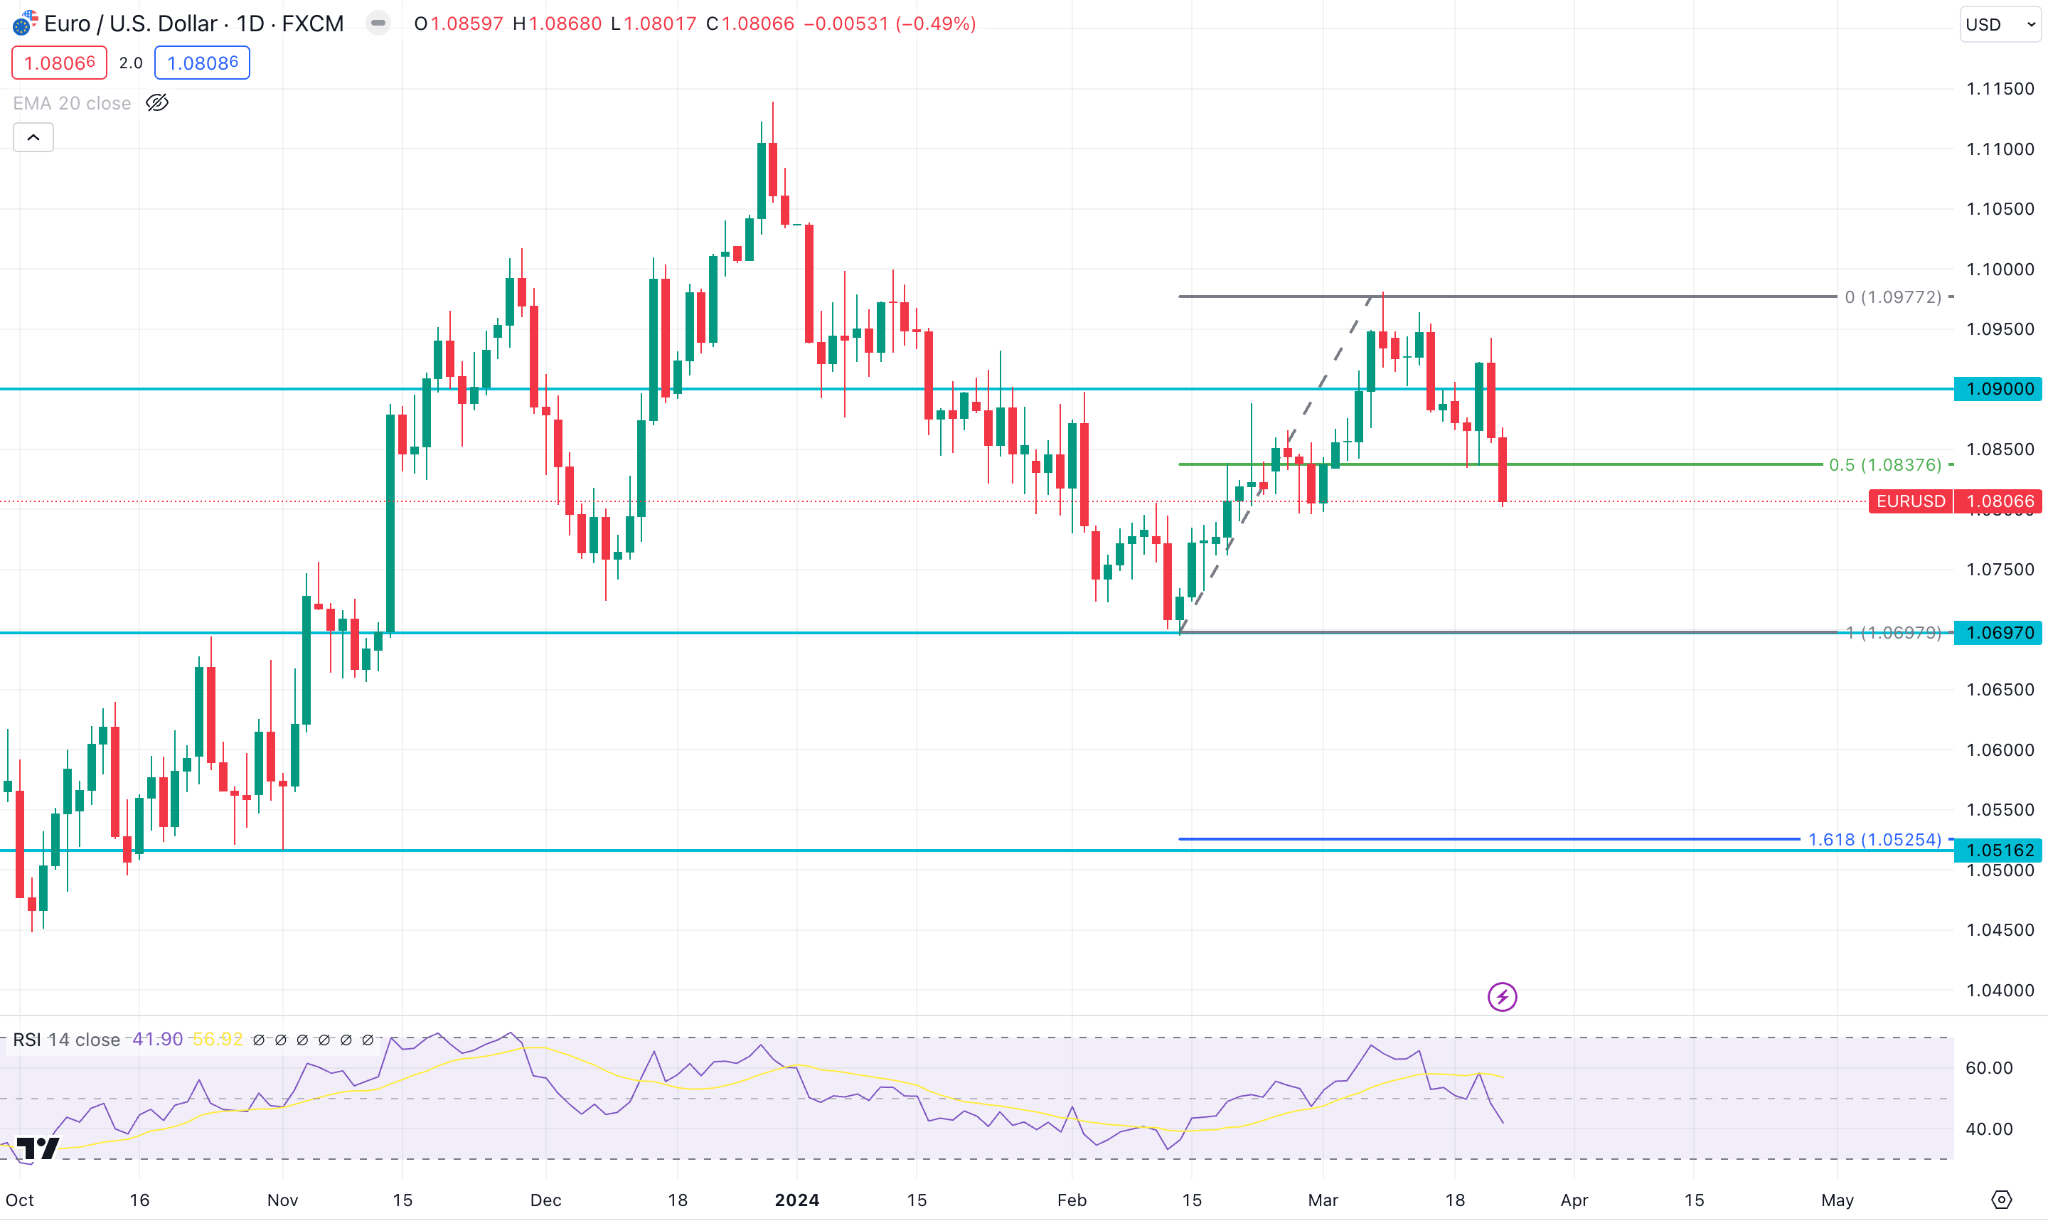
Setting the previous rally from 1.0450-1.1136, the price returned to the 1.618% level near the 1.0712 level. Later on, the price bounced back to near 1.098 (0.23%) and returned to the 50% Fibonacci territory near 1.08 by the end of the week.
Considering the ongoing downside pressure, the price can reach the support level near 1.0700 level before forming a bullish possibility.
On the other hand, an immediate bounce back from the 50% Fibonacci level is possible. Any breakout above the 1.0980 level with a daily close could create a long opportunity to the 1.1100 level.
GBPJPY
Fundamental Perspective
The BoE kept the bank rate at 5.25%, as broadly expected. The policy statement showed seven of the policymaker's votes for holding, while the other favored lowering the rate by 25 basis points.
On Friday, the BoE governor, Andrew Bailey, said they don't need to wait for inflation to decline below 2% before rate cuts. He is progressively confident that inflation is approaching the appropriate target and signaled that the market can anticipate multiple rate cuts this year.
On the other hand, the Core CPI of Japan, a preferred inflation measure that excludes fresh food, grew solid at 2.8%, as anticipated, compared to the previous reading of 2.2%. The price pressure that continues to exist at over 2% will empower the BoJ to maintain the interest rate in a positive era.
Moreover, Japan's government's progressive speculation in the Forex market will support the JPY against the basket of currencies. Shunichi Suzuki, the Finance Minister of Japan, said that he would monitor the exchange rate to ensure a steady movement.
Technical Perspective
The latest weekly candle closed bullish, backed by a two-bar continuation signal, which could work as a bullish opportunity for this week.
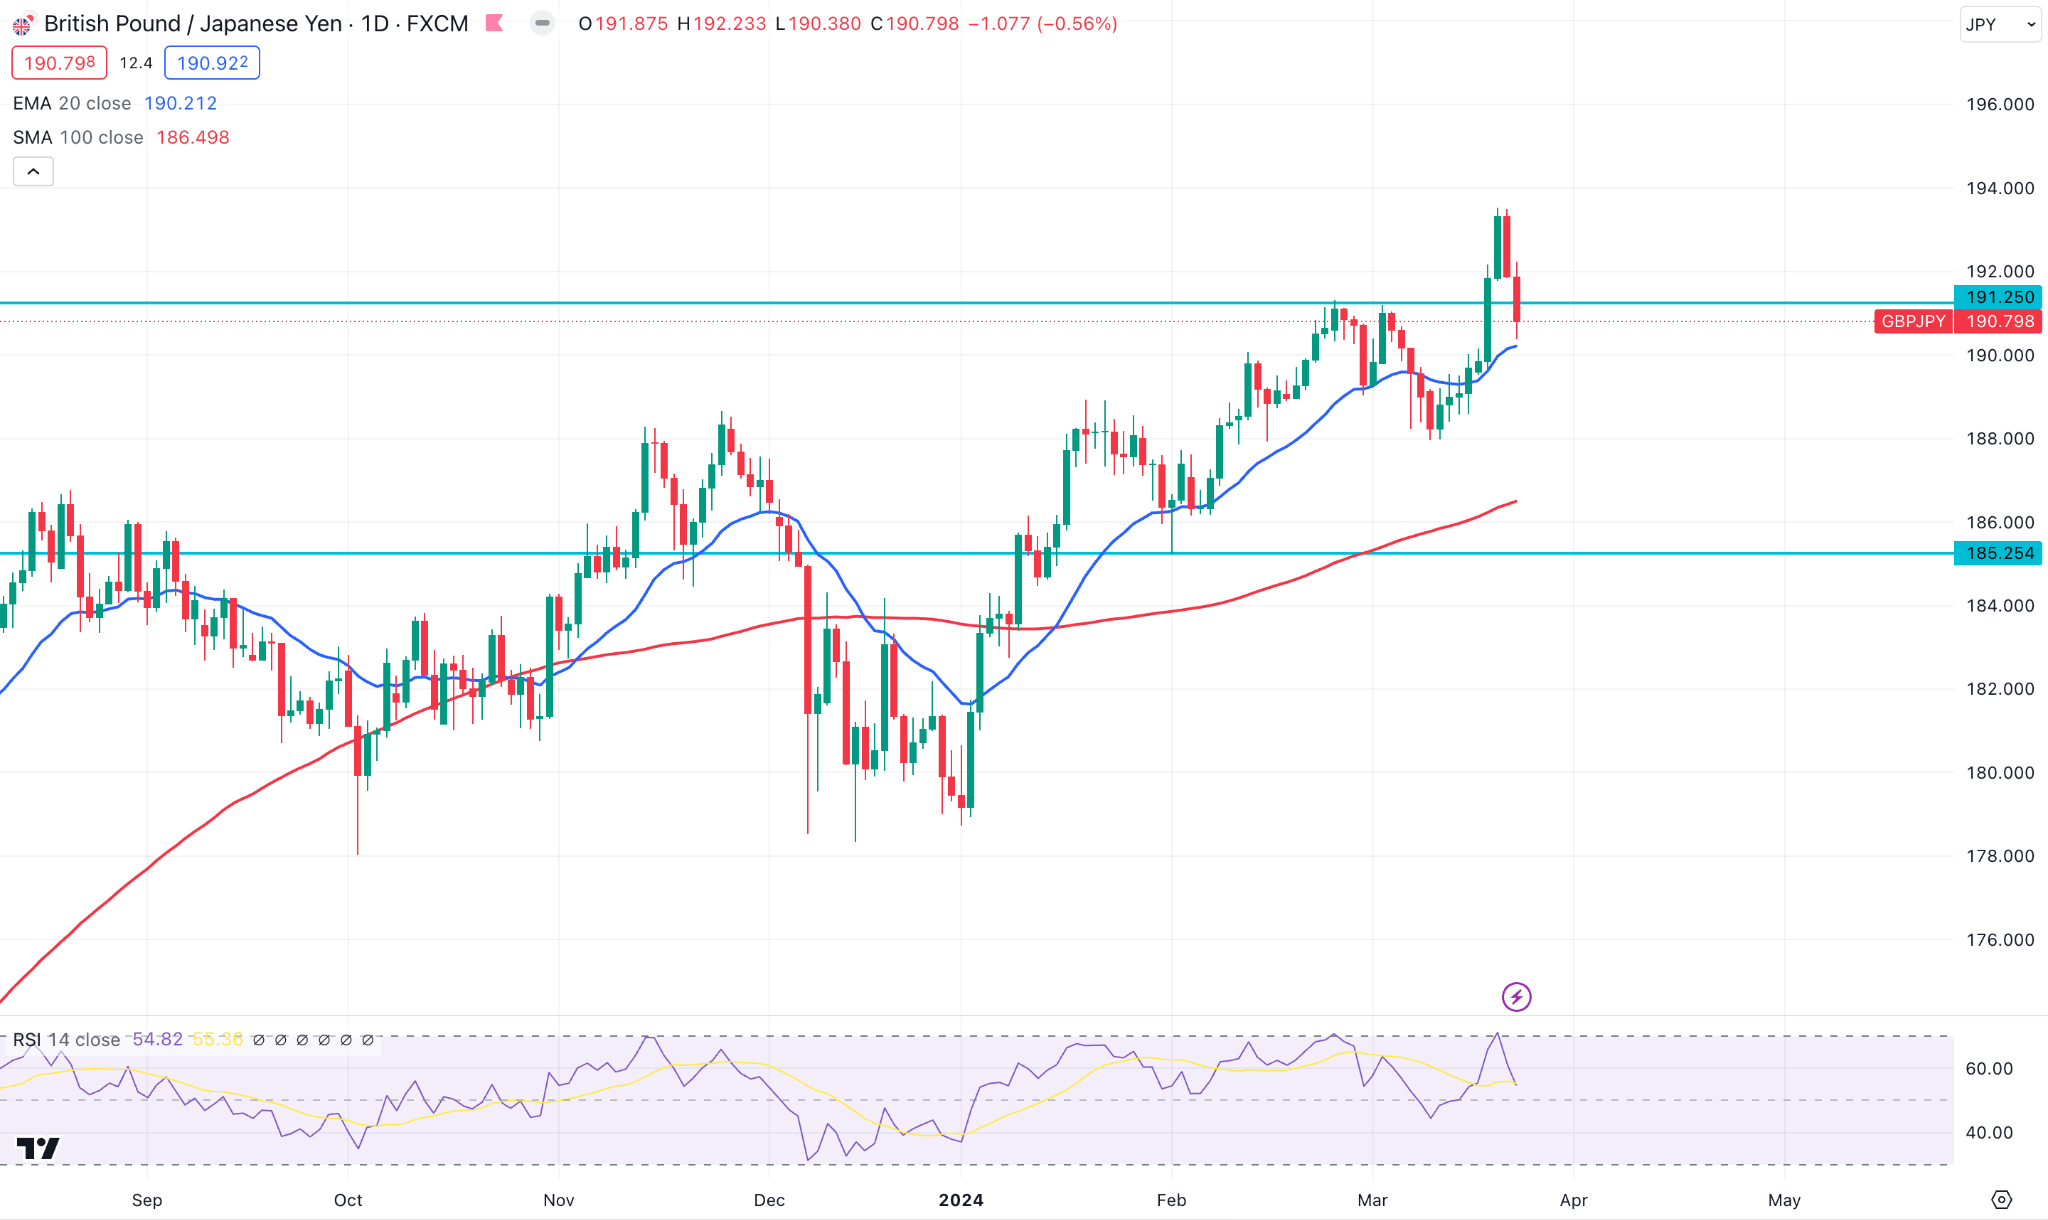
In the daily chart, the pair GBPJPY has remained above the 100 SMA line since the second week of 2024. Moreover, the RSI remains steady above the 50.00 line, with a possibility of an upward rebound.
Considering the ongoing bullish pressure, the price can reach the long-term resistance level near 195.00, which was high in 2015, if the price can surpass the recent peak.
On the other hand, if the bearish pressure continues, the price can reach the recent support level near the 188.00 level. However, breaking below this line would confirm the bearish trend targeting the 185.00 psychological level.
Nasdaq 100 (NAS100)
Fundamental Perspective
As expected, the US FED kept the fund rate unchanged, while the committee increased its PCE projection from December's 2.4%-2.5% to 2.5%-2.6% alongside enhanced interest rate projections for 2025 and upcoming years.
The updated dot plot reveals that the committee still looks forward to three rate cuts in the current year, particularly observing the recent inflation bounce. The bank is confident about eventually reaching the 2% inflation goal while the CPI sustains above the Fed's target. As a result, the stock market remained positive, supported by the recent buying pressure in tech industries.
Jerome Powell, Fed chair, delivered a hawkish tone, appreciating the economy's progress and highlighting the supply chain's resurrection and solid consumer demand. Meanwhile, the Fed chair hinted at rate cut possibilities later this year, underscoring the importance of assuring inflation-decreasing confidence before accomplishing such measures.
Technical Perspective
After two bearish candles, the Nasdaq 100 closed bullish above the previous week's high. However, the 18477.34 high is still protected, which needs to break before confirming the bullish pressure.
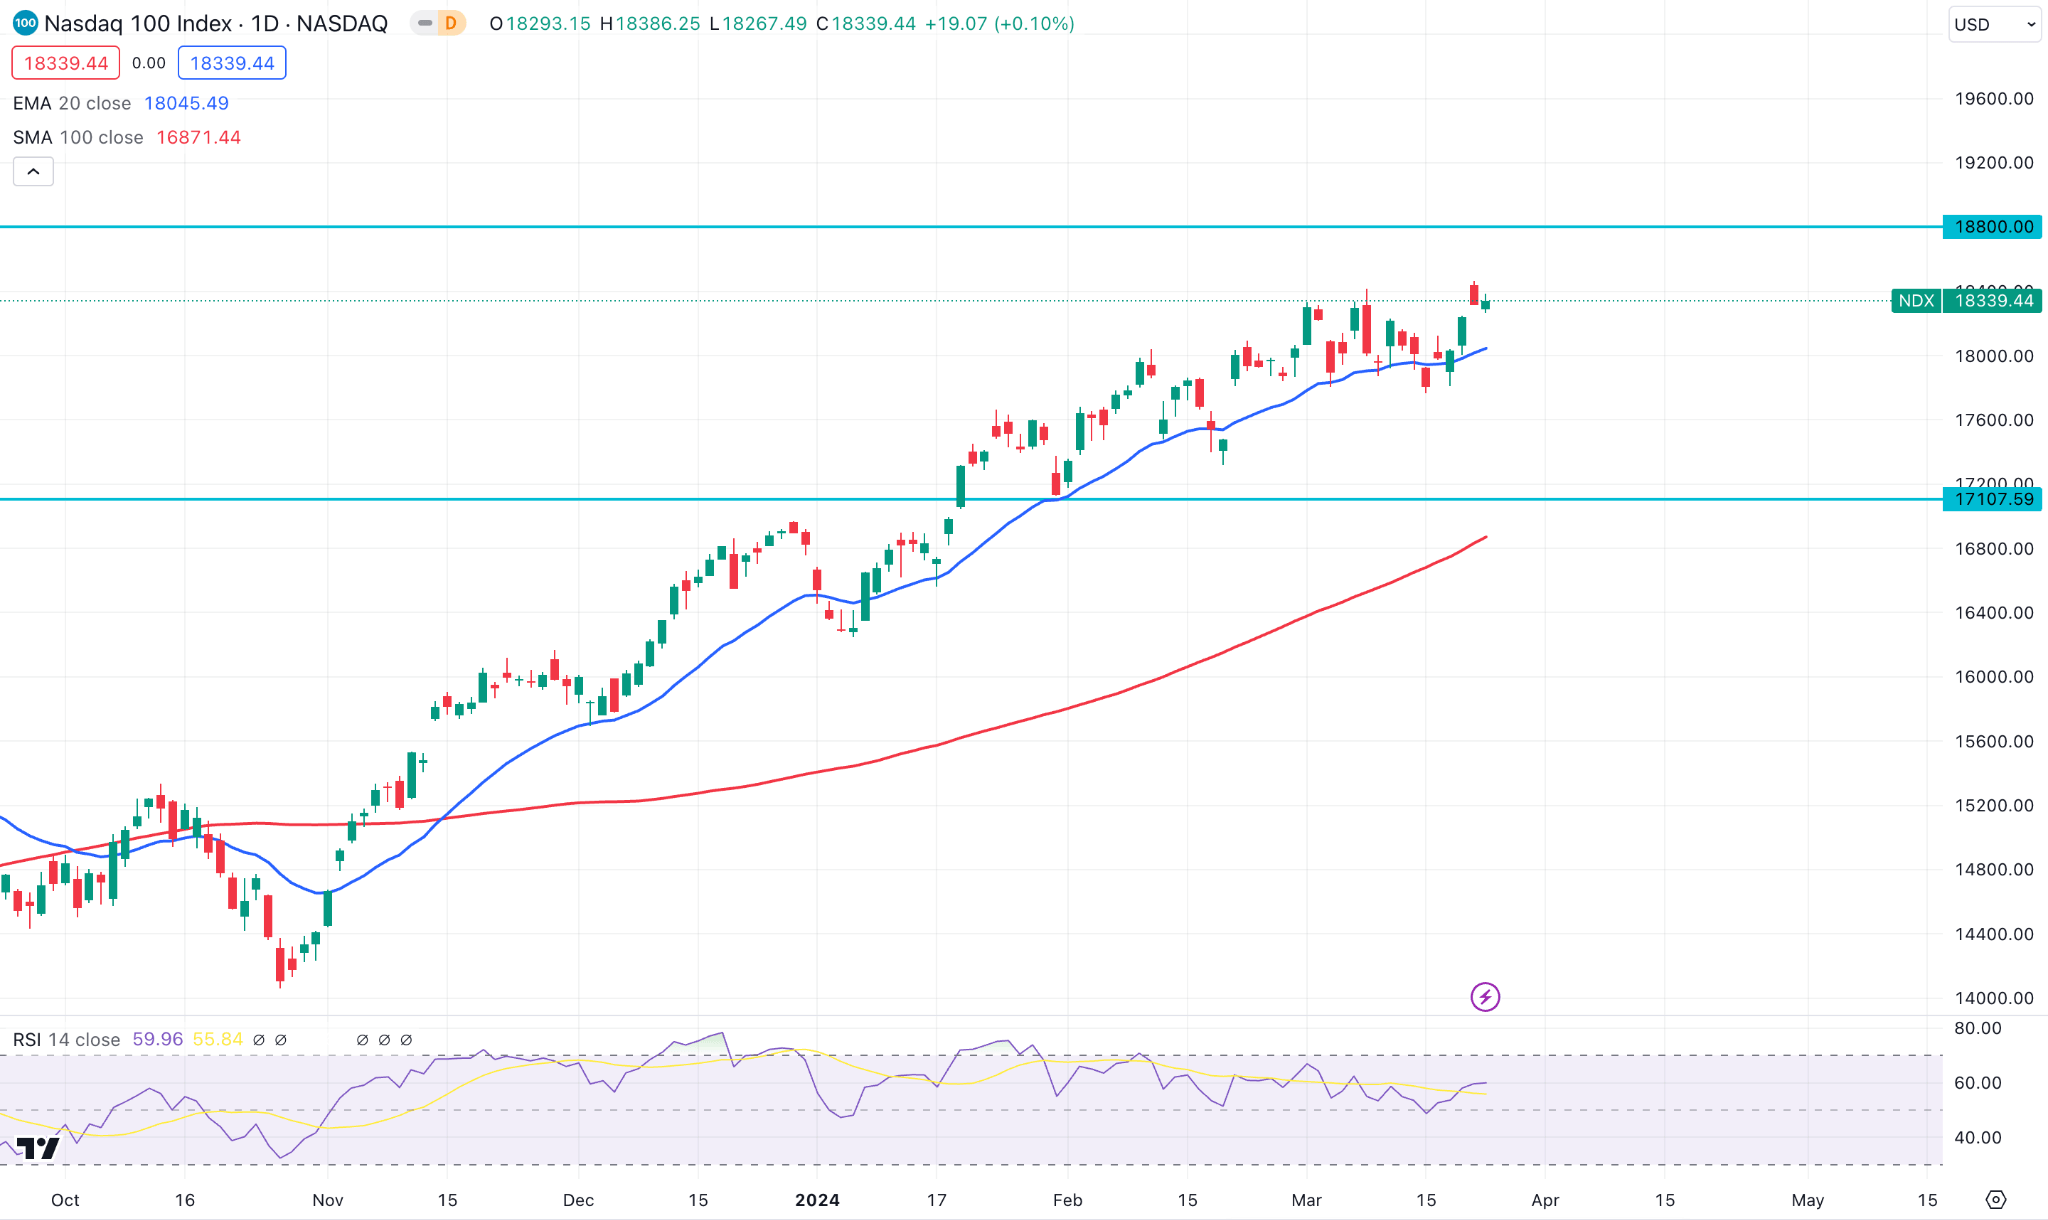
The daily chart confirmed the price remained above the 100 SMA line for several months, signaling the price can reach a new high of 19,000.00 or above, breaking the recent resistance of 18,500.00.
On the other hand, a selling pressure with a daily close below the 20-day SMA could initiate a minor downside correction towards the recent demand zone near the 18000.00 area.
S&P500 (SPX500)
Fundamental Perspective
This week could be the case of a decline in US inflation in the upcoming months alongside further labor market easing that could help the possible initiation of the Fed's easing cycle from the May 1 event.
According to the CME group's FedWatch tool, the governing perspective measures for the Fed indicate a 25 bps reduction in June, approximately at 62% and 15% in May.
Investors' observation switches to extra inflation data from PCE data on the next weekend. These readings will come alongside key fundamentals, such as Durable Goods Orders, revised Q4 GDP growth rate, Michigan Consumer Sentiment, and usual weekly Jobless Claims.
Technical Perspective
The latest weekly candle closed bullish after multiple Doji formations, which signals a range breakout towards the major trend.
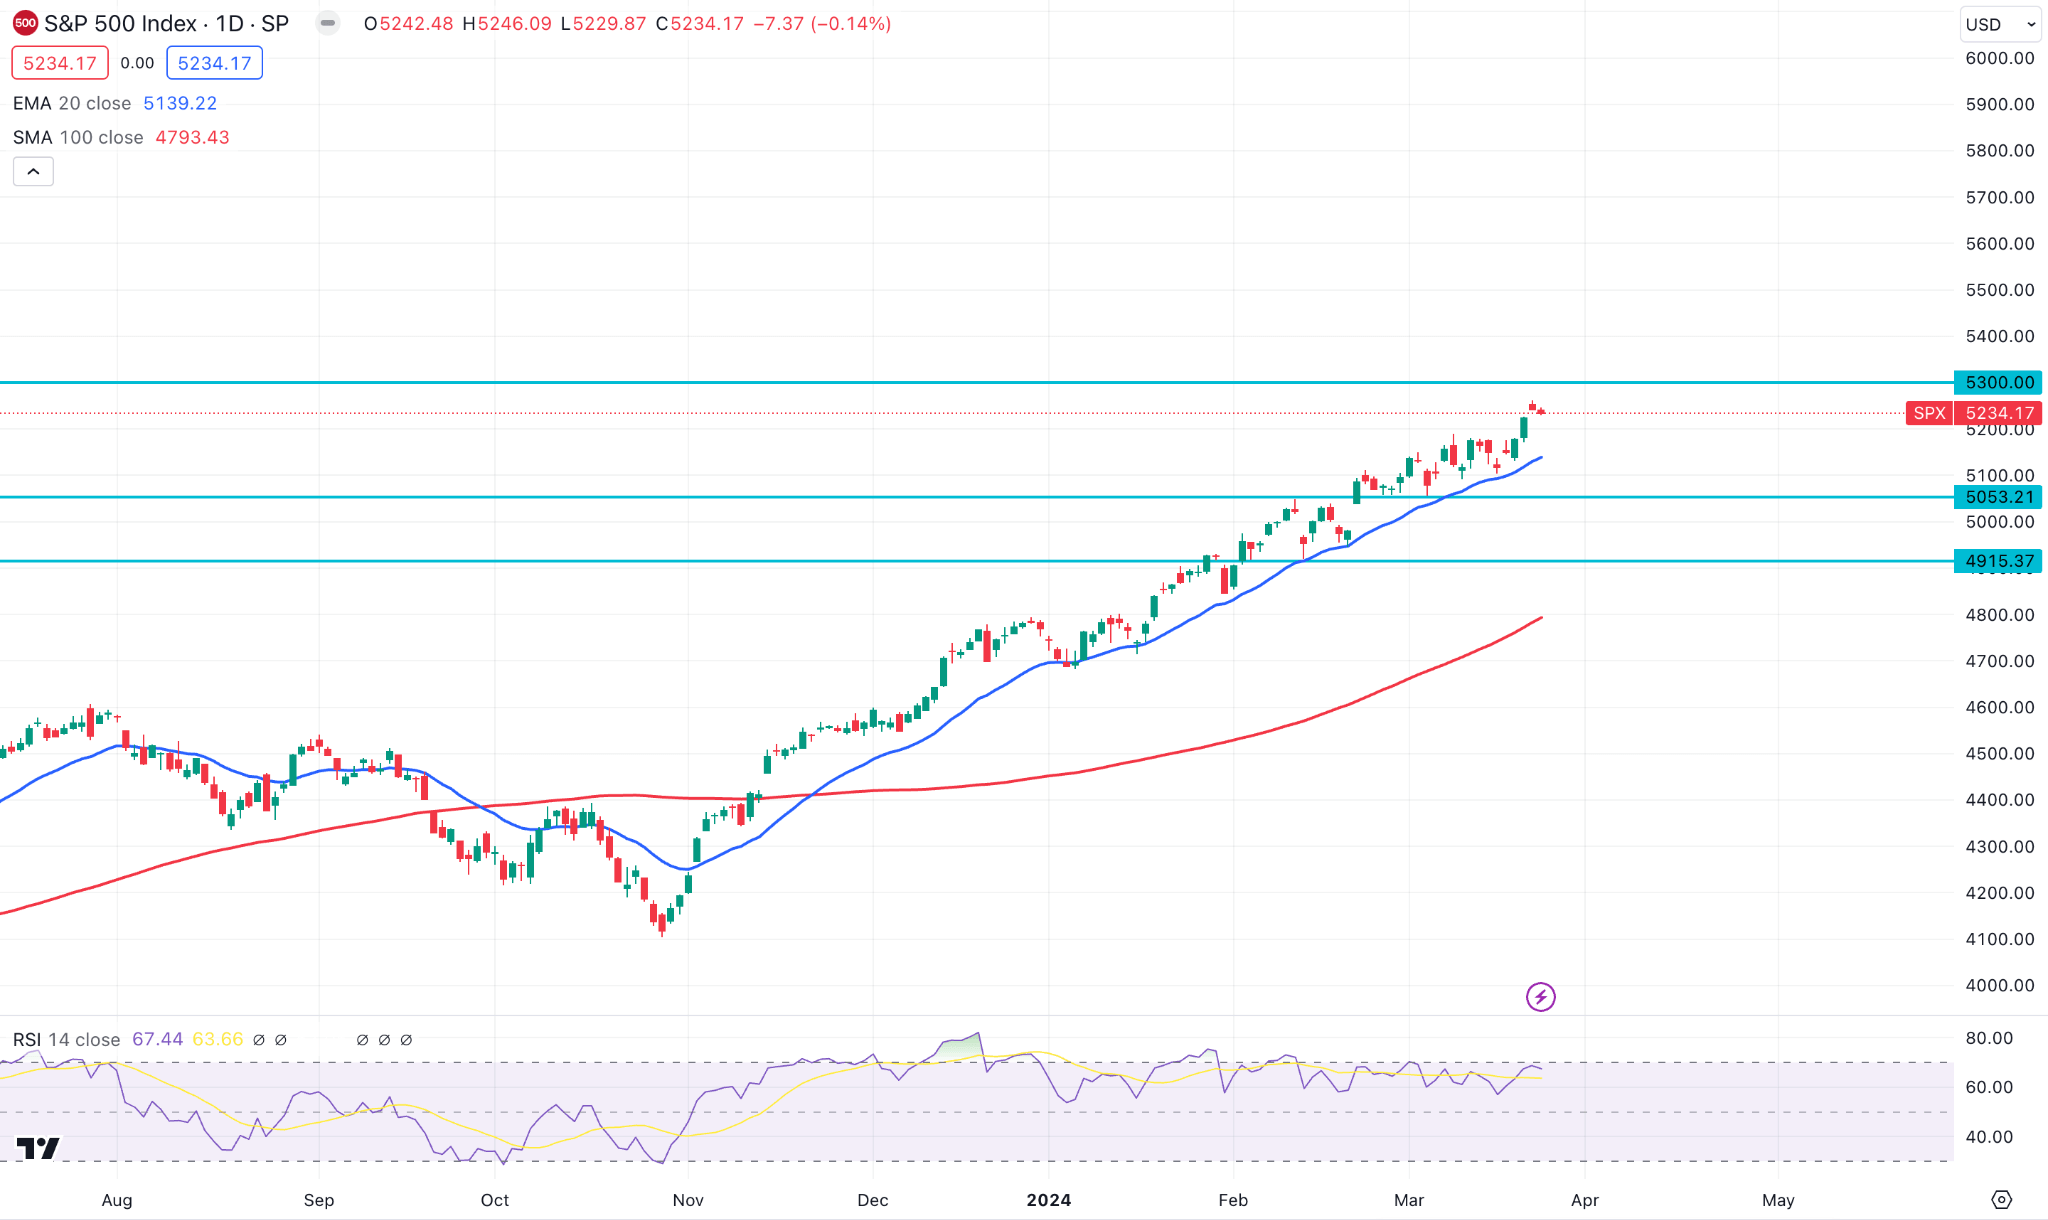
In the daily chart of the S&P 500, the next resistance of 5300 is crucial to look at, as any intraday buying pressure could take the price to that level. Moreover, the price can surpass that level if the bullish pressure remains intact.
On the other hand, the gap between the dynamic 100-day SMA has widened, while the current RSI is at the overbought 70.00 line. In that case, a downside correction is possible towards the 5100.00 level but a daily close below the 5053.32 level is needed before offering a short opportunity.
Bitcoin (BTCUSD)
Fundamental Perspective
The pioneer crypto BTC faces another issue alongside not-stop outflows from spot BTC ETFs and the strong US Dollar.
The DXY index, which tracks greenback performance against other top currencies, has increased 1.3% from its low of March 21 following solid positive U.S. economic data.
DXY initiated a recovery as PMI survey data showed ongoing economic activity in the private sector, solid price pressure, and declining jobless claims.
The fourth consecutive capital outflow day on March 21 from spot BTC ETFs is the longest since they started trading on Jan 11. According to BitMEX research, on March 21, BTC worth more than $538.8 was outflows from Grayscale's GBTC. Meanwhile, Fidelity's FBTC and BlackRock's IBIT saw inflows of about $2.9 million and $233, respectively, leading to a net outflow of about $93 million from spot BTC ETFs.
BTC faced selling pressure alongside ongoing outflows from BTC ETFs, and GBTC outflows are blamed. Many investors who had funds on GBTC are now redeeming their investments and switching toward comparatively low-cost options.
Technical Perspective
The latest weekly candle closed bearish after an indecision at the top. However, the last 2 weeks' price action remained within the previous candle's body- suggesting buyers' domination.
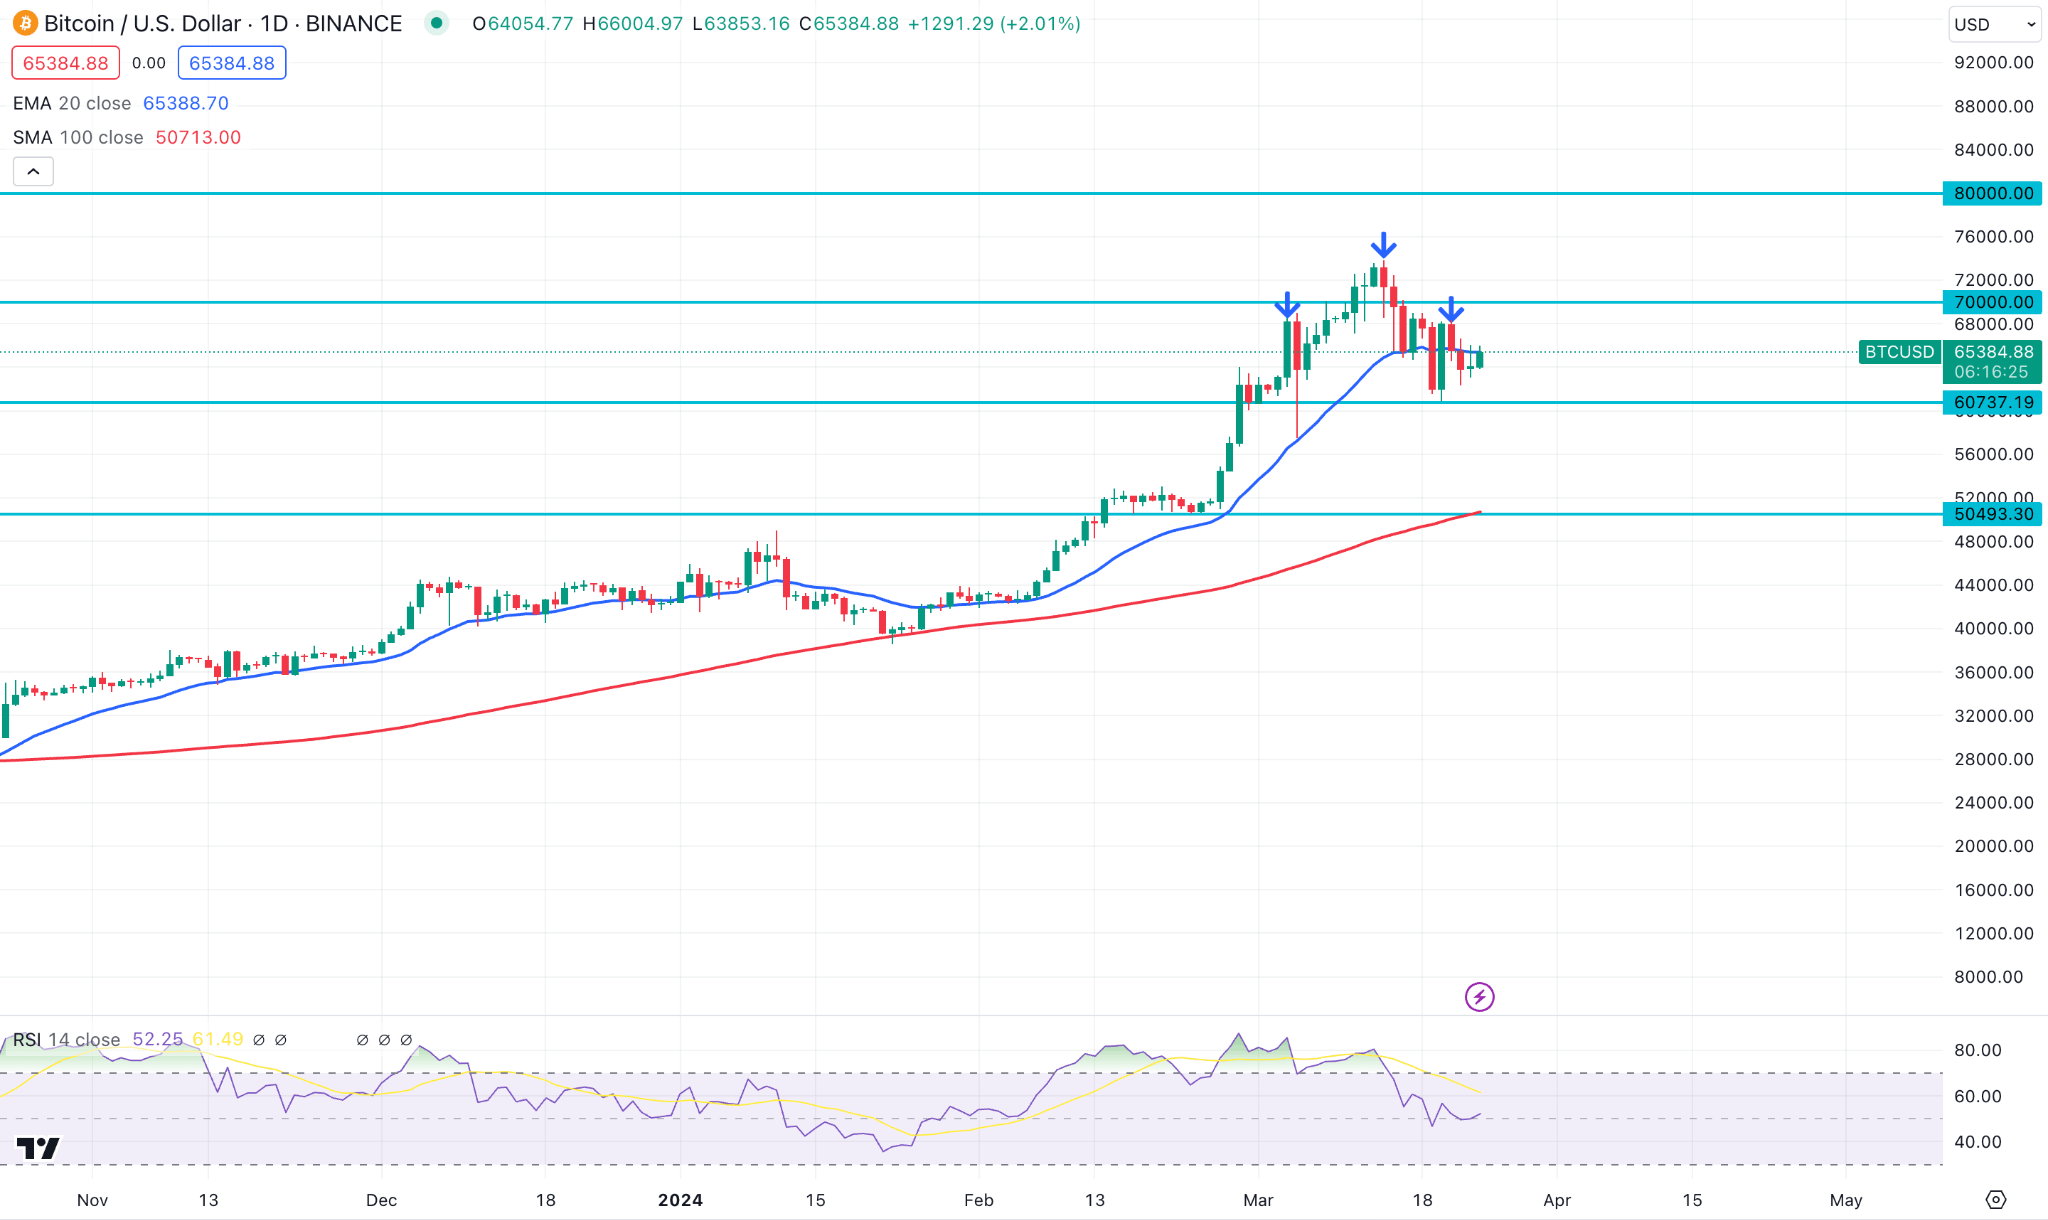
The daily chart confirms that the bullish pressure remains intact to surpass the ATH as the world crypto investors keep an eye on next month's BTC halving event. Although the recent price came below the 20-day EMA, the potential Head and Shoulders pattern has not yet been formed. In that case, a bullish continuation is highly anticipated, with a daily close at the 68000.00 level, which could be a potential long signal.
On the other hand, a strong selling pressure below the 60737.19 level might validate the H&S pattern, which could be the primary signal of a possible bearish trend.
Ethereum (ETHUSD)
Fundamental Perspective
The value of ETH has declined recently, partly due to the U.S. Securities and Exchange Commission (SEC) starting an investigation into classifying it as a security or not.
The investigation from the SEC process demands financial records concerning their dealings with the Ethereum Foundation, which is Switzerland-based, and supervision for the development and governance of the blockchain. Subpoena's familiar sources said the investigation started after Ethereum switched to a POS network in September 2022.
As reported, Paul Grewal, Chief Legal Officer of Coinbase, responded strongly by refusing the implication of questioning Etherum's status. He underlines ETH's significance in the crypto world since 2015 and millions of Americans holding the asset.
According to Grewal, the SEC contradicted itself, as William Hinman, Director of Corporation Finance, SEC official acknowledged ETH as a non-security asset. Moreover, he referenced Gary Gensler, SEC chair's Congressional testimony in July 2018 (before becoming chair), categorizing ETH as a commodity rather than a security.
Technical Perspective
The weekly chart shows a solid uptrend since October 2023, and the price bounces back after reaching ATH at nearly 4091.00 level.
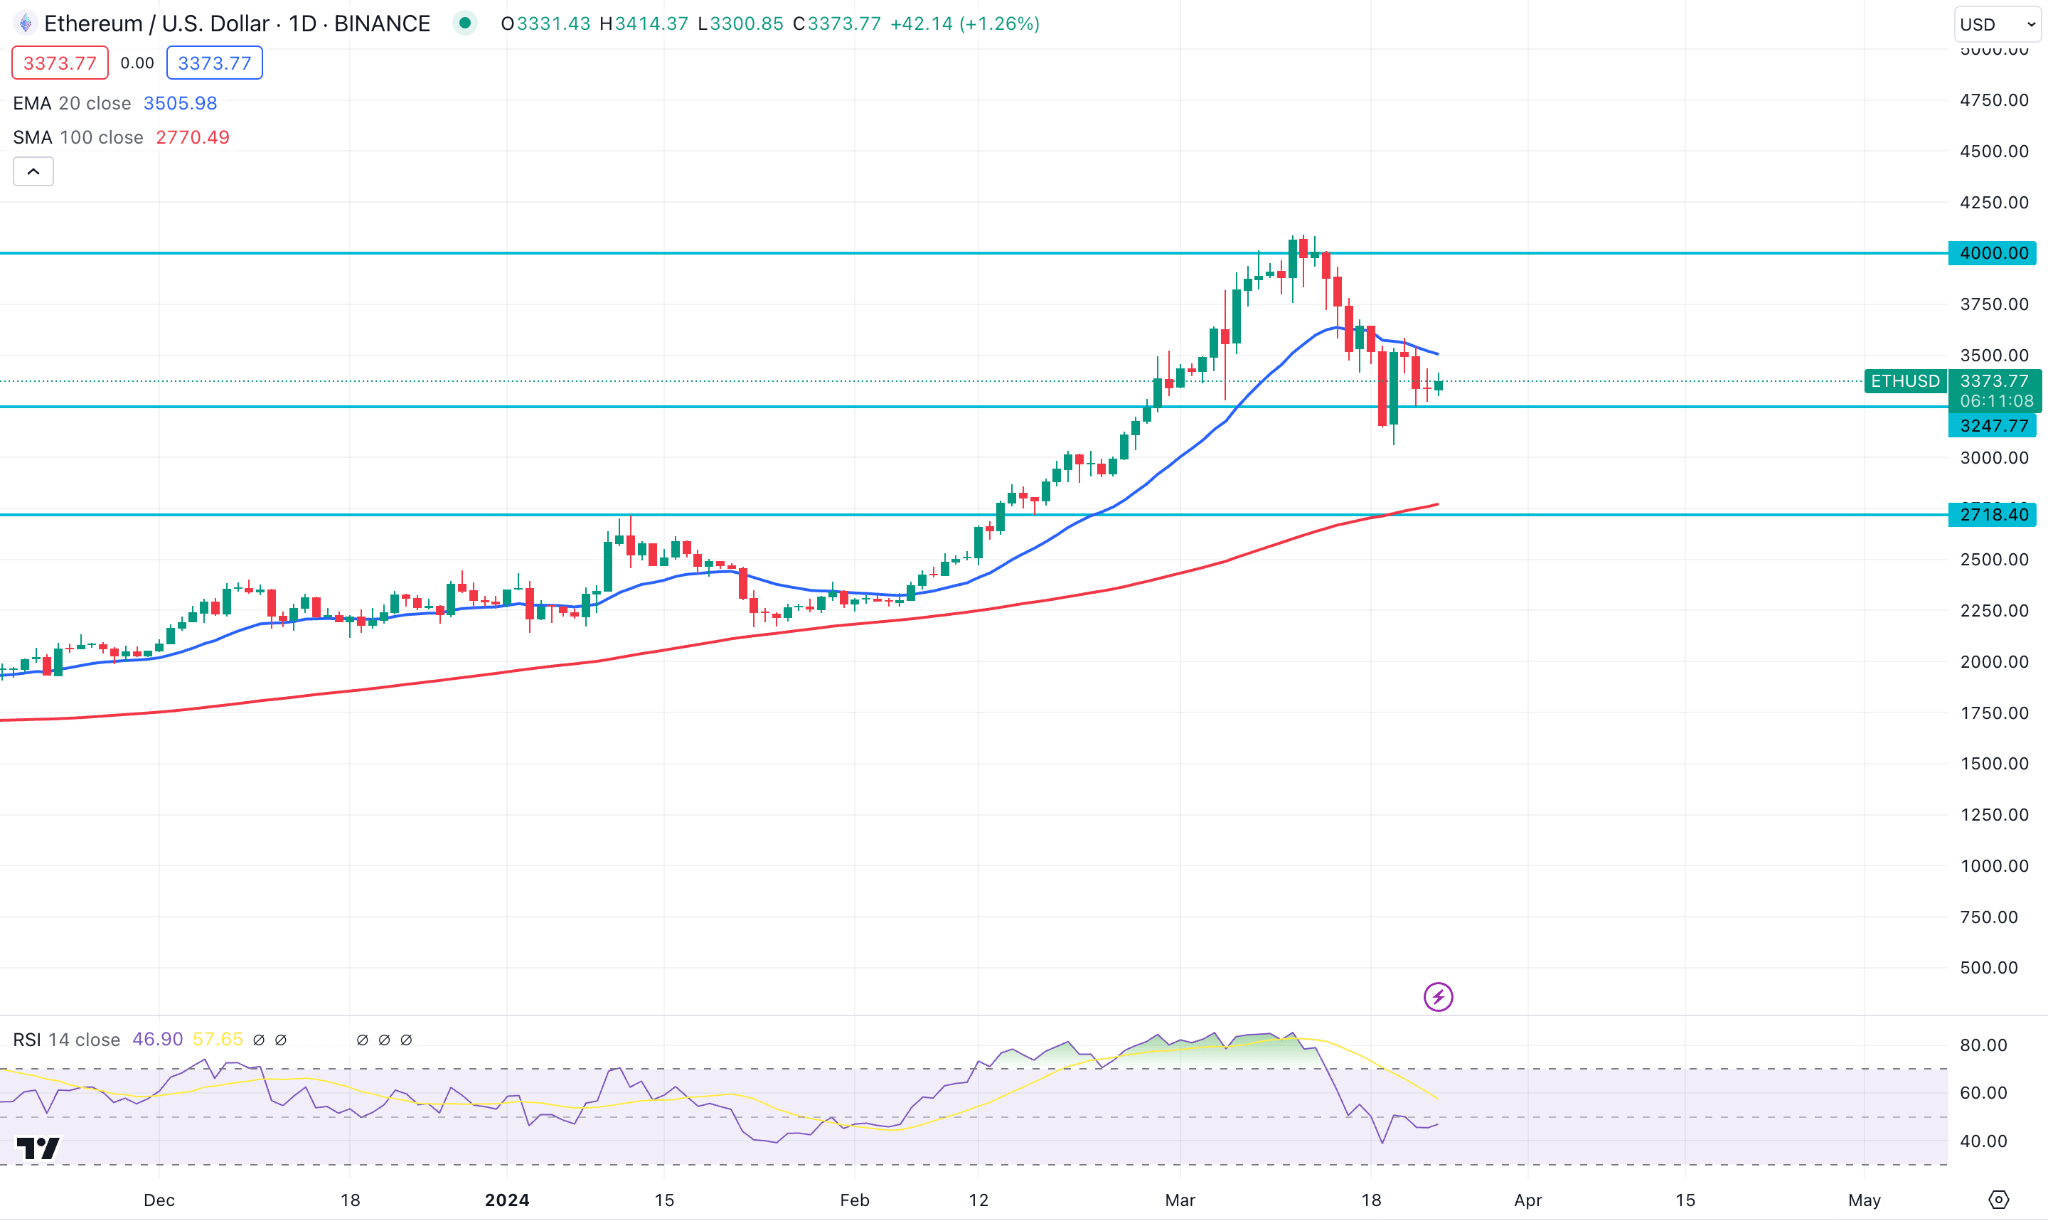
On the daily chart, a prolonged bearish correction is present after setting an all-time high. Moreover, the dynamic 20-day EMA is invalidated, while the 3247.77 support level is protected. Therefore, any rebound from this line, with a daily close above the 3750.00 level, could resume the existing trend.
On the other hand, if significant bearish pressure comes up, the price can reach the recent low near 3129.00 or the following support level near 2700.00.
Nvidia Stock (NVDA)
Fundamental Perspective
Last week, Nvidia's (NVDA) price surged upside after its artificial intelligence conference was completed.
Jensen Huang, Chief Executive, introduced “Blackwell,” the new chip by an artificial intelligence leader, at the company's AI developer conference. Later this year, several Nvidia partners will distribute the new AI chip that will expedite computing.
Due to the ongoing interest in Artificial Intelligence, William Stein, a Truist analyst, increased the price target of NVDA from $911 to $1,177 ahead of the conference. He sees solid demand for Nvidia's chips in 2024 and 2025. HSBC analysts also raised their price target from $880 to $1,050.
In February, NVDA delivered another quarter of beat-and-raise, with sales of $22.1 billion and earnings of $5.16 per share, beating the views of $20.4 billion sales and $4.59 earnings per share.
The company observed earlier that the biggest growth challenge was the limited supply of AI chips. Baird analysts saw it as a positive thing as customers may await the next generation B100 chip anticipated in the following quarter. B100 chips will likely have a higher average selling price and better performance.
Technical Perspective
The weekly chart of the NVDA stock shows a clear bullish trend for consecutive weeks, with no sign of exhaustion at the top.
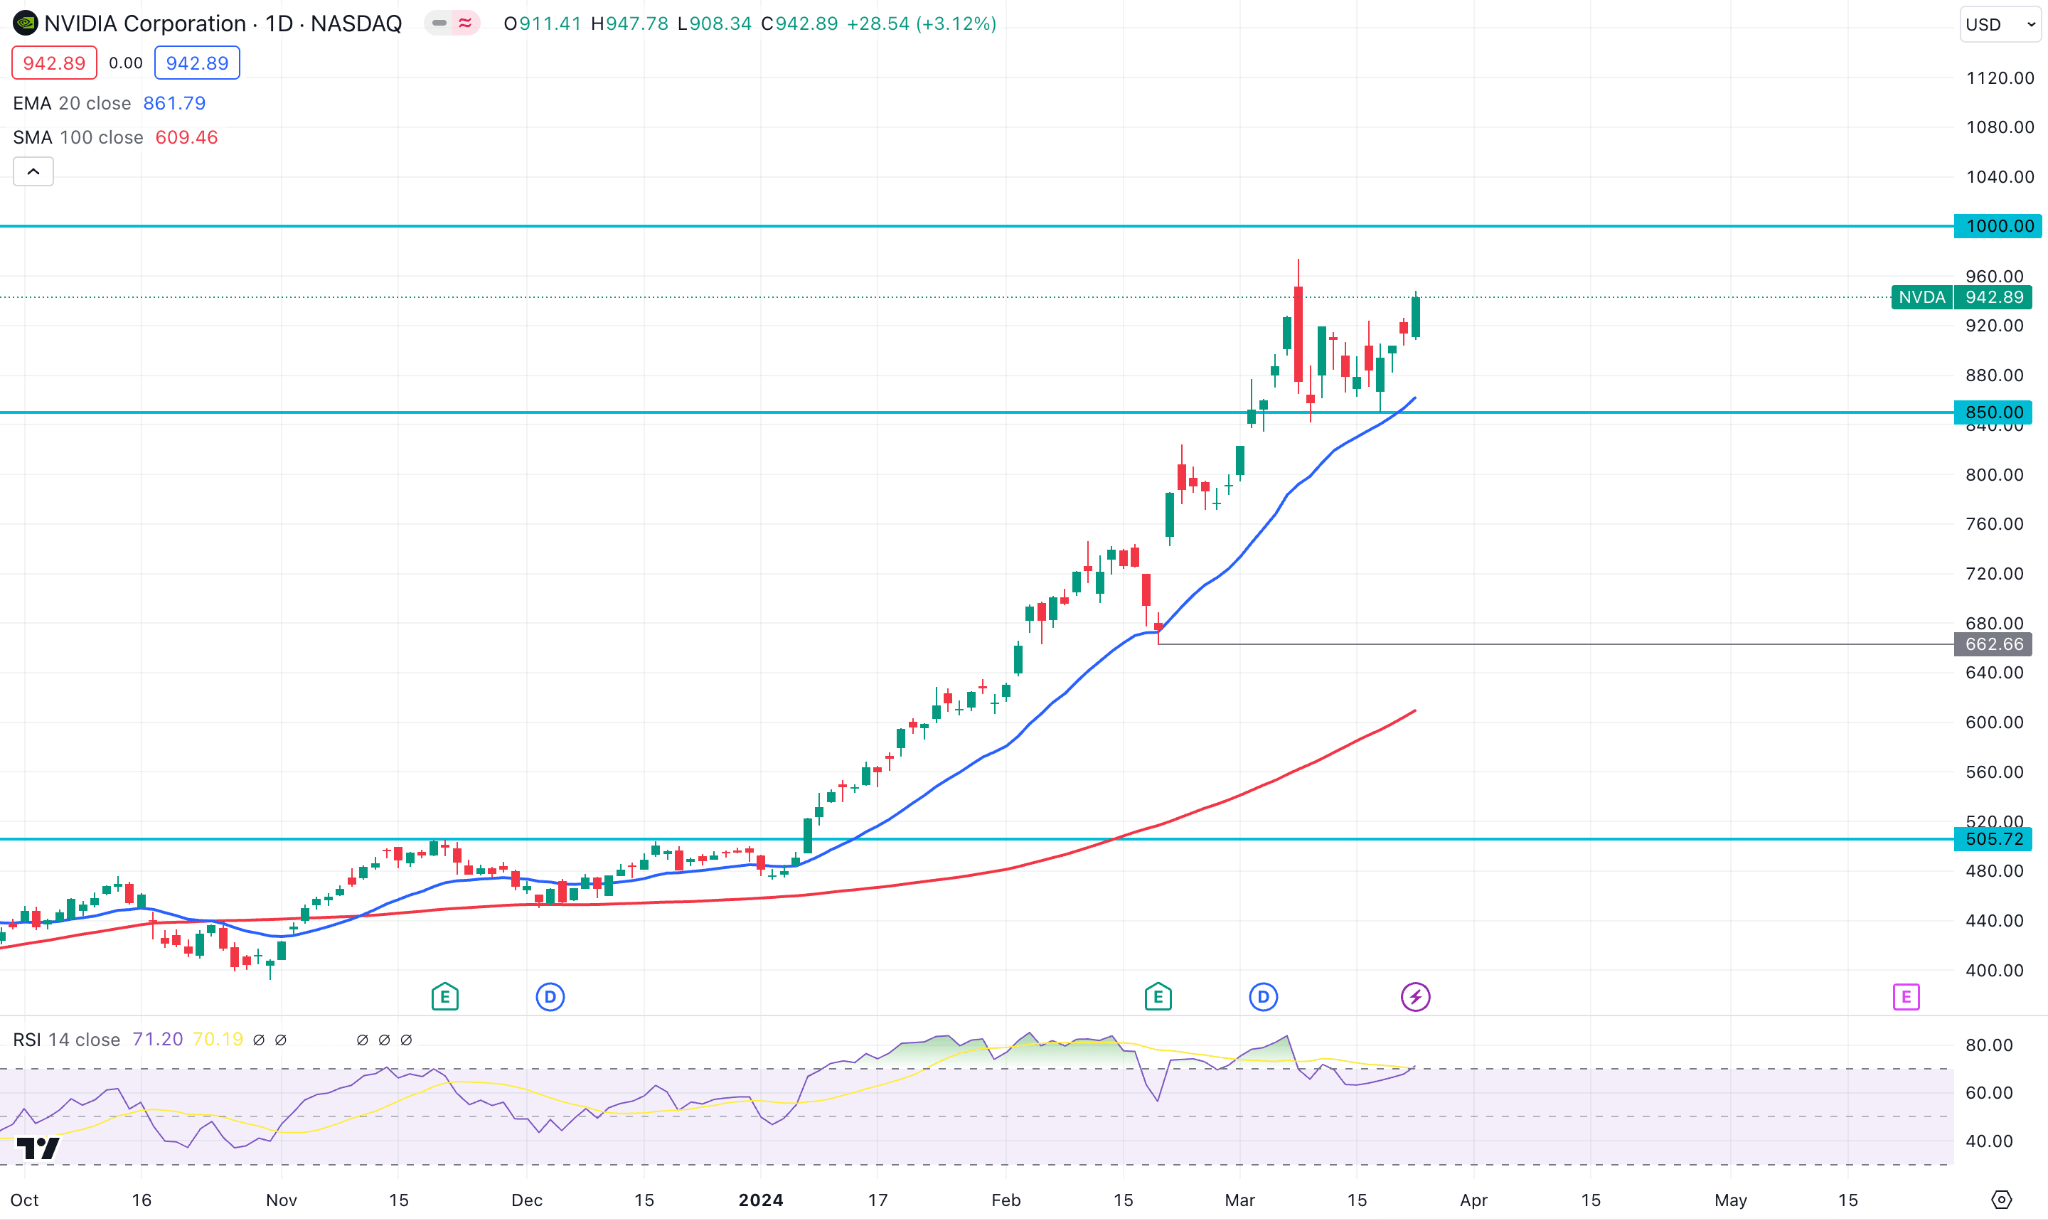
The daily chart confirms that the NVDA stock is digesting recent events and may soon be headed for the $1000 mark or above that level.
On the other hand, the upward possibility is potent as long as the price trades above the 850.00 static level. A selling pressure below this line with a valid daily close could open a minor downside possibility towards the 660.00 level.
Tesla Stock (TSLA)
Fundamental Perspective
Amid lukewarm sales, Tesla (NASDAQ: TSLA), the EV prime, has decreased its electric vehicle output in China. According to Bloomberg, the company asked employees to work five days a week rather than six-and-a-half in the Shanghai facility.
In the first two months, China witnessed a surge in new energy and passenger vehicle sales of 37.5% and 17%, respectively. Tesla still witnessed a sales decline despite this positive trend.
This move will decrease the production of Tesla's Model 3 Sedans and Model Y SUVs. The competition remains intact while China's overall passenger vehicle market is increasing. Tesla significantly depends on its Model Y, Model 3, and pre-2020 models to deal with local competitor companies such as BYD Co.
Decreasing EV production in its Shanghai facility might have occurred at an inappropriate time as this plant exclusively produces the Model Y and Model 3. The decision to cut production in these popular models in China could significantly impact Tesla's delivery.
Technical Perspective
The weekly chart of Tesla shows that the stock price has remained downward since the beginning of this year.
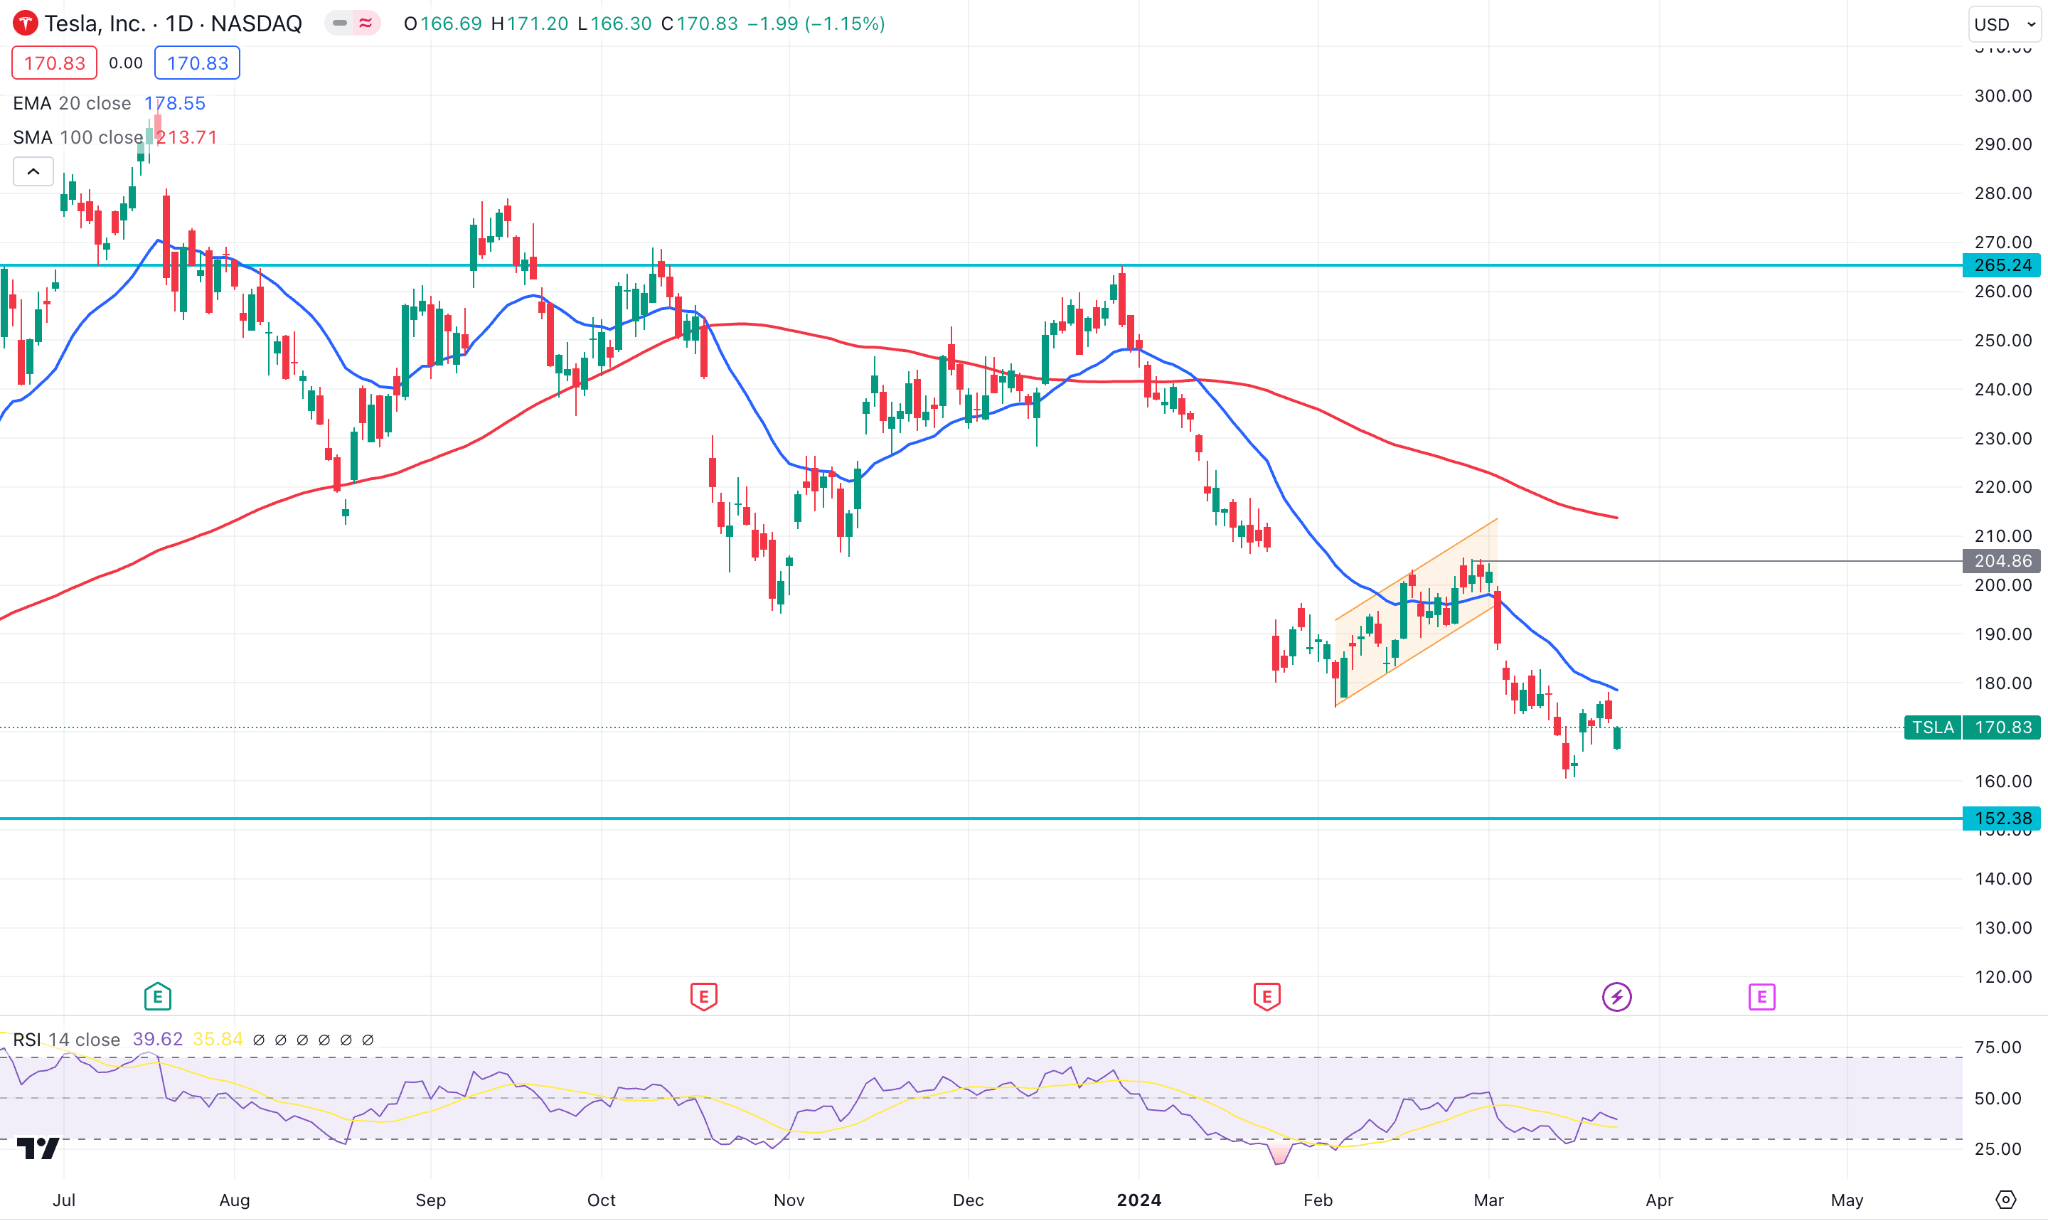
The daily chart shows the price standing just over a price support level near 152.38 level. A breakout below this level can trigger the price to reach the following support zone near 120.00.
On the other hand, a recovery above the 204.86 level with a counter-impulsive momentum could be the first sign of a bullish trend, aiming for the 260.00 level.
Gold (XAUUSD)
Fundamental Perspective
Last week, Jerome Powell, Fed Chairman, delivered an optimistic tone about the inflation outlook and put the USD remain under sell pressure. Additionally, Powell underscores that inflation numbers in the previous two months were “quite high” but did not change the overall story and define it as a seasonal effect.
Investors are waiting for data releases on Tuesday for February's Durable Goods Orders and the Consumer Confidence Index for March. Meanwhile, the US Bureau of Economic Analysis (BEA) will publish PCE price index data and the final revision for Q4 GDP on Friday.
The market anticipates Q4 GDP growth to be confirmed at 3.2%. A positive revision may weigh on XAU/USD by supporting USD, while a negative revision could weigh on USD.
At the beginning of the next week, a better-than-expected Core PCE price index might support USD. Conversely, a reading below the anticipated 0.3% mark can weigh on USD and support gold to gain more.
Technical Perspective
The weekly chart confirms the XAU/USD pair reached a record high above the $2200 mark and remained bullish for a longer period.
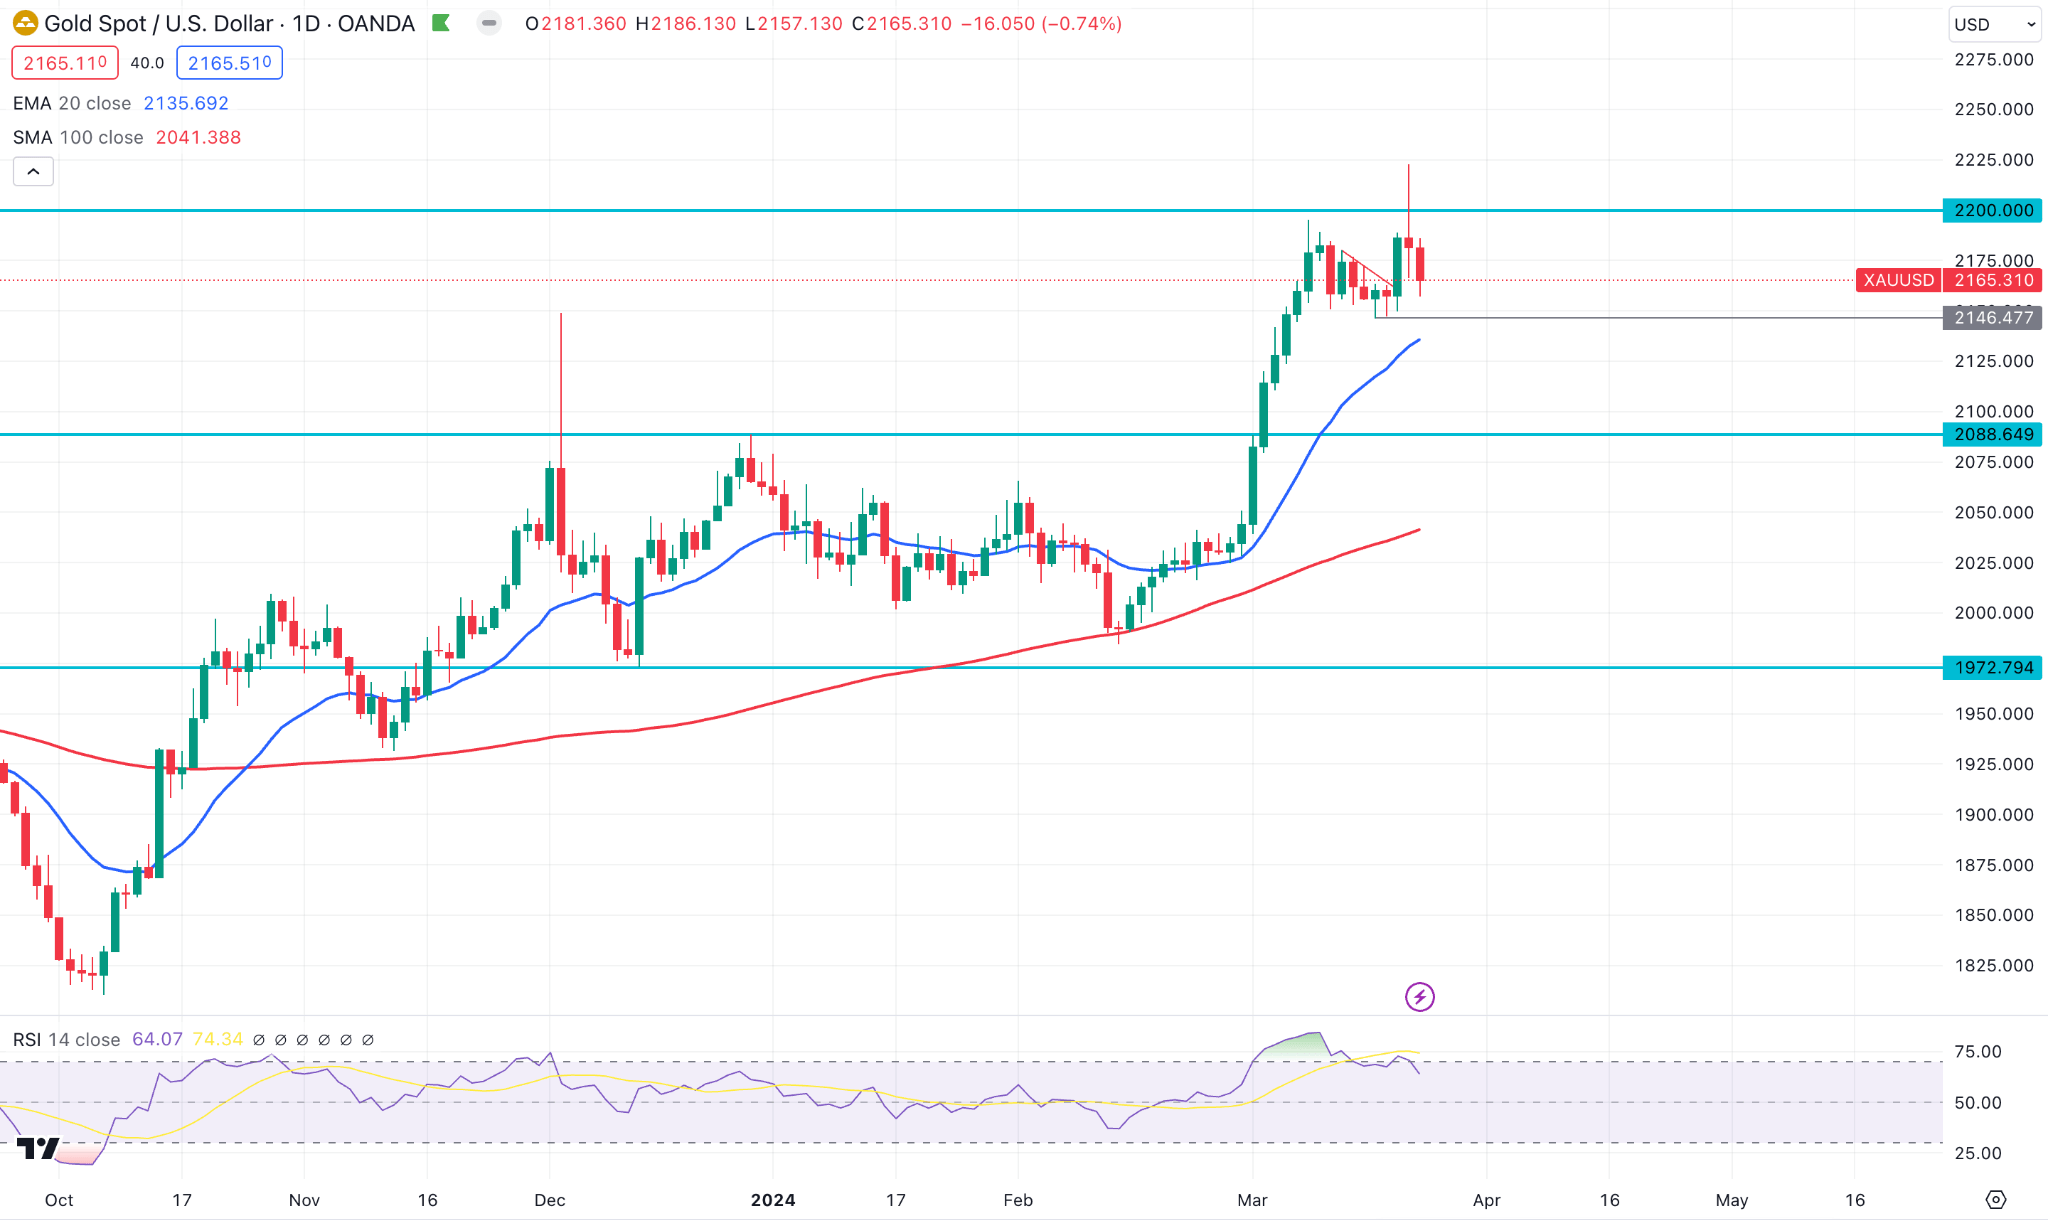
The daily chart confirms the price is facing little consolidation after reaching a peak above the 2200.00 level. A mixed sentiment is seen from technical indicators, where the RSI divergence shows the opposite signal of a bullish 20 dynamic EMA.
Investors should closely see the price action at the 2146.47 level, as a break below this line could indicate a bullish exhaustion. However, any rebound from the intraday chart could resume the trend towards the 2250.00 level.
WTI Crude Oil (USOUSD)
Fundamental Perspective
On Friday, Crude oil and gasoline prices finished mixed. Energy prices were under pressure as the DXY index reached a high of 5 weeks. Energy prices faced underlying support as a recent drone attack on Russian oil facilities from Ukraine deducted the average oil refining rate of Russia to a 10-month low.
Chinese crude oil demand has surged recently, supporting the rise in oil prices. Government data revealed on Monday that China processed 118.76 MMT Crude in January and February, 3% up from last year. The Chinese fuel demand also surged; airlines had 19% more people compared to the pre-pandemic peak, while expressway passenger volumes increased 54% compared to 2019.
Last Thursday, the IEA forecasted that the oil demand would increase in Q4 this year if OPEC+ kept up its oil production cuts, although if OPEC+ started pumping oil production, the balance would surpass. The OPEC+ will decide on [production levels for the second half of 2024 on June 1. The IEA also increased the global oil demand surge this year to 1.3 million bpd from 110,000 bpd due to an enhancement in fuel demand for ships to take more extended routes in the Red Sea to avoid Houthi attacks alongside a solid US economic outlook.
OPEC+ announces production cuts of about 2 million till June, and it was said to have "returned gradually subject to market conditions" in Q2. However, the crude production in February increased to 26.68 million bpd plus 110,000 bpd. Meanwhile, the UAE and Iraq continue to raise oil production, surpassing their quotas.
Technical Perspective
The weekly chart confirms the price has remained slightly bullish since the beginning of the year.
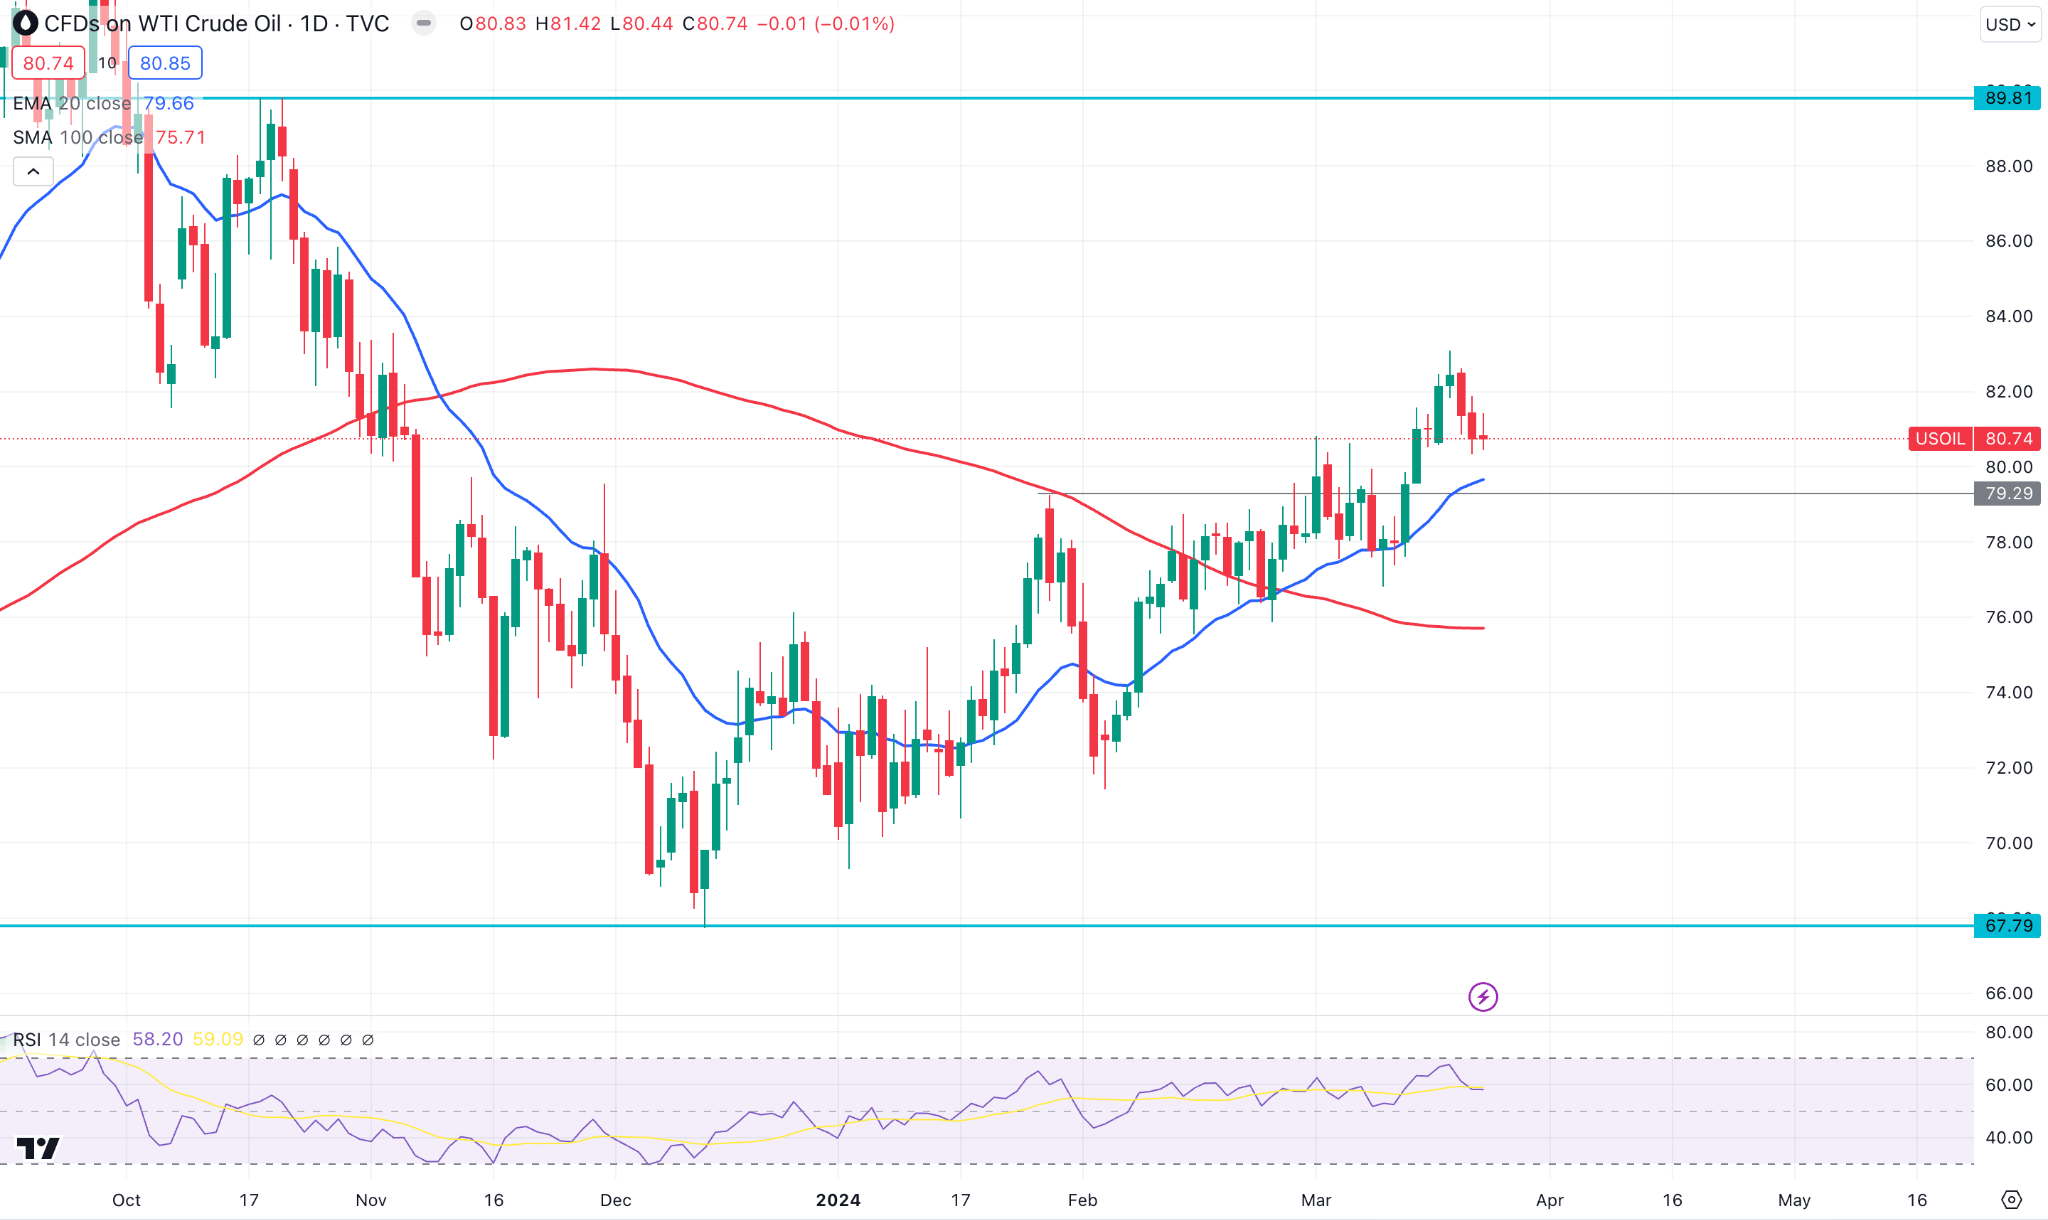
In the daily chart, an ongoing bullish pressure is visible, supported by the bullish crossover in dynamic lines. Moreover, the RSI is bullish above the 50.00 line, with a rising SMA line.
Based on this structure, any intraday dis could be a buying opportunity, where the ultimate aim is to test the 86.00 level.
Conversely, a selling pressure below the 79.79 static level could eliminate the existing buying pressure and lower the price towards the 72.00 area.


