


- Morgan Stanley (MS) displays mixed performance, with short-term fluctuations but long-term outperformance compared to S&P 500.
- Despite this, it boasts solid financials, underscored by stable net revenues, robust EPS, and strong ROTCE.
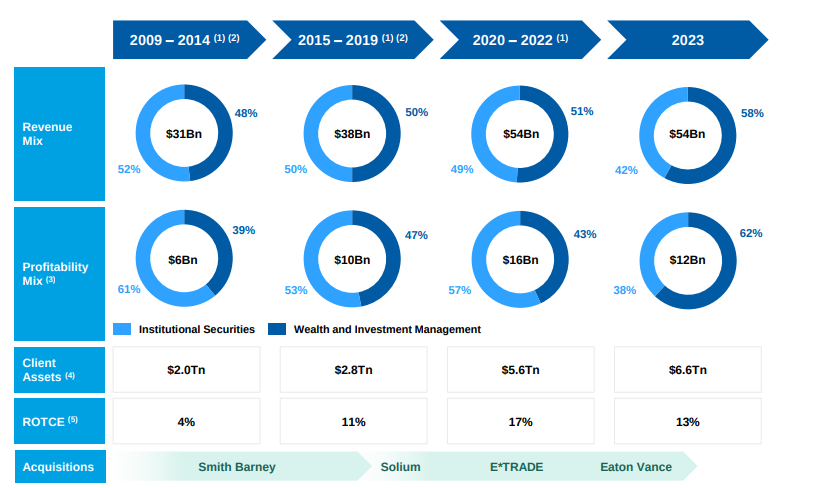
- Diversified revenue streams across Institutional Securities, Wealth Management, and Investment Management provide stability, while strategic acquisitions like Smith Barney, E*TRADE, and Eaton Vance bolster its market position and client base.
- Valuation metrics suggest a premium status, reflecting investor confidence in its earnings potential.
- Analysts project a slightly declining EPS for Q1 2024 but an optimistic outlook for Q2, with a varied range of price targets.
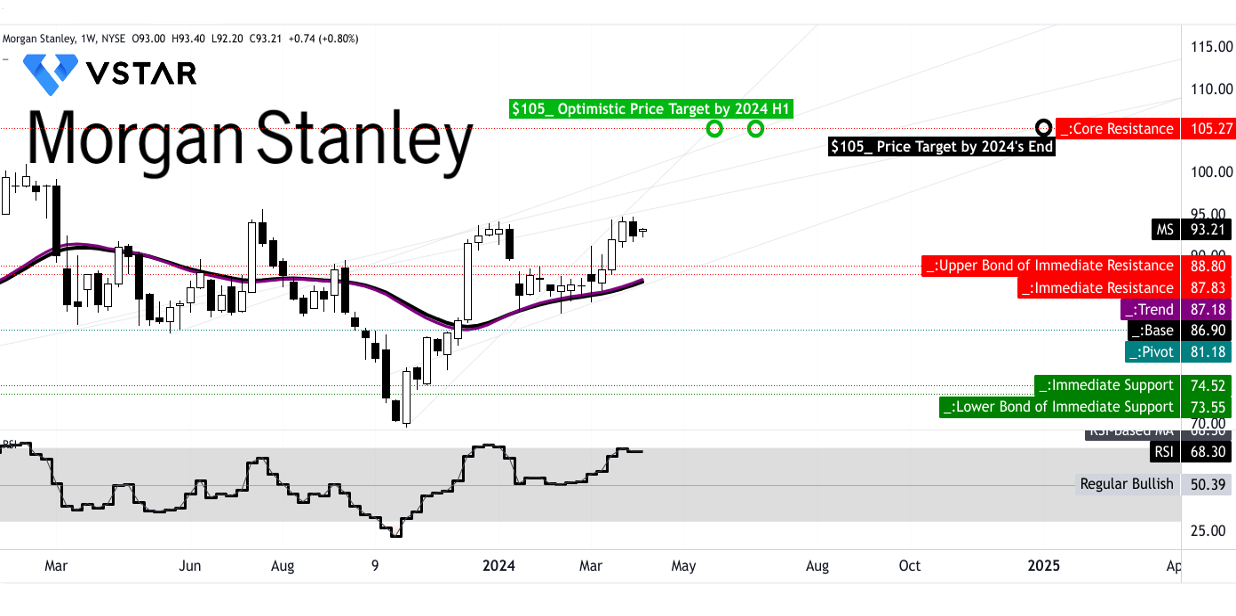
- Technical analysis suggests Morgan Stanley stock price may reach $105 by end of 2024, under ongoing uptrend with key support levels at $88.80 and $81.20.
Discovering opportunities in the financial market involves understanding the performance of key players like Morgan Stanley (MS). Ahead of Q1 2024 earnings, Morgan Stanley comparative performance against the S&P 500 index and the SPDR S&P Bank ETF (KBE) addresses the investors' edge on the stock investment. Additionally, delving into Morgan Stanley's fundamental strengths, strategic initiatives, and valuation metrics provides assessment of Morgan Stanley's growth potential.
MS Stock Price Performance
Comparing the performance of Morgan Stanley (MS), the S&P 500 index, and the SPDR S&P Bank ETF (KBE) across various time frames reveals insights into their relative strengths and weaknesses:
Short-Term Performance (6 Months, Price Return):
- MS: Underperformed the S&P 500 in the past 6 months.
- KBE: Outperformed both MS and the S&P 500 in the past 6 months.
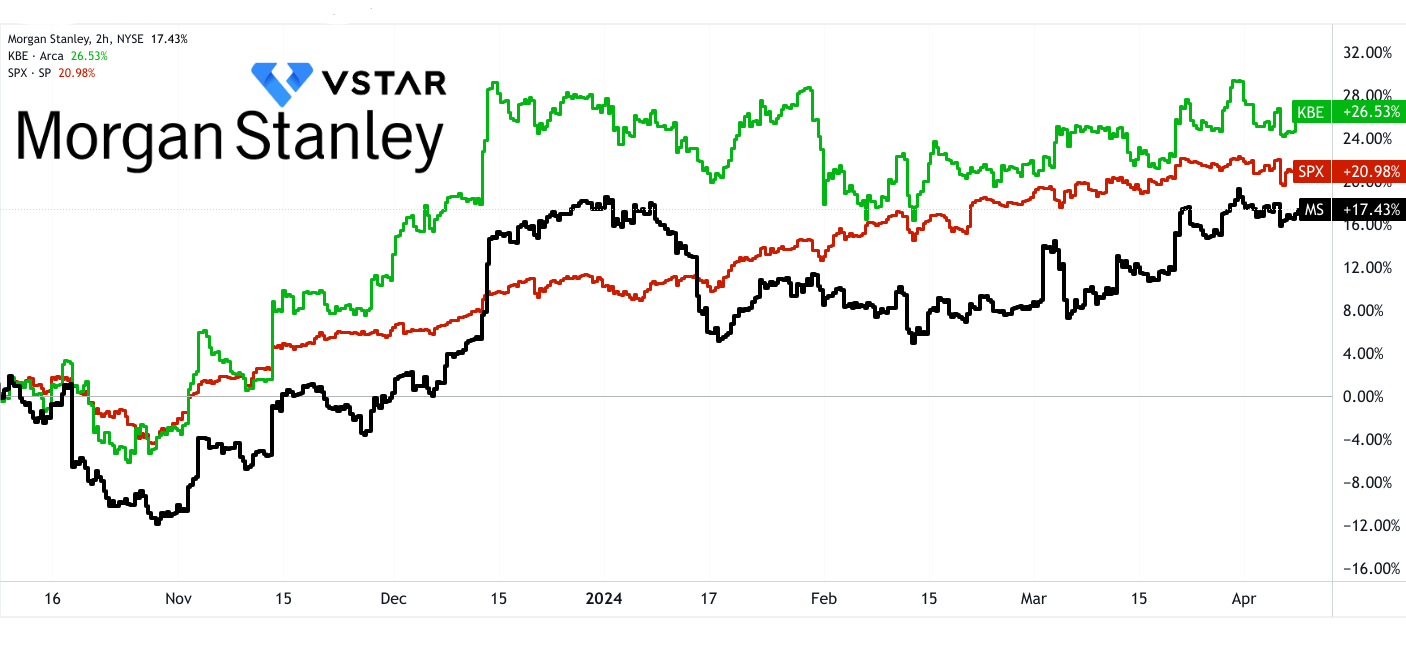
Source: tradingview.com
Long-Term Performance (5 Year, Price return):
- MS: Outperformed the S&P 500 and KBE, indicating solid long-term growth compared to the broader market and the benchmark.
- KBE: Performed decisively weaker compared to both MS and the S&P 500.
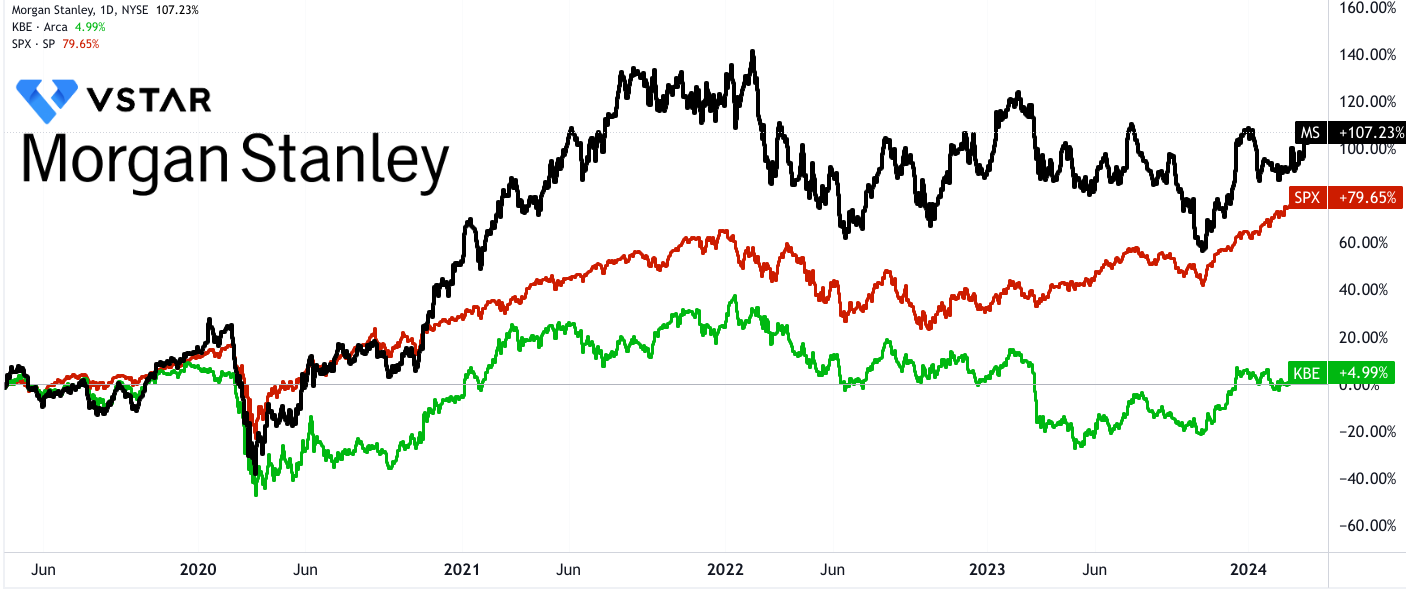
Overall, while MS may exhibit short-term fluctuations and long-term outperformance, its long-term performance consistently ahead of both the S&P 500 and KBE.
Morgan Stanley Fundamental Strengths
Solid Financial Performance:
Morgan Stanley's financial performance, as highlighted by its earnings results, serves as a fundamental strength supporting its rapid growth potential. Key numerical metrics such as net revenues, earnings per share (EPS), and Return on Tangible Common Equity (ROTCE) underscore the company's stability and growth prospects.
In the fourth quarter of 2023, Morgan Stanley reported net revenues of $12.9 billion, with a net income applicable of $1.5 billion, translating to an EPS of $0.85. Full-year net revenues for 2023 stood at $54.1 billion, with net income applicable of $9.1 billion and an EPS of $5.18. ROTCE for the full year was 12.8%, indicating strong returns on invested capital.
The consistent growth in net revenues signifies Morgan Stanley's ability to generate substantial income, reflecting a robust business model. Despite facing challenges such as geopolitical and macroeconomic headwinds, the company maintained solid profitability as evidenced by its EPS and ROTCE figures. These financial metrics provide a strong foundation for Morgan Stanley's rapid growth potential by showcasing its capacity to generate earnings and deliver value to shareholders.
Diversified Revenue Streams and Client Base:
Morgan Stanley's diversified revenue streams across various business segments, coupled with a broad client base, contribute significantly to its growth potential. This diversification mitigates risks associated with fluctuations in specific markets or sectors, while also tapping into different revenue-generating opportunities.
- The Institutional Securities segment reported full-year net revenues of $23.1 billion.
- Wealth Management delivered full-year net revenues of $26.3 billion.
- Investment Management reported full-year net revenues of $5.4 billion.
Source: MS strategic update
Diversification across Institutional Securities, Wealth Management, and Investment Management provides stability and resilience to Morgan Stanley's revenue streams. Each segment caters to distinct client needs and market dynamics, allowing the company to capture opportunities across various sectors and geographies. The broad client base, ranging from retail investors to institutional clients, enhances Morgan Stanley's revenue-generating potential and minimizes dependency on any single client or market segment.
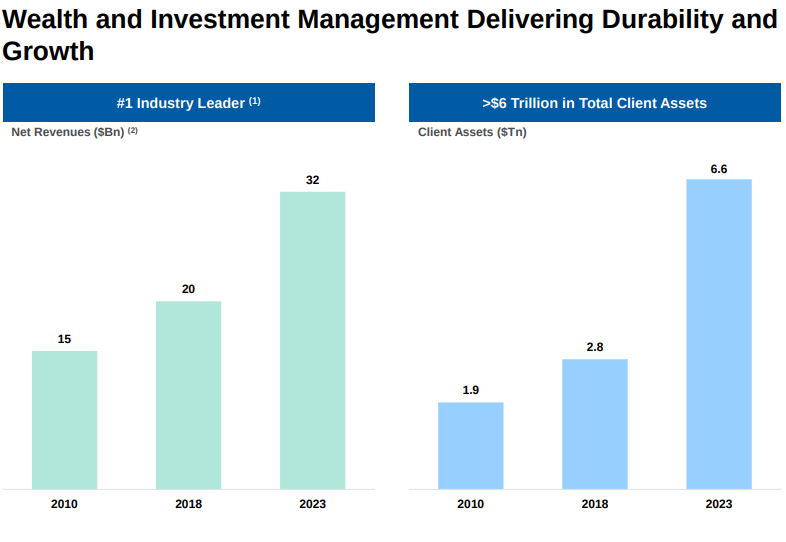
Strategic Acquisitions and Business Transformations:
Morgan Stanley's strategic acquisitions and business transformations over the years have positioned it for accelerated growth and market leadership. These initiatives have expanded its business mix, scale, and profitability, paving the way for future opportunities and sustained competitive advantage.
- Transformation initiatives over 15 years, including the acquisition and integration of Smith Barney, acquisitions of E*TRADE and Eaton Vance, and others.
- Client assets have more than tripled to $6.6 trillion since 2010, reflecting successful integration and expansion efforts.
Acquisitions such as Smith Barney, E*TRADE, and Eaton Vance have enabled Morgan Stanley to diversify its offerings, enhance its client base, and capitalize on emerging market trends. The tripled client assets demonstrate the effectiveness of these strategic moves in driving growth and solidifying Morgan Stanley's position as a market leader. By continuously evolving its business mix and scale, Morgan Stanley is well-positioned to seize future growth opportunities and maintain its competitive edge in the financial services industry.
Integrated Investment Banking Platform:
Morgan Stanley's integrated investment banking platform, encompassing advisory, equity underwriting, and fixed income services, positions it as a trusted advisor to corporations and institutions worldwide. The company's extensive capabilities and premier brand enable it to capture a significant share of global capital allocation and formation activities.
Over the last decade, Morgan Stanley advised on nearly $9 trillion in M&A transactions and raised nearly $13 trillion of capital for clients. The Institutional Securities segment reported net revenues of $23.1 billion in 2023.
Morgan Stanley's track record in advising on M&A transactions and capital raising activities underscores its expertise and market leadership in investment banking. The integrated nature of its investment banking platform allows Morgan Stanley to offer comprehensive solutions to clients, spanning across geographies, industries, and financial products. As global economic activity rebounds and corporate confidence strengthens, Morgan Stanley is poised to capitalize on increased demand for advisory services and capital raising, driving further growth and revenue expansion.
Morgan Stanley Downsides and Weakness
Net Revenue and Profitability Trends:
Morgan Stanley's net revenues for the fourth quarter of 2023 stood at $12.9 billion, showing a marginal increase from the previous year's $12.7 billion. Despite this slight uptick in revenue, the net income applicable to shareholders decreased significantly, dropping from $2.2 billion to $1.5 billion compared to the same period a year ago. This decline in net income indicates a weakening profitability trend for the company.
Similarly, for the full year of 2023, Morgan Stanley reported net revenues of $54.1 billion, slightly up from the $53.7 billion recorded in the previous year. However, the net income applicable to shareholders decreased notably from $11.0 billion to $9.1 billion year-over-year. These figures highlight a concerning trend of declining profitability despite modest revenue growth.
The Return on Tangible Common Equity (ROTCE), a key measure of profitability, also experienced a decline. In the fourth quarter, the ROTCE was reported at 8.4%, down from the previous year's level of 12.8%. This indicates a reduced ability of the company to generate profits from its tangible common equity, which may raise concerns among investors and stakeholders about the company's performance and growth potential.
Source: MS strategic update
Morgan Stanley Performance Outlook
The Federal Reserve's interest rate decisions directly influence Morgan Stanley's borrowing costs and investment banking activities. Higher interest rates increase borrowing costs for Morgan Stanley, potentially impacting profitability. Moreover, rising rates may deter clients from pursuing mergers and acquisitions or raising capital, affecting investment banking revenues. Wealth and asset management divisions may also be affected, with changes in client investment preferences due to fluctuating interest rates.
Consensus EPS Estimates
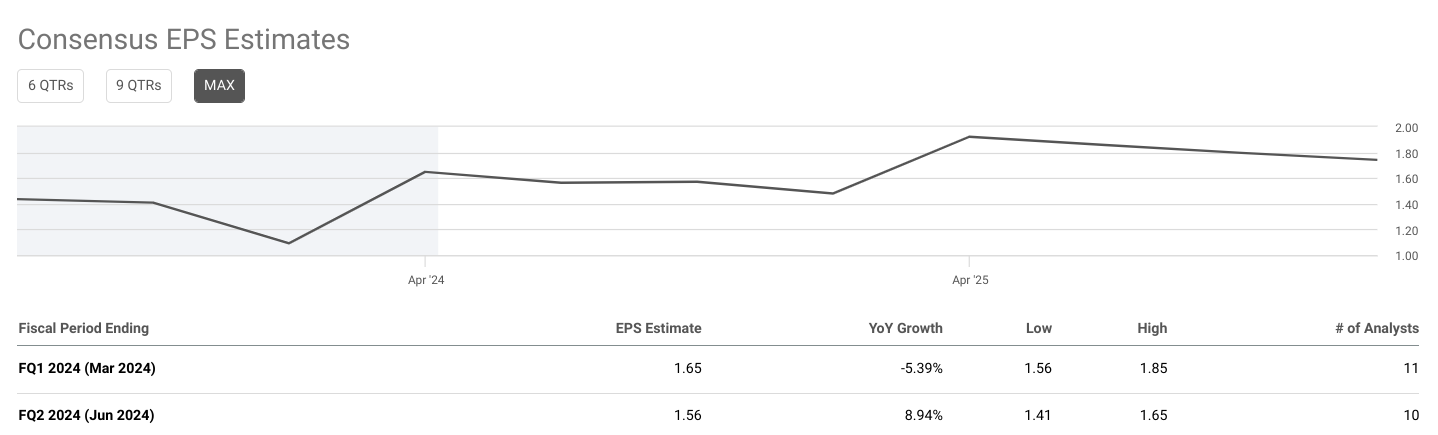
Morgan Stanley's consensus EPS estimates provide crucial insights into the expected earnings per share for fiscal periods ending in March 2024 (FQ1) and June 2024 (FQ2). These estimates are derived from analyst projections and are indicative of the company's financial performance expectations.
In FQ1 2024, Morgan Stanley's EPS estimate stands at $1.65, representing a decline of 5.39% compared to the previous year. This indicates that analysts anticipate a slight decrease in earnings compared to the same period last year. The range for this estimate varies from $1.56 to $1.85, as provided by 11 analysts. Despite the negative growth rate, the company is expected to maintain profitability, albeit at a slightly lower level compared to the previous year.
For FQ2 2024, the EPS estimate is $1.56, with a year-over-year growth rate of 8.94%. This suggests an optimistic outlook for earnings growth compared to FQ1. The range for this estimate varies from $1.41 to $1.65, as provided by 10 analysts. Despite the positive growth rate, it's noteworthy that the EPS estimate for FQ2 is lower than that for FQ1, indicating potential fluctuations in earnings performance throughout the fiscal year.
Source: seekingalpha.com
Consensus Revenue Estimates
The consensus revenue estimates provide insights into the expected revenue performance of Morgan Stanley for the same fiscal periods as the EPS estimates, ending in March 2024 (FQ1) and June 2024 (FQ2).
In FQ1 2024, the revenue estimate stands at $14.36 billion, with a year-over-year growth rate of -1.11%. This suggests a slight decrease in revenue compared to the same period last year. The revenue estimate range varies from $13.69 billion to $14.75 billion, as provided by 14 analysts. Despite the negative growth rate, the company is expected to generate substantial revenue, albeit at a slightly lower level compared to the previous year.
For FQ2 2024, the revenue estimate is $14.10 billion, indicating a year-over-year growth rate of 4.79%. This suggests a more optimistic outlook for revenue growth compared to FQ1. The revenue estimate range varies from $13.23 billion to $14.67 billion, as provided by 14 analysts. Unlike the EPS estimates, the revenue estimate for FQ2 is higher than that for FQ1, indicating potential improvements in revenue performance as the fiscal year progresses.
Consensus EPS Revision Trend
The consensus EPS revision trend illustrates how analyst expectations regarding Morgan Stanley's earnings per share have evolved over time.
For FQ1 2024, the EPS estimate has experienced downward revisions over the past one month, three months, and six months. The one-month trend indicates a revision of -1.08%, while the three-month and six-month trends show revisions of -1.53% and -12.53%, respectively. These negative trends suggest a consistent decrease in analyst expectations for earnings performance in FQ1, reflecting potential challenges or uncertainties facing the company during this period.
For FQ2 2024, although the EPS estimate has also seen downward revisions over the past one month, three months, and six months, the extent of the revisions is comparatively lower. The one-month trend indicates a slight revision of 0.07%, while the three-month and six-month trends show revisions of -2.71% and -13.20%, respectively. Despite the downward revisions, the trends suggest a relatively stabilized outlook for earnings in FQ2 compared to FQ1.
Consensus Revenue Revision Trend
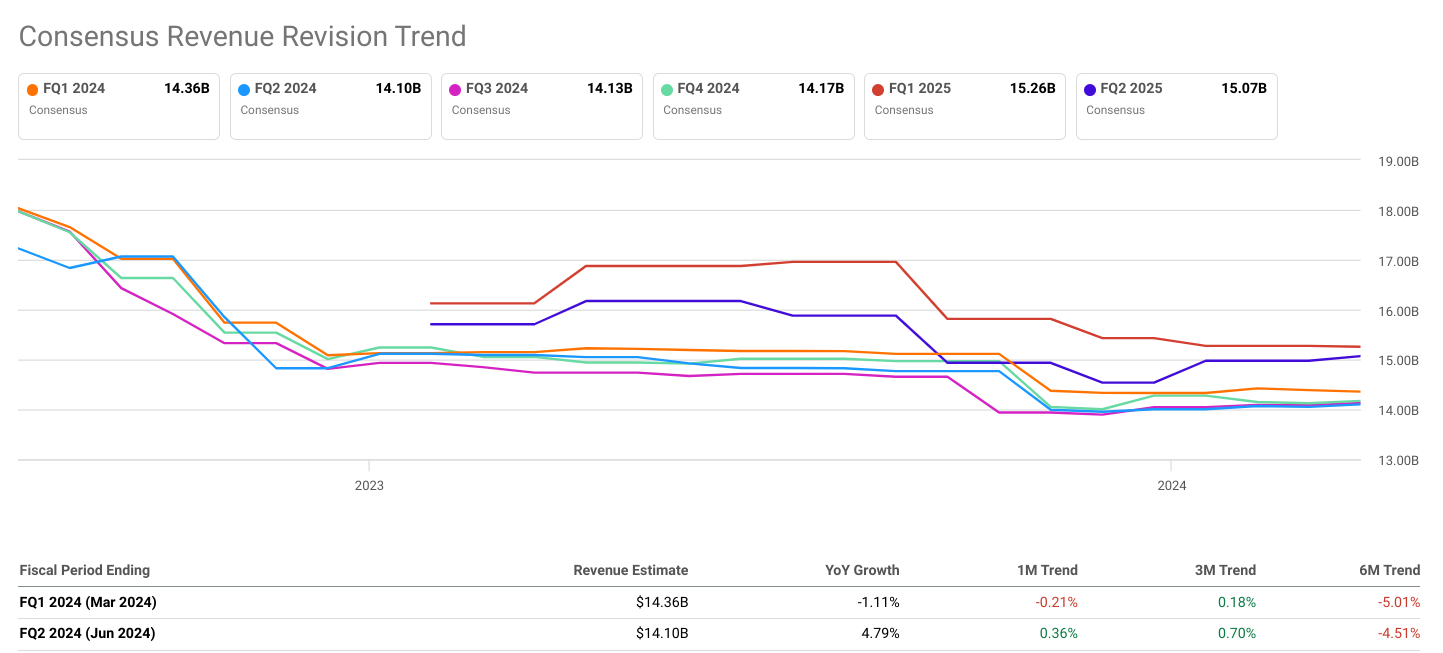
Similar to the EPS revision trend, the consensus revenue revision trend indicates how analyst expectations regarding Morgan Stanley's revenue have changed over time.
For FQ1 2024, the revenue estimate has experienced downward revisions over the past one month, three months, and six months. The one-month trend indicates a revision of -0.21%, while the three-month and six-month trends show revisions of 0.18% and -5.01%, respectively. Despite the downward revisions, the recent one-month trend suggests a potential stabilization in revenue expectations for FQ1, albeit at a slightly lower level compared to previous estimates.
For FQ2 2024, the revenue estimate has seen consistent upward revisions over the past one month, three months, and six months. The one-month trend indicates a revision of 0.36%, while the three-month and six-month trends show revisions of 0.70% and -4.51%, respectively. These positive trends suggest increasing confidence among analysts regarding the company's revenue performance in FQ2, reflecting an improving outlook for revenue growth compared to FQ1.
Source: seekingalpha.com
Morgan Stanley (NYSE:MS) Valuation
P/E Ratio Assessment
P/E Non-GAAP (Forward):
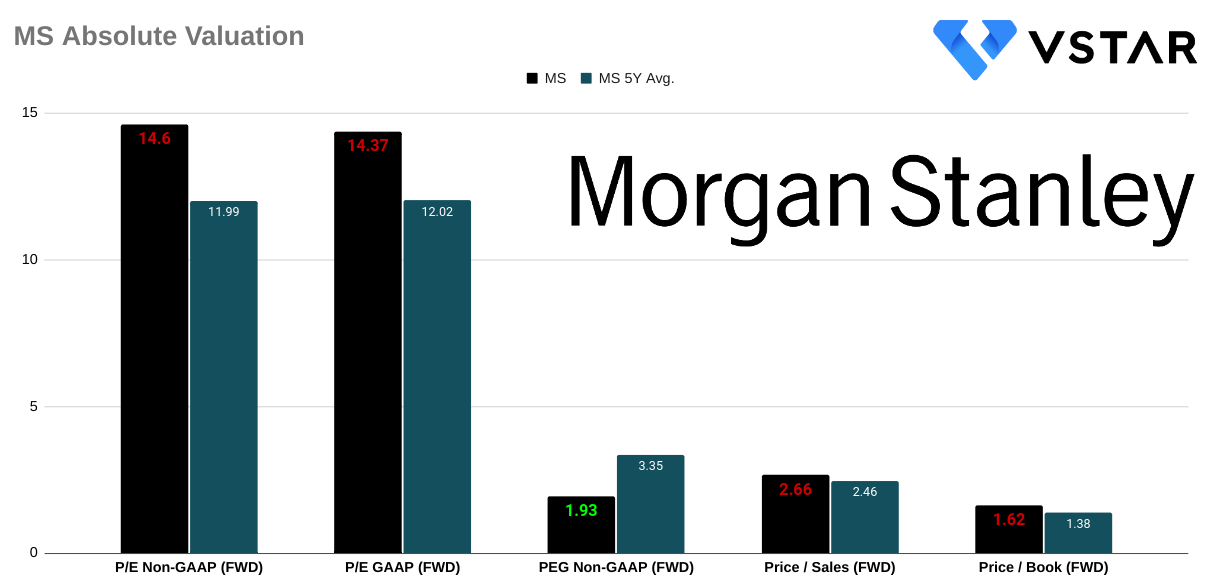
Morgan Stanley's forward P/E ratio of 14.6 indicates that investors are willing to pay $14.60 for every dollar of the company's earnings. This valuation represents a 40.87% premium compared to the sector median P/E of 10.37. Over the past five years, there has been a notable increase in Morgan Stanley's P/E ratio, with the current figure standing 21.85% higher than the five-year average of 11.99. This suggests a trend towards higher valuation multiples, indicating increased investor confidence in Morgan Stanley's earnings potential.
P/E GAAP (Forward):
The forward GAAP P/E ratio of 14.37 reflects a premium valuation of 36.73% over the sector median P/E of 10.51. Similarly, there has been a notable increase in this metric compared to the five-year average, with the current figure standing 19.49% higher than the average of 12.02. This implies that even under stricter accounting standards, investors are still willing to pay a considerable premium for Morgan Stanley's earnings potential.
PEG Ratio Evaluation
PEG Non-GAAP (Forward):
Morgan Stanley's PEG ratio of 1.93 suggests that the stock may be trading at a higher valuation relative to its earnings growth potential compared to the sector median PEG of 1.32. This represents a premium of 46.69%. However, when considering the five-year average PEG ratio of 3.35, there's a notable decrease of -42.36%. This indicates potential undervaluation in terms of growth prospects relative to historical performance, suggesting that while the stock may appear expensive relative to its peers, it may be undervalued when considering its growth potential.
Source: Analyst's Compilation
Price/Sales and Price/Book Analysis
Price/Sales (Forward):
With a forward price-to-sales ratio of 2.66, Morgan Stanley appears to be trading at a slight premium of 6.68% compared to the sector median of 2.49. Moreover, it's also higher than its own five-year average by 8.26%, indicating that investors are willing to pay more for each dollar of Morgan Stanley's sales compared to both its peers and its historical performance.
Price/Book (Forward):
The forward price-to-book ratio of 1.62 indicates a significant premium of 56.27% over the sector median of 1.04. Furthermore, compared to its own five-year average of 1.38, the premium is still notable at 17.29%. This suggests that investors are paying a substantial premium for Morgan Stanley's book value compared to both its peers and its historical average.
Dividend Assessment
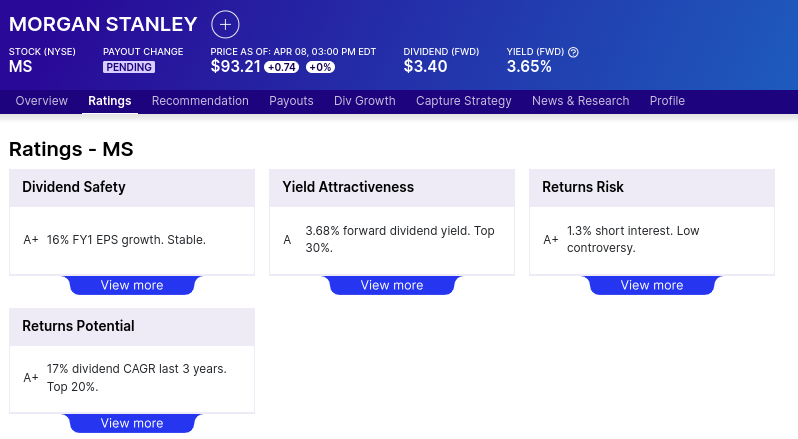
Morgan Stanley offers a forward dividend yield of 3.68%, with an annual payout of $3.40 per share. The payout ratio stands at 58.55%, indicating that the company distributes approximately 58.55% of its earnings as dividends. The five-year growth rate for dividends is robust at 23.66%, suggesting a healthy increase in shareholder returns over the years. Additionally, the consistent dividend growth over the past 10 years indicates the company's commitment to returning value to its shareholders.
Source: dividend.com
Analyst Forecasts and Ratings
According to CNN, out of 26 analyst ratings, 38% recommend buying MS, while 62% suggest holding the stock, with no sell recommendations. The one-year stock price forecasts from high, median, and low projections indicate potential price ranges of $80 to $116. The current stock price of $93.21 falls within this range.
As per the Wall Street Journal, the stock price targets range from a low of $80 to a high of $116, with a median target of $95. The average target price is slightly higher at $95.87 compared to the median target.
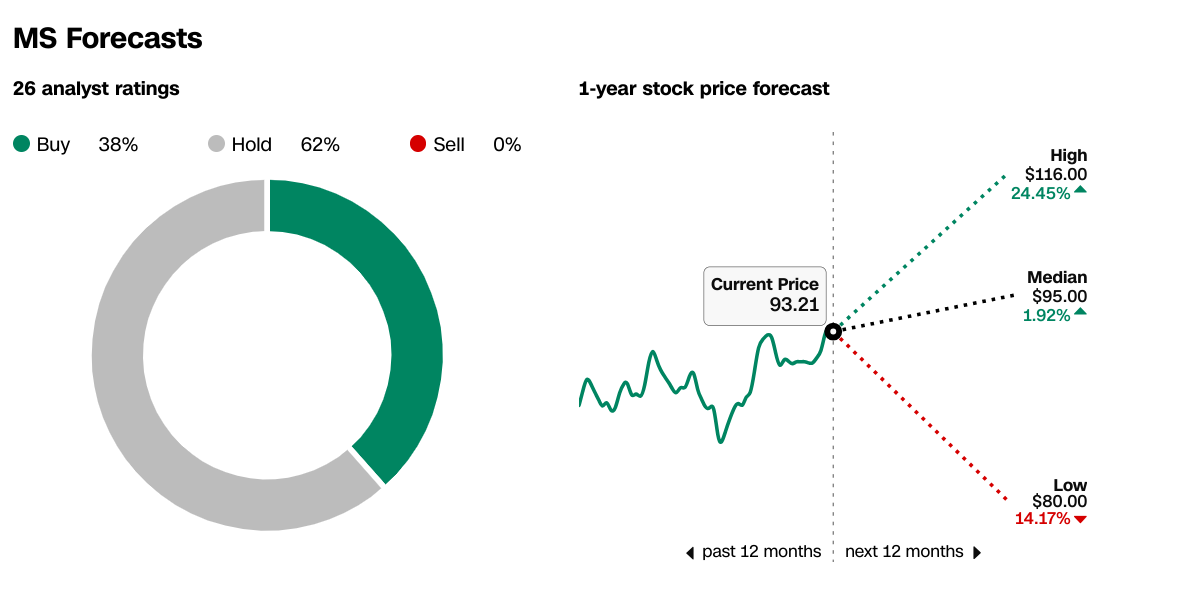
Source: CNN.com
MS Stock Price Technical Take
The Morgan Stanley stock price may hit $105 by the end of 2024. The target is based on the current momentum of change in polarity over the mid-term projected over Fibonacci retracement and extension levels. Currently, the price is moving sideways above the horizontal price channel. Here, $88.80 and $81.20 may serve as the critical support levels for the ongoing uptrend of the stock price. These levels are the upper bond and the pivot of the current horizontal price channel.
The price has taken significant support at the modified exponential moving average. With that, the price has breached the prevailing resistance near $88.80 during March–April 2024. Looking at the RSI, at 68, the stock price is near an overbought state, signifying the possibility of a small correction to retest $88.80.
Optimistically, MS stock price may reach $105 by the end of June 2024. This projection is based on a short-term change in polarity over the 12-month and 6-month periods (weekly). This target may be reached based on possible earnings surprises for Q1 2024 and a progressive outlook for Q2 2024.

Source: tradingview.com
In conclusion, despite short-term fluctuations, Morgan Stanley's long-term trajectory suggests consistent progress ahead of the broader market and potential challenges in maintaining profitability. Considering analyst forecasts and technical indicators, a cautious approach is advised, with a projected target price of $105 by the end of June 2024, acknowledging potential corrections along the way.


