


- Inflationary Trends: CPI-U indicates a 0.4% increase, driven by housing and gasoline indices, reflecting sustained inflationary pressures.
- Sectoral Dynamics: Fluctuations observed in energy, food, and service sectors highlight diverse market dynamics and consumer spending patterns.
- Employment Implications: Job gains in healthcare and construction sectors bolster consumer confidence, impacting companies within indices like S&P 500 and Nasdaq 100.
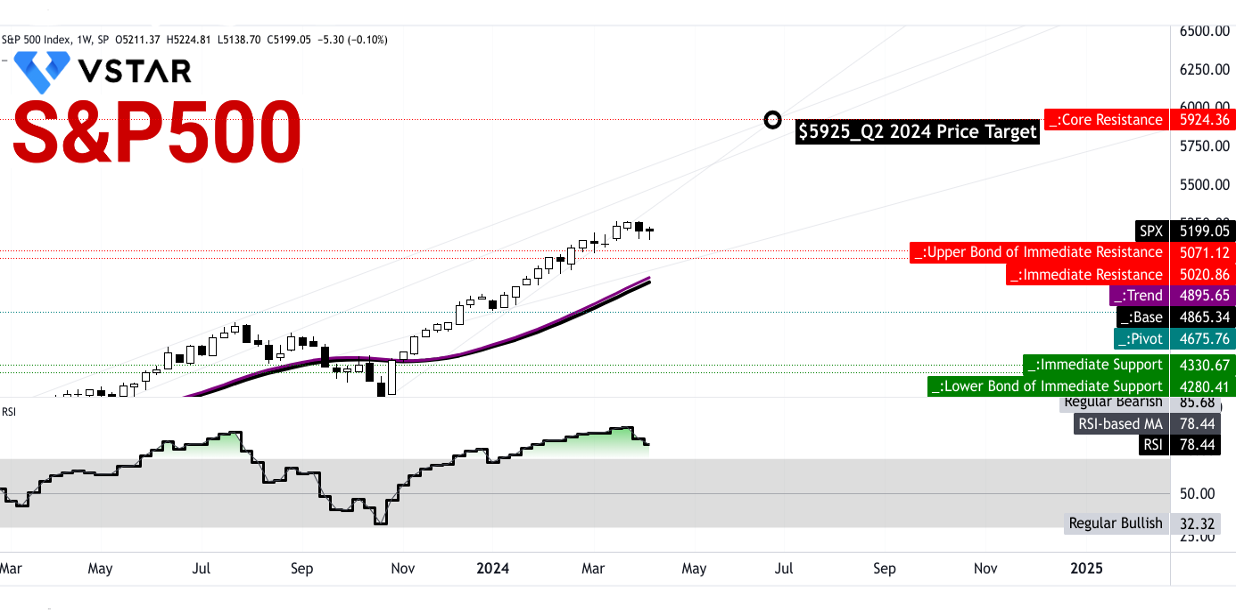
- Market Outlook: Despite inflationary concerns, the S&P 500 maintains support levels, with a projected price target of $5925 by Q2 2024, albeit potential corrections indicated by the Relative Strength Index (RSI).
The March 2024 US economic data, particularly the Consumer Price Index (CPI) and Producer Price Index (PPI), unveils critical insights into inflationary pressures and sectoral dynamics. With a 0.4% increase in the CPI-U, driven notably by housing and gasoline indices, inflationary momentum persists. Rising energy and food costs, coupled with fluctuations in service sectors, underscore complex market dynamics. Job gains and losses in diverse sectors influence consumer spending patterns, impacting companies across indices like the S&P 500 and Nasdaq 100.
Analysis of US Economic Data
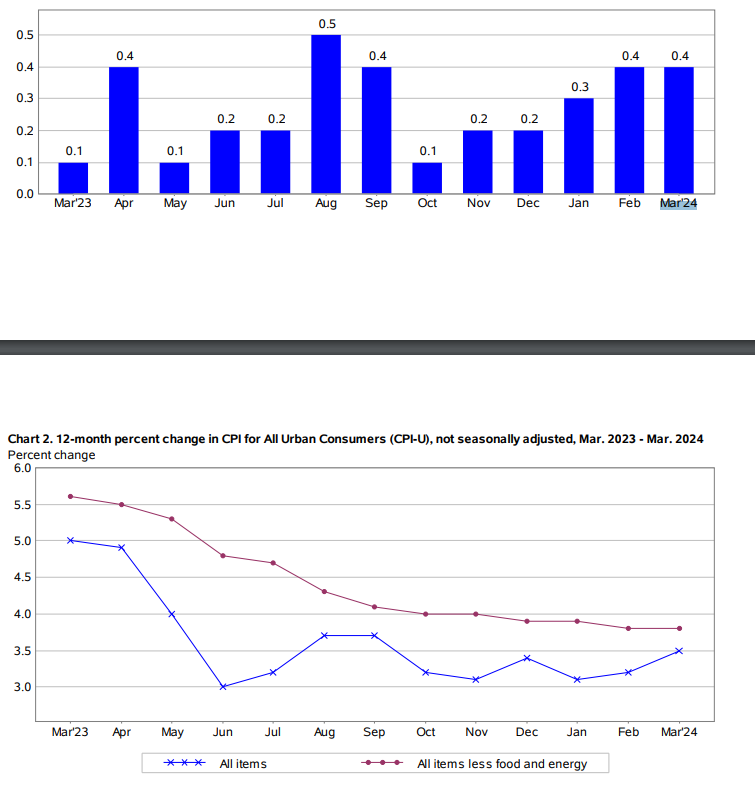
The Consumer Price Index (CPI) report for March 2024 indicates a 0.4 percent increase in the CPI-U, mirroring the growth rate observed in February. This consistency suggests a continued upward trend in consumer prices, potentially signaling inflationary pressures. Over the preceding 12 months, the all items index surged by 3.5 percent before seasonal adjustment, highlighting a sustained period of inflationary momentum.
Within the CPI-U, the surge in the shelter and gasoline indices played pivotal roles in driving the overall increase. These two components collectively contributed over half of the monthly rise in the index for all items. The shelter index, which encompasses housing-related expenses such as rent and owners' equivalent rent, experienced a notable uptick, reflecting the broader trend of rising housing costs across the nation. Similarly, the gasoline index saw a significant increase, likely influenced by external factors such as geopolitical tensions and supply chain disruptions impacting global oil markets.
Source: bls.gov
Energy Index:
The energy index experienced a notable increase of 1.1 percent in March 2024, following February's 2.3 percent upsurge. This upward trajectory was primarily driven by a 1.7 percent increase in the gasoline index, reflecting the broader trend of rising fuel costs. While the surge in gasoline prices could be attributed to various factors such as geopolitical tensions and supply chain disruptions, it underscores the vulnerability of energy markets to external shocks. Additionally, fluctuations in components such as natural gas and fuel oil highlight the complex interplay of supply and demand dynamics within the energy sector, with implications for both consumers and producers alike.
Food Index:
Despite the modest 0.1 percent increase in the food index for March 2024, specific components within this category exhibited noteworthy fluctuations. While certain grocery store food group indexes witnessed declines, others, such as meats, poultry, fish, and eggs, saw price hikes. Of particular significance was the 4.6 percent surge in the egg index, signaling potential supply chain disruptions or shifts in consumer preferences impacting pricing dynamics within this segment. Moreover, the food away from home index rose by 0.3 percent, indicating increased dining-out expenses, which could reflect improving consumer confidence and discretionary spending patterns.
All Items Less Food and Energy:
The index for all items less food and energy surged by 0.4 percent in March 2024, consistent with the trend observed over the past two months. Within this category, the shelter index emerged as a significant contributor to the overall rise, driven by increases in rent and owners' equivalent rent. Other notable increases were observed in motor vehicle insurance, apparel, and medical care, while certain components such as used cars and trucks, recreation, and new vehicles experienced declines. This nuanced pattern of price movements underscores the diverse nature of consumer spending patterns and the underlying factors influencing pricing dynamics across different sectors of the economy.
Producer Price Index (PPI)
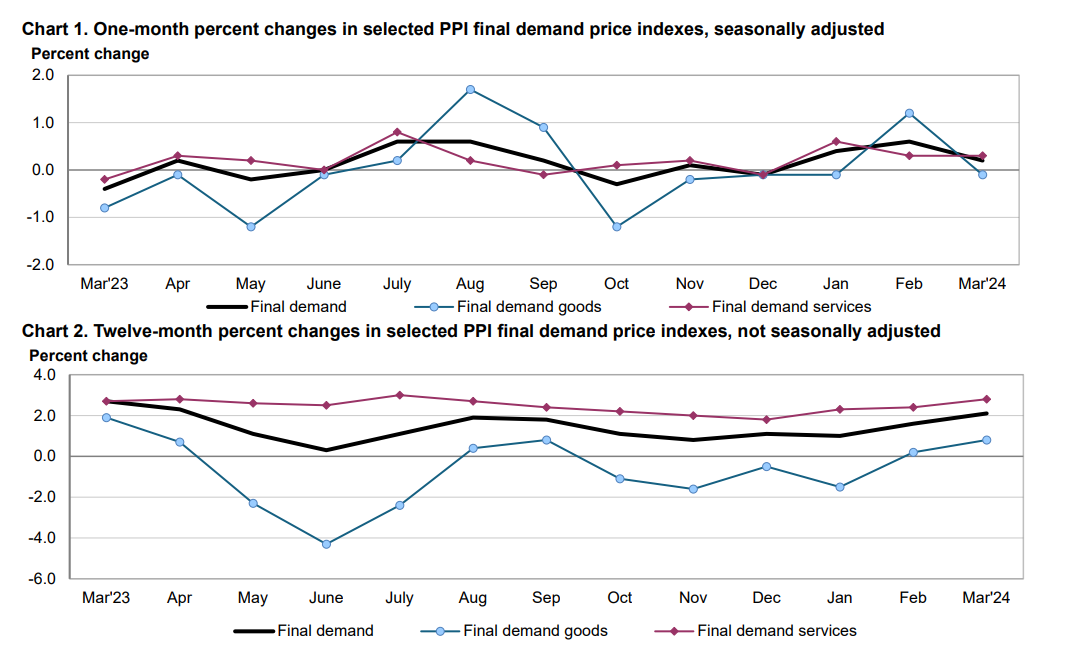
The Producer Price Index (PPI) final demand increased by 0.2 percent in March 2024, driven primarily by a 0.3 percent rise in prices for final demand services. This upward trajectory suggests underlying inflationary pressures within the economy, with implications for both producers and consumers alike.
Source: bls.gov
Service Sector Impact:
Within the final demand services category, securities brokerage, dealing, investment advice, and related services witnessed a notable surge, highlighting the increasing demand for financial services and investment products. Conversely, traveler accommodation services experienced a decline, potentially reflecting ongoing challenges within the hospitality sector stemming from factors such as travel restrictions and changing consumer preferences.
Intermediate Demand
Prices for processed goods declined by 0.5 percent in March 2024, largely influenced by decreases in processed energy goods. This downward trajectory suggests potential challenges within the manufacturing sector, with implications for producers reliant on energy-intensive production processes. However, certain segments such as processed foods and feeds experienced price increases, underscoring the heterogeneous nature of pricing dynamics within this category.
Unprocessed Goods:
The index for unprocessed goods for intermediate demand moved down by 1.9 percent in March 2024, following a 0.7 percent decline in February. This decline can be attributed to a significant drop in prices for unprocessed energy materials, highlighting the volatility inherent in commodity markets. However, the index for unprocessed foodstuffs and feedstuffs advanced, suggesting potential supply constraints or changing demand dynamics within the agricultural sector.
Services:
Prices for services for intermediate demand rose by 0.2 percent in March 2024, driven primarily by a 0.3 percent increase in the index for services less trade, transportation, and warehousing for intermediate demand. This upward trajectory suggests underlying inflationary pressures within the service sector, with implications for a wide range of industries reliant on service inputs.
Impact on Stages of Production Flow
- Prices for stage 4 intermediate demand moved up by 0.2 percent in March 2024, driven primarily by rising service inputs. This upward trajectory suggests increasing costs for producers at the final stages of production, potentially signaling broader inflationary pressures within the economy. However, the impact of rising input costs may vary across different industries, with implications for profit margins and pricing strategies.
- Prices for stage 3 intermediate demand were unchanged in March 2024, following a 1.0 percent increase in February. This stability suggests a potential leveling off of inflationary pressures within the intermediate stages of production. However, the impact of pricing dynamics at this stage may be influenced by a wide range of factors, including input costs, supply chain disruptions, and changes in consumer demand.
- Prices for stage 2 intermediate demand experienced a notable decline of 1.3 percent in March 2024, following a 0.8 percent increase in February. This downward trajectory suggests potential challenges within the manufacturing sector, with implications for producers reliant on intermediate inputs. However, the extent of the decline may be influenced by factors such as changes in commodity prices, input costs, and production capacity utilization rates.
- Prices for stage 1 intermediate demand edged down by 0.1 percent in March 2024, following a 1.0 percent increase in February. This slight decline suggests a potential easing of inflationary pressures at the initial stages of production. However, the impact of pricing dynamics at this stage may be influenced by factors such as changes in commodity prices, input costs, and production capacity utilization rates.
Real Earnings and Employment Situation
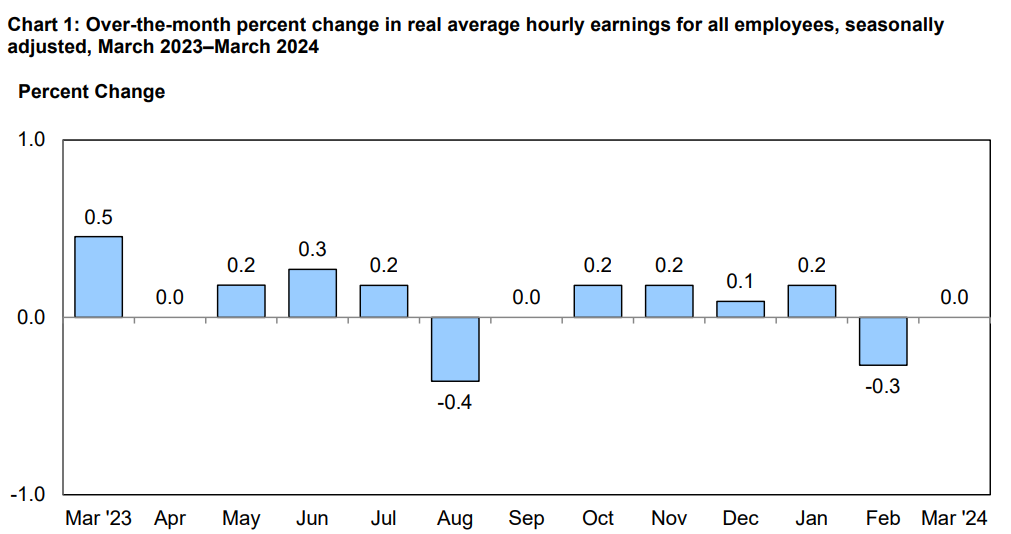
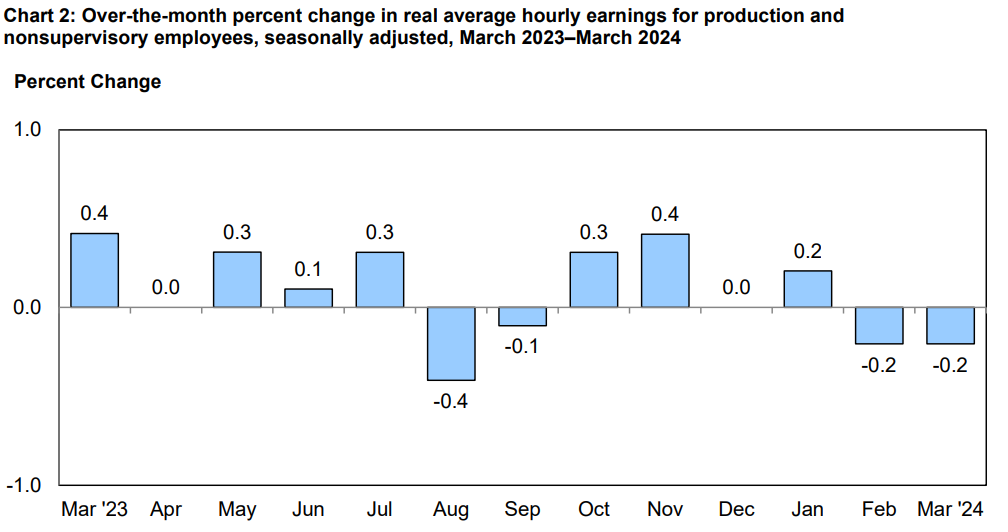
Real average hourly earnings for all employees remained unchanged from February to March, with a 0.6 percent increase from March 2023 to March 2024. This stability suggests a potential leveling off of real wage growth, with implications for consumer purchasing power and discretionary spending patterns. Real average hourly earnings for production and nonsupervisory employees decreased by 0.2 percent from February to March. This decline may reflect underlying challenges within certain sectors of the economy, with implications for household financial stability.
Source: bls.gov
Source: bls.gov
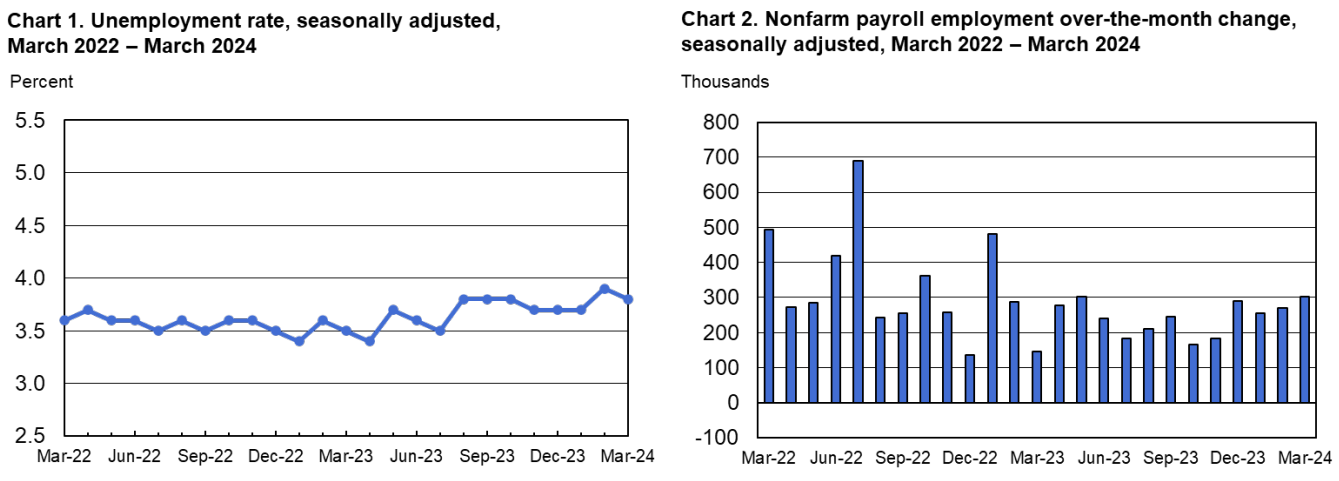
Nonfarm payroll employment increased by 303,000 in March, maintaining the unemployment rate at 3.8 percent. This robust job growth suggests a resilient labor market, with implications for consumer confidence and overall economic activity. Significant job gains were observed in the health care, government, and construction sectors, highlighting the diverse nature of employment opportunities within the economy. However, certain sectors such as leisure and hospitality continue to face challenges stemming from factors such as labor shortages and changing consumer preferences.
Source: bls.gov
Supercore CPI and Fed's Concerns
The Supercore CPI, which excludes housing-related components, provides further insights into inflation dynamics, highlighting the persistence of inflationary pressures in non-housing sectors. The March 2024 CPI report indicates a substantial year-over-year (YoY) rise of 4.8% in the Supercore CPI, driven primarily by transportation services. This suggests that inflationary pressures extend beyond housing-related costs, posing challenges for the Federal Reserve's inflation-targeting framework.
The notable increase in transportation services prices, including car insurance premiums, underscores the resilience of inflationary pressures in essential sectors of the economy. Despite efforts to contain inflation through monetary policy measures, factors such as supply chain disruptions, rising input costs, and changing consumer preferences continue to exert upward pressure on prices, contributing to elevated inflation levels.
The Fed's concerns regarding core services inflation, particularly in transportation and other non-housing sectors, reflect the broader challenges in achieving price stability amidst structural shifts in the economy. The sustained increase in core services inflation, driven by factors like labor shortages, supply chain bottlenecks, and pent-up demand, underscores the need for a proactive approach to inflation management.
While monetary policy tools can influence short-term inflation dynamics, addressing structural imbalances and supply-side constraints requires coordinated efforts across fiscal, monetary, and regulatory policy domains.
Implications for Fed Policy
The persistent inflationary pressures highlighted in the CPI report have significant implications for Federal Reserve policy decisions, shaping expectations regarding future interest rate adjustments and monetary policy stance. The divergence between market expectations for rate cuts and the Fed's cautious approach underscores the challenges in achieving price stability while supporting economic growth.
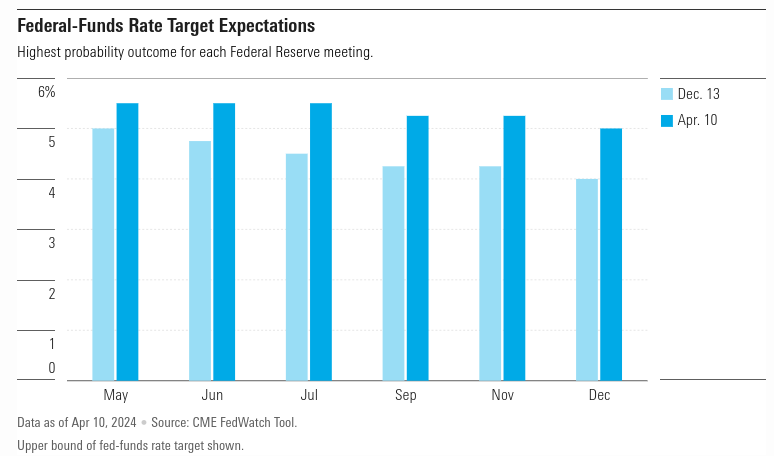
The recent CPI data, indicating sustained inflationary pressures, has led to a reassessment of market expectations, with bond traders now anticipating the first rate cut in September. This shift reflects concerns about the Fed's ability to achieve its inflation target amidst ongoing price pressures, necessitating a recalibration of monetary policy tools to address emerging challenges.
Source: morningstar.com
Additionally, the reduced expectations for the number of rate cuts in 2024 suggest a more cautious approach by the Fed in responding to inflation dynamics.
The Federal Reserve's response to inflation dynamics and its implications for the economic outlook play a crucial role in shaping market expectations and investor sentiment. Fed Chair Jerome Powell's remarks on inflation moving towards 2% on a "bumpy path" reflect the challenges posed by persistent inflationary pressures and the uncertainties surrounding the economic outlook.
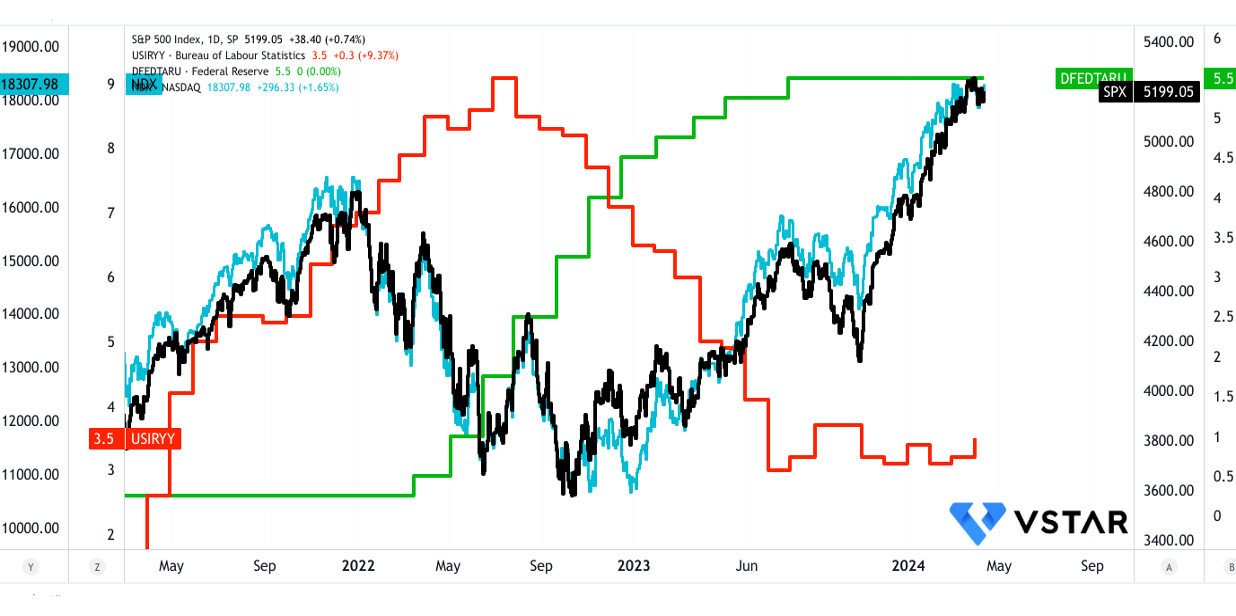
Impact on S&P 500 and Nasdaq 100
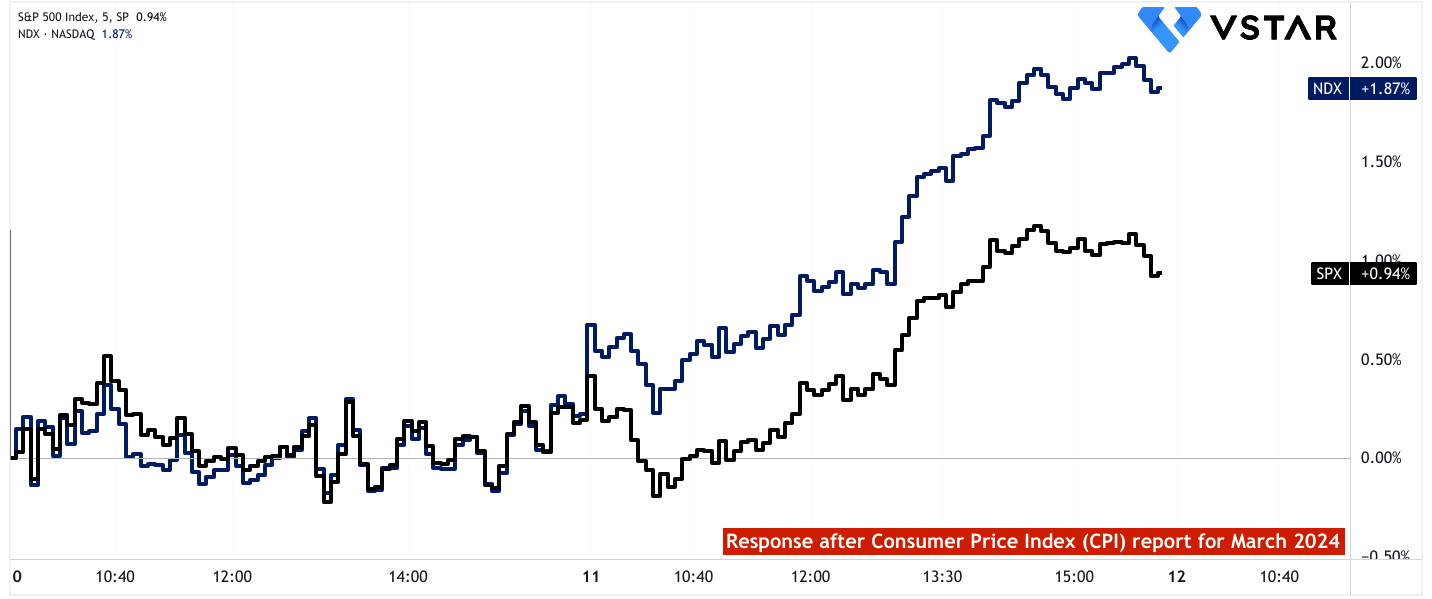
Both indices are sensitive to interest rate changes and inflation expectations. Concerns about the Fed's ability to achieve its inflation target and uncertainties regarding future rate cuts and monetary policy decisions could lead to increased volatility in the equity markets. However, the market response was positive, and both indexes delivered positive returns over 10–11 April.
The S&P 500's composition across various sectors means it is influenced by sectoral performance trends. For instance, increases in housing-related costs and transportation services, as indicated by the CPI and PPI data, can affect sectors like consumer discretionary (e.g., homebuilders, auto manufacturers) and transportation (e.g., airlines, logistics companies) within the index. Similarly, challenges in sectors such as leisure and hospitality may impact companies within the consumer discretionary sector.
Persistent inflationary pressures and uncertainties surrounding monetary policy can affect companies differently within the S&P 500. Rising inflation may lead to higher input costs for companies, potentially squeezing profit margins. Additionally, expectations regarding future interest rate adjustments by the Federal Reserve can impact sectors differently. For example, sectors like utilities and consumer staples, which are typically less sensitive to interest rate changes, may fare better compared to sectors like financials and technology.
The employment situation, particularly job gains or losses in specific sectors, can influence consumer spending patterns and overall economic activity, impacting companies across the S&P 500. Robust job growth, especially in sectors like healthcare and construction, may lead to increased consumer confidence and discretionary spending, benefiting companies in sectors such as consumer discretionary and healthcare within the index.
Source: tradingview.com
The Nasdaq 100's heavy weighting towards the technology sector makes it particularly sensitive to trends within this industry. Factors such as changes in transportation services (e.g., demand for electric vehicles impacting companies like Tesla) and inflationary pressures (e.g., rising input costs for semiconductor manufacturers) can directly impact technology companies within the index.
The Nasdaq 100 is known for its focus on innovation and growth-oriented companies. Therefore, macroeconomic factors that influence innovation and growth, such as changes in consumer preferences (e.g., increased demand for technology products and services) and disruptions in supply chains (e.g., semiconductor shortages affecting tech hardware companies), can have a significant impact on the index.
The Nasdaq 100 is often sensitive to changes in interest rates and monetary policy due to the high concentration of growth stocks within the index. Expectations regarding future interest rate adjustments by the Federal Reserve, influenced by inflationary pressures and economic data, can affect investor sentiment towards growth stocks. A more hawkish stance by the Fed could lead to selling pressure on high valuation stocks within the Nasdaq 100.
In short, rising inflation may push forward any possible rate cuts and may force Fed to bring in more rate hikes into the context. This fluctuating expectations in the market impacting these indexes the most.
Interestingly, right now, the S&P 500's price is around its short-to-long-term forward price-to-earnings ratios. Technically, $5,071.10 to $5,020.85 serve as a critical support zone. Therefore, any drop from the current level serves as an opportunity to establish a long position on the stock. Any further drop, which is less likely, provides an ideal condition to execute dollar-cost average methods on the S&P 500-based holdings. Following the current price swing and projecting the momentum over Fibonacci retracement and extension provides a price target of $5925 by the end of Q2 2024.
However, looking at the relative strength index (RSI) at 78, a price correction can be possible, followed by a sideways price movement. To sum up, there are high probabilities that the S&P 500 may hit the price target.
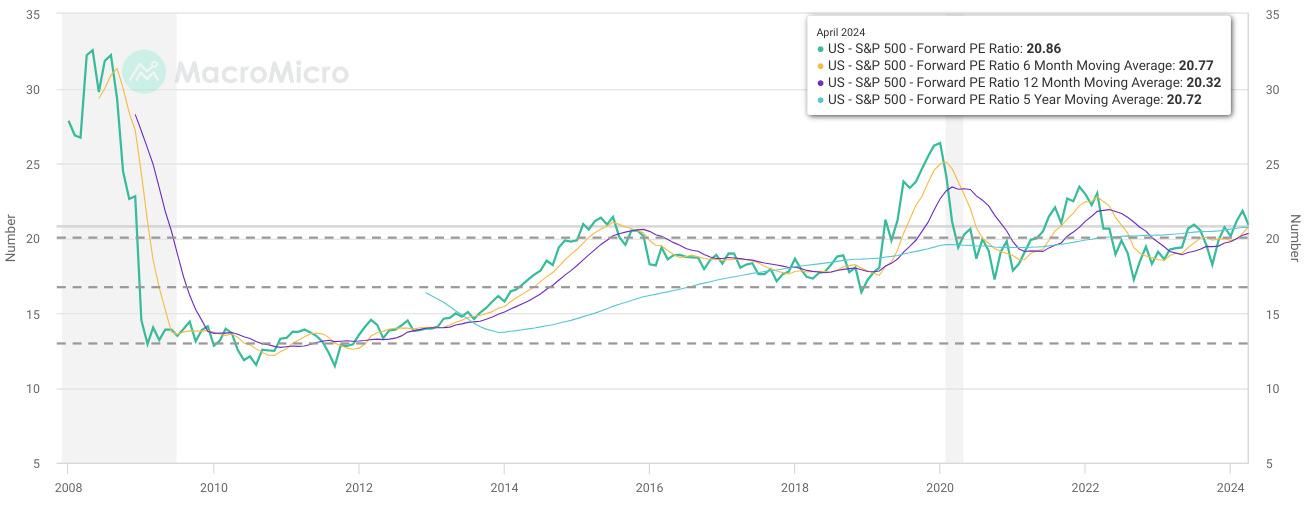
Source: macromicro.me

Source: tradingview.com
In conclusion, the S&P 500's current price dynamics, supported by key technical levels and market momentum, suggest opportunities for strategic investment. Despite inflationary pressures and uncertainties, a bullish outlook prevails, with the potential for achieving the projected price target by Q2 2024.


