The Stellar blockchain is among the numerous networks responsible for storing and transferring cryptocurrencies. Projects like Bitcoin and Ethereum have received exceptional attention and mainstream adoption in the last decade. However, other networks like the Stellar blockchain have experienced significant growth and user adoption. The native token of the Stellar blockchain is lumens (XLM)
What is Stella (XLM)?
Stellar blockchain is designed to connect people and financial institutions across the world. The aim is to provide a less expensive, more accessible, and easier-to-use global payment network.
Stellar is similar yet quite different from Ripple as they revolutionize the finance industry. Stellar considers itself “finance with a mission” focused on individuals. However, Ripple focuses more on the banking industry.
The network utilizes the Stellar Consensus Protocol (SCP), which provides the structure for verifying transactions. In addition, it provides a method to reach a consensus without depending on a closed system for recording transactions.
How to Trade Stella (XLM)
XLM serves as means of payment for transactions on the Stellar network. In addition, it can serve as an intermediary currency for the swift execution of trades. For example, you need to send a payment in U.S dollars to a recipient in Argentina. Stella converts the payment to XLM, and the recipient can receive it in Argentine pesos in a few seconds. Therefore, XLM is a fast, easy, and convenient way for people to send money across borders.
There are two ways of trading XLM in the crypto market. First, you can buy and sell XLM on exchanges. In this case, you own the XLM coins when you buy them. Therefore, you can hold them until the price significantly rises such that you can make a profit from selling them.
Alternatively, you can trade XLM CFDs. This method does not involve actual ownership of the token. CFDs (Contracts for Difference) are financial instruments, acting as a contract between a broker and investor, involving an exchange of the difference between a trade's opening and closing price.
Choosing a reliable broker is critical to trading XLM CFDs. Vstar is a reliable broker that provides institutional-level trading experience, including the lowest trading cost, which means tight spread and lightning-fast execution.
In addition, Vstar is regulated by CySEC- unregulated brokers often have a high commission, which can erode your profit. More so, Vstar offers a demo account for beginners to practice trading strategies to mitigate loss during actual trading.
Trading Strategies and Techniques for Stellar Lumens (XLM) CFDs
Trading XLM CFDs is a short-term method of trading to make a profit. However, it is not as straightforward as the traditional “buying and selling” of assets. It involves speculating on the rise or fall in the market value of XLM.
Are you interested in exploring the world of trading lumen using CFDs? You must remember that crypto assets like XLM are volatile and involves risks. Therefore, you need to research to identify relevant trading strategies that suit your risk appetite and investment goals.
This guide will focus on trading strategies and techniques for trading XLM CFDs. Let us dive in!
Mean Reversion strategies
Mean reversion strategies work with the theory that prices may return to average levels after an extreme price fluctuation. Traders use these strategies to profit as the price of XLM reverts to the mean value. Although prices may revert to the mean regularly, they do not often stay at that level for a long period.
a. Oversold/ overbought Indicators
When the XLM price diverges strongly from its mean, it will likely revert. We recommend going short when the price is very high but long when XLM’s price is very low.
The first step in using mean reversion strategies is to identify the mean price of XLM. Here are some critical indicators for using this strategy:
- Simple moving average (SMA):
SMA is a commonly used indicator critical to identifying trends as it calculates the average over a period. Therefore, traders can identify potential entry and exit points to maximize profit. There are various options for calculating the price average depending on investment duration. Short-term traders can use shorter periods like 20-day or 50-day SMA. On the other hand, 100-day or 200-day SMA may be better alternatives for long-term traders.
For example, when the price crosses above the SMA, it indicates a potential reversal of the current downtrend, which is a buy signal. However, when the price level is below the SMA, this is a sell signal as it suggests a possible downtrend.
- Moving average convergence divergence (MACD):
The MACD is a technical indicator that uses moving averages to define the momentum and strength of a trend. It is a popular overbought and oversold asset indicator, which uses three moving averages.
When MACD crosses above the signal line, it indicates XLM has been oversold, which is an excellent time to buy. On the other hand, when it drops below the line, it signals an oversold situation, which is a trigger to sell.
- Relative Strength Indicator (RSI)

RSI is an indicator that can identify price peaks and troughs in XLM trading. When the RSI reading is above 70, it indicates XLM has been overbought. Therefore, a price correction, which may lead to a price downtrend, is imminent. Alternatively, when the RSI reading is below 30, it is considered an overbought condition. This indicates that the price of XLM has declined to the point of a potential reversal.
N.B: To minimize risk, you may need to combine these indicators to confirm buy or sell signals.
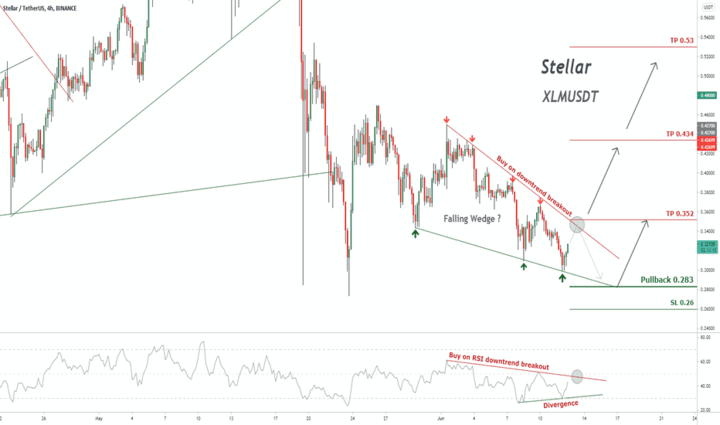
b. Range breakouts
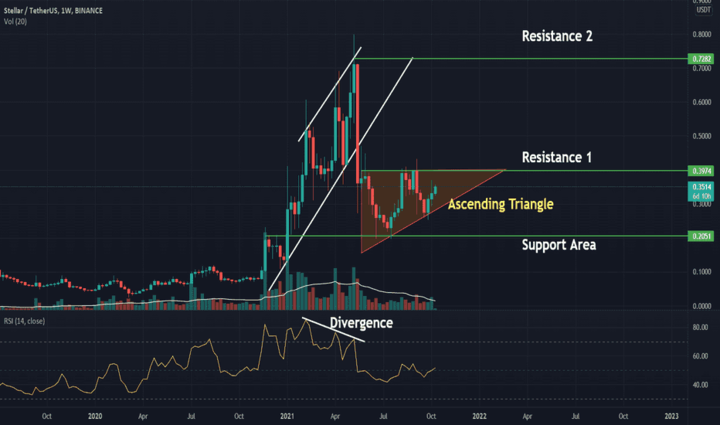
Range breakout trading strategy focuses on identifying price ranges and potential opportunities to enter or exit a trade. Most times, the price of an asset like XLM is within a range. When XLM price breaks out of a range, it indicates a change in market dynamics. Here is how to implement the range breakout strategy
- Identify price ranges and key breakout levels
The first step is to identify price ranges and key breakout levels over a period. Traders can identify these levels using chart patterns, trend lines, and technical indicators. Chart patterns like rectangles, triangles, or horizontal channels may indicate a range and possible breakout. Look out for trend lines that represent support and resistance levels. You can go long on-range resistance breakouts and short on-range support breakouts. Technical indicators like Bollinger bands and the Average True Range can also identify key breakout levels.
- Identify the direction of the breakout
The second step is to determine the likely direction of the breakout. For example, if the price of XLM breaks below the support level, you can predict a price downtrend, which is a signal to sell. Alternatively, suppose XLM’s price breaks above the resistance level; it indicates a potential price uptrend.
- Look for an increase in trading volume
An increase in trading volume can provide confirmation of the momentum and direction of the breakout. Higher trading volume may support the prediction of a breakout because it suggests higher market participation.
c. Spread Trading:
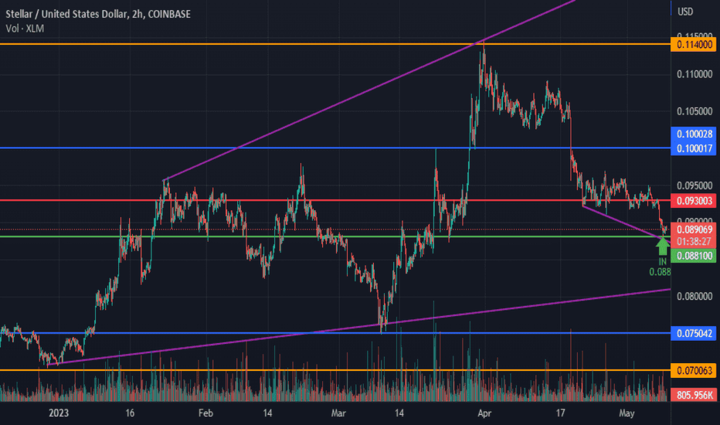
Spread trading is a market strategy that involves entering two market positions- long and short at the same time. The trader aims to profit from the spread- the difference between the two positions and not the market direction.
- Identify spread
The first step to using the spread trading strategy is to identify spreads. Traders can monitor the real-time spot price (current market value) of XLM and the price of XLM CFDs (derivative contract value based on the underlying worth of XLM) offered by brokers.
- Compare XLM spot price to CFD price
Continuous monitoring of the spot and CFD prices are essential to identify spreads. Arbitrage opportunities arise when the XLM spot price diverges from the CFD price. You can go short when the spot price is higher than XLM CFDs. On the other hand, you can go long on XLM CFD trading when the spot price is lower.
- Act fast
When using spreads, it is imperative that you act fast because lots of traders are looking to exploit this arbitrage opportunity. Therefore, as a spread trader, you must act immediately after identifying a spread to avoid missing the opportunity or reduction in potential profit.
- Manage risk associated with volatility
Spread trading provides an exciting opportunity to make a profit but comes with risks. Volatility, a feature of crypto trading, can widen spreads, which increases the potential for slippage. Therefore, it is critical to implement risk management strategies like take-profit orders. Suppose the spread widens against your position; these orders can minimize risks.
In addition, monitoring and adjusting are crucial parts of trading XLM CFDs. Once you execute a trade, continuously monitor XLM CFDs and XLM spot price changes. Any alteration in the spread may indicate to exit your trading position to cut losses or protect profit.
Trend Following Strategies
Trend-following strategies involve making decisions based on the current market trend. For example, when the price goes down, you may go short XLM CFDs, but when the price increases, you may go long. However, it is critical to monitor factors that can influence market trends closely.
The significant feature of trend-following strategies is that they do not aim to forecast but simply follow current market movements.
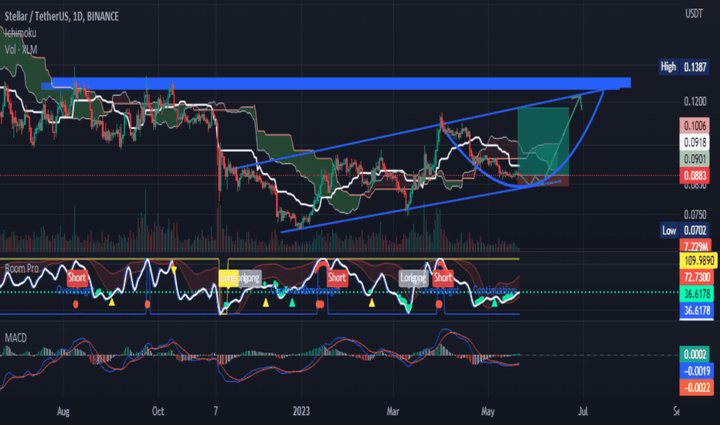
- Trend riding:
The trend-riding strategy for trading XLM CFDs focuses on following the prevailing short-term trends for the chance of strong extended moves. You can identify price trends using moving averages. For example, a trader can utilize the 5-day MA and 20-day MA to determine the current trend. When the 5-day MA crosses above the 20-day MA, it indicates a potential short-term price uptrend. However, if it crosses below the 20-day MA, it suggests a potential price downtrend.
Therefore, you can go long with XLM during a short-term uptrend. This is a good point to enter the market, hoping the price will continue to rise. On the other hand, you can go short when the price of XLM is experiencing a downtrend. This implies closing your current trading position in case the price keeps plummeting.
Look for bounces off the 5-day MA for effective trend riding. Monitoring the interaction between XLM prices and 5-day MA can help you identify buying or selling opportunities. However, it is critical to implement appropriate risk management strategies when executing trend-riding strategies.
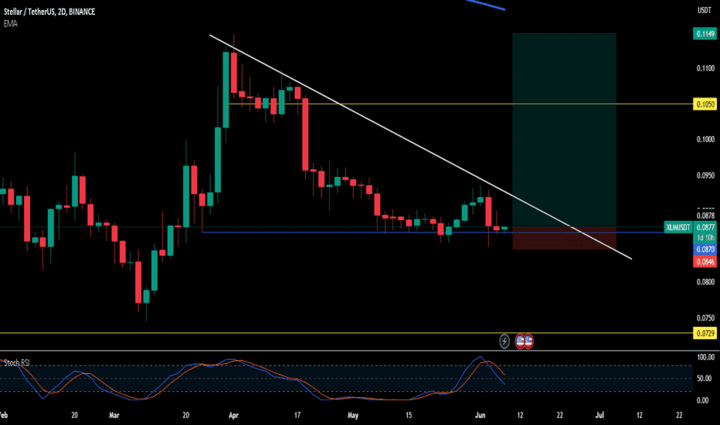
- Breakout trading:
Breakout trading is a form of trend following that involves identifying strong price movements when XLM breaks through support or resistance levels.
You can identify support or resistance levels by analyzing XLM’s price history. These levels are where the price of XLM is anticipated to experience a reversal. Volume analysis and momentum indicators can also be used to confirm the reliability of a breakout. Higher trading volume usually implies increasing positive investors’ sentiments.
Enter a long position when XLM price breaks out of major resistance levels. This indicates a potential for XLM market value to increase. On the other hand, enter a short position when it breaks out of main support zones as it suggests a potential price downtrend.
Additionally, monitor the progress of your trade. Suppose the trend continues to favor your position. Adjust your take-profit orders to make maximum profits. Alternatively, be prepared to swiftly exit the trade if the breakout reverses.
N.B: One of the risks of this strategy is a “false” breakout. These breakouts are not sustained, especially during increased market volatility. Therefore, it is critical to use a breakout strategy with continuous market analysis, position sizing, and risk management strategies to increase the chances of a successful trade.
- Use stop losses at all times due to high volatility
Trading XLM CFDs is associated with high volatility. Therefore, risk management strategies like stop-loss orders are crucial. The stop-loss order allows you to set a pre-defined exit point for your position. This is especially useful when the market is moving against you; thereby setting you up for amplified losses.
In addition, stop-loss orders ensure that you define and control risk exposure on a trade. They also help you avoid making hasty decisions that may be fuelled by fear, greed, or misplaced optimism.
Additional Strategies
Here are some additional strategies for trading XLM CFDs:
- Hedging:
When in doubt, hedge your positions by going long and short concurrently to reduce risk. Hedging is a risk management strategy that involves opening new positions to protect existing positions from market volatility.
This strategy is especially useful to short-term and medium-term traders to protect their profit from unfavorable price movements. Hedging is critical to minimize loss, especially when the market is moving against your trades.
Unwind positions as market bias becomes clear. For example, if you are uncertain about the future direction of XLM’s price. Hedging may be a useful strategy to manage risks associated with XLM CFD trading. Therefore, traders must closely monitor the market to swiftly close trades when the trend is against them. On the other hand, they can maintain a position that aligns with the market bias.
- Leverage trading:
Leverage trading is a strategy that allows traders to amplify their position with borrowed funds. XLM is known for its high volatility, meaning there could be significant price movement within a short period. This method is an exciting option for short-term traders because they can easily capitalize on these large price movements.
Leverage is also the ratio of borrowed funds to the trader’s capital. For example, using a leverage of 20: 1 means the trader can control a position twenty times their capital. The profit or loss is calculated based on the total value of the position and not the initial deposit. Therefore, leverage trading can amplify profit or losses.
It is critical for traders to use leverage judiciously, especially when trading XLM CFDs. In addition, choose your trading leverage based on experience and risk tolerance. Using bigger leverage can translate to bigger losses if the market moves against your trading position.
- Algorithmic trading:
Algorithmic trading involves using codes and software to open and close trades based on pre-defined rules. It involves designing trading algorithms for trading XLM CFDs, which can make automated trading decisions based on pre-defined parameters.
These algorithms are designed based on technical indicators and statistically backed patterns. The algorithm for trading XLM CFDs uses a wide range of fundamental and technical indicators, such as moving averages and momentum indicators, and monitoring relevant news and market sentiments. These indicators are crucial to identifying potential entry and exit points based on analysis.
Algorithmic trading can fine-tune your risk management strategies by using codes to execute stops automatically. This strategy is low maintenance because once the code is running, your trades are automatically executed. The algorithms can monitor trends and market conditions and make trading decisions without manual instructions. This automation minimizes the risk of “emotional trading” and allows for prompt execution of trades.
Stringent risk controls are required for algorithm trading. The importance of risk management strategies like take profit order, position sizing, and stop-loss order within the algorithm cannot be over-emphasized.
Since algorithmic trading runs on codes, it is necessary to conduct a backtest before using it for real-life trading. Backtesting is a way to evaluate the performance of the code you intend to use in executing your XLM CFD trades. However, it is important to note that algorithmic trading often involves advanced programming skills and expertise in statistical analysis.


Conclusion
Trading XLM CFDs offers an exciting opportunity for profit. However, you need quality trading strategies to minimize risk and protect profit. This guide has explored mean reversion strategies, trend-following strategies, algorithmic trading, leverage trading, and hedging for trading XLM CFDs.
While understanding these strategies is of great significance, so is choosing a reputable broker. Before choosing the best broker for you, compare the reputation, regulations, interface, trading fees, and customer support. These factors could have a significant impact on your trading outcomes.
Congratulations as you begin your XLM CFD trades with us! We are always cheering for you!