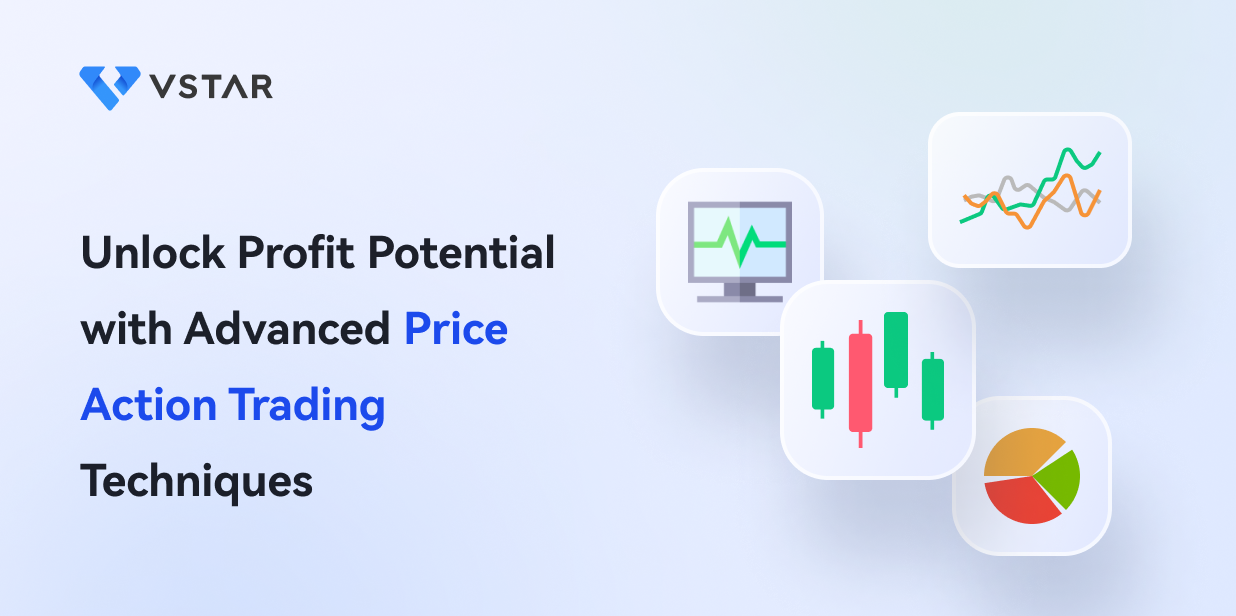
Are you interested in trading Contracts for Difference (CFDs)? Then you may have heard of price action trading. Price action trading is a method of analyzing market movements by looking at the price movements themselves rather than relying on indicators or other technical analysis tools. This approach can be especially useful in CFD trading, where market movements can be volatile and unpredictable.
By focusing on price action, traders can identify key support and resistance levels, trend lines, and candlestick patterns. These concepts are essential to understanding price action trading and can help traders make more informed decisions about when to enter or exit a trade.
If you're interested in trading Contracts for Difference (CFD), then you should consider using price action trading strategies. Price action trading involves analyzing a security's price movement to identify profitable trading opportunities. So having the knowledge of key concepts such as support and resistance levels, trend lines, and candlestick patterns, you can gain valuable insights into a security's behavior and make better trading decisions.
Understanding the CFD Market
Understanding the CFD market is crucial when trading with price action. It is essential to understand the market composition and factors that can impact the price of CFDs to make informed trading decisions. Incorporating price action strategies into your trading plan can help you identify potential opportunities and increase your chances of success.
CFD (contract for difference) trading is a popular form of trading where traders speculate on the rise or fall of an asset without owning the underlying asset. This type of trading allows you to take advantage of rising and falling markets, giving you more opportunities to profit.
The CFD market consists of different participants, such as traders, brokers, and liquidity providers. These participants have different roles and interact with each other to facilitate trading. The factors that affect CFD prices include global events, economic news, and market sentiment, among others. It is essential to keep track of these factors as they can influence the direction of the price movement.
Price action trading is a strategy that involves analyzing the movement of prices on a chart to make trading decisions. This strategy uses key indicators such as support and resistance levels, trend lines, and candlestick patterns to identify potential trading opportunities. By analyzing price action, traders can gain insight into market sentiment and decide when to buy or sell CFDs.
Key Price Action Indicators and Techniques in CFD Trading
There are several key indicators, strategies, and setups you should be aware of. Price action trading is a popular approach that involves analyzing an asset's price movement on a chart without relying on indicators or other external factors. However, many traders use a variety of key price action indicators and techniques. Here are some of the most commonly used:
1. Moving Averages: Moving averages are used to smooth out price data over a specified period of time, making it easier to identify trends in the market. Commonly used moving averages include the simple moving average (SMA) and the exponential moving average (EMA).
2. Relative Strength Index (RSI): The RSI is a momentum indicator that measures the strength of a trend by comparing the average gains and losses of an asset over a specified period of time. Traders typically use the RSI to identify overbought and oversold conditions in the market.
3. Bollinger Bands: Bollinger Bands are a volatility indicator that uses moving averages to create upper and lower bands around the price of an asset. Traders use Bollinger Bands to identify potential breakouts and to determine if an asset is overbought or oversold.
4. Support and Resistance Levels: Support and resistance levels are key price levels that traders use to identify potential entry and exit points for their trades. Support levels are price levels where buyers are likely to step in and support the price of an asset, while resistance levels are price levels where sellers are likely to step in and push the price lower.
5. Candlestick Patterns: Candlestick patterns are used to identify potential reversals in the market by analyzing the price action of an asset over a specified period of time. Common candlestick patterns include the doji, hammer, and shooting star.
Support and resistance levels are important concepts to understand in price action trading. The interaction of supply and demand creates these levels and can be identified on a chart as areas where the price has historically struggled to move past.
By trading around these levels, you can potentially profit from the market's tendency to respect them.
Another useful tool in price action trading is trend lines. By drawing lines on a chart to connect key price points, you can identify the market's overall direction and make trading decisions accordingly.
In addition to trend lines, you should also be familiar with common candlestick patterns, such as the doji, hammer, and engulfing pattern, which can provide signals to enter or exit trades.
Price action traders often use a variety of price patterns to identify potential trade setups. These patterns can include flags and pennants, which indicate a continuation of the current trend, and exhaustion and reversal patterns, which may signal a potential trend reversal.
Price Action Strategies in CFD Trading


To succeed in CFD trading, you must understand how to use price action strategies to make informed trading decisions. We'll cover some key price action strategies for CFD trading. In CFD trading, price action strategies can be used to identify potential breakouts, trends, and counter-trends and employ risk management techniques to minimize losses.
Breakout Trading is a popular price action strategy that involves identifying key levels of support and resistance on the price chart. Once you've identified these levels, you can wait for the price to break through them and enter a trade toward the breakout.
This strategy can be effective in volatile markets where price movements can be sudden and significant.
Trend Following is another popular price action strategy that involves identifying trends in the market and trading in the direction of the trend. This strategy requires you to identify key support and resistance levels on the price chart and use them to confirm the trend direction.
Once you've identified the trend, you can enter a trade and ride the trend until it starts to reverse.
Counter-Trend Trading is a price action strategy that involves trading against the trend. This strategy can be risky, as it involves trying to catch a reversal in the market. To use this strategy successfully, you need to identify key support and resistance levels on the price chart and look for signs of a potential reversal, such as a double top or bottom formation. You can then enter a trade opposite to the trend and set tight stop-loss orders to manage risk.
Price Action Trading Setups
One key aspect of price action trading is identifying and trading various setups, including the pin bar, inside bar, and engulfing bar setups. These setups can provide traders with clear entry and exit points and potential stop loss and take profit levels.
For example, the pin bar setup involves identifying a candlestick pattern where the price has sharply reversed, leaving a long tail or "wick" on one side of the candle. This can indicate a potential reversal in market sentiment, and a trader can enter a long or short position accordingly.
Similarly, the inside bar setup involves identifying a candlestick pattern where the high and low of the candle are contained within the previous candle's range. This can indicate a period of consolidation in the market, and a trader can enter a position in anticipation of a potential breakout in either direction.
To illustrate how price action can be applied in CFD trading, consider the XAU/USD pair. Let's say that you have identified a pin bar setup on the daily chart, with a long tail on the bottom indicating a potential bullish reversal. You could enter a long position at the close of the candle, with a stop loss below the low of the pin bar and a take profit at a nearby resistance level.
Using these price action setups in your trading strategy, you can better identify potential trading opportunities and manage your risk more effectively.
Risk Management in Price Action CFD Trading
When trading CFDs with price action, it is important to have a solid understanding of risk management. You can limit potential losses and maximize profits by implementing risk management techniques.
Risk management in price action trading involves using various tools and strategies to protect your capital. The stop-loss order is one of the most popular tools used in CFD trading. This allows you to set a predetermined level at which your trade will automatically close if the price moves against you. This can help limit potential losses and give you peace of mind while trading.
Another tool that can be used in CFD trading is the take-profit order. This allows you to set a predetermined level at which your trade will automatically close if the price moves in your favor. This can help you lock in profits and avoid potential losses if the market suddenly turns against you.
Position sizing and risk-reward ratios can also be used to manage risk in CFD trading. Position sizing involves calculating the optimal amount of capital to risk on each trade, based on your account size and risk tolerance. You can minimize potential losses and keep your trading account healthy by risking a small percentage of your account on each trade.
Risk-reward ratios involve setting a minimum ratio of potential profit to potential loss for each trade. For example, you may set a ratio of 2:1, meaning that you aim to make twice as much profit as you are risking in potential loss.
This can help you maintain a positive overall account balance, even if you experience some losing trades. Remember to always trade with discipline and patience and to never risk more than you can afford to lose.
Developing a Solid Price Action Trading Plan in CFD
If you want to be successful in trading CFDs with price action, it's important to have a solid trading plan in place. Developing a solid price action trading plan in CFD can take time and effort, but it's worth it in the long run. Here are some steps you can take to create one:
● Determine your trading style and goals: Are you a day trader or a swing trader? What is your profit target? What is your risk tolerance?
● Identify your preferred instruments: Which markets and assets do you want to trade? What are the most suitable CFDs for you?
● Develop a trading strategy: Use price action analysis to develop a trading strategy that aligns with your trading style and goals. Incorporate key indicators and setups that have proven to be successful in the past.
● Create a trading journal: Record your trades in a trading journal to track your performance, monitor your behavior, and identify areas for improvement. This will help you adjust your trading plan accordingly.
● Stay up-to-date with market news and events: Keep track of market news and events that can affect the price movement of CFDs.
Stick to your trading plan: Once you have a solid trading plan in place, stick to it. Don't let emotions or impulses take over your trading decisions. Remember to review and adjust your plan regularly to ensure it aligns with your goals and market conditions.
By following these steps, you can create a plan that is tailored to your trading style and goals, and that incorporates key indicators, strategies, and setups for success. Remember to stay disciplined, stay informed, and stick to your plan to achieve your trading goals.
Conclusion
Trading CFDs with price action can be profitable if you are willing to invest the time and effort to learn and develop your skills. You can identify potential setups and execute successful trades by analyzing price movements and using key indicators.
Remember, price action trading is not a one-size-fits-all approach and requires careful analysis and interpretation of the market. Therefore, it is important to develop a strong understanding of the CFD market, including its composition and key participants, and the factors that can affect price movement.


