- Despite recent underperformance, Verizon has demonstrated resilience over longer periods, with six-month and year-to-date returns outpacing the S&P 500.
- Strong wireless service revenue growth, driven by strategic pricing actions and expanded subscriber bases, underscores Verizon's competitive position in the market.
- Expansion in adjusted EBITDA and robust cash flow generation highlight Verizon's sharp cost management and financial stability.
- Prepaid subscriber losses and declining business wireline revenue pose challenges, requiring strategic adjustments to regain market share and revenue growth momentum.
Verizon, a lead player in the integrated telecommunications industry. Amidst fluctuating price returns and market dynamics, Verizon exhibits resilience and growth across various fundamental indicators. This article delves into Verizon's recent price performance, fundamental strengths, weaknesses, outlook, valuation metrics, and technical insights. By dissecting these aspects, traders may gain a comprehensive understanding of Verizon's stock price trajectory.
Verizon Stock Price Performance
Verizon (NYSE: VZ) has exhibited mixed price performance across various time frames compared to the S&P 500 index. Over the past week and month, Verizon's price return has underperformed slightly, with decreases of -0.18% and -1.66% respectively, while the S&P 500 saw weekly marginal increase and monthly decline of -3.13%. However, looking at longer periods, Verizon has shown resilience. Over the past six months, Verizon has outperformed the S&P 500, with a total return of 31%, indicating a steadier performance amidst market fluctuations.
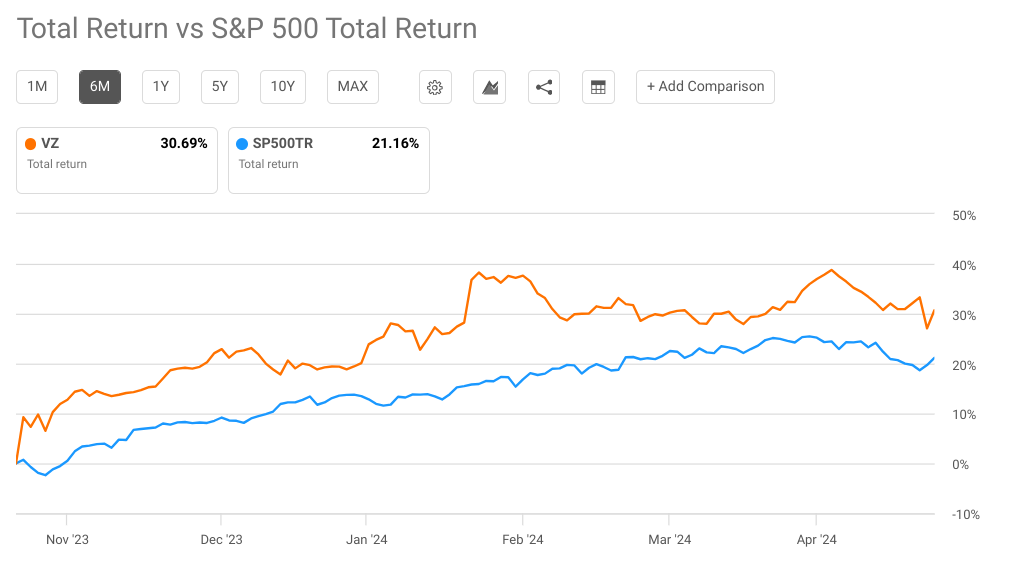
Source:seekingalpha.com
Zooming out to longer-term horizons, Verizon's price return has been less favorable. Over the past three and five years, it has significantly lagged behind the S&P 500, with total returns of -17% and -10% respectively, while the index has posted solid gains of 27% and 88%. Nonetheless, its long-term performance remains challenged, suggesting potential concerns for those seeking capital appreciation.
Verizon Fundamental Strengths
Wireless Service Revenue Growth:
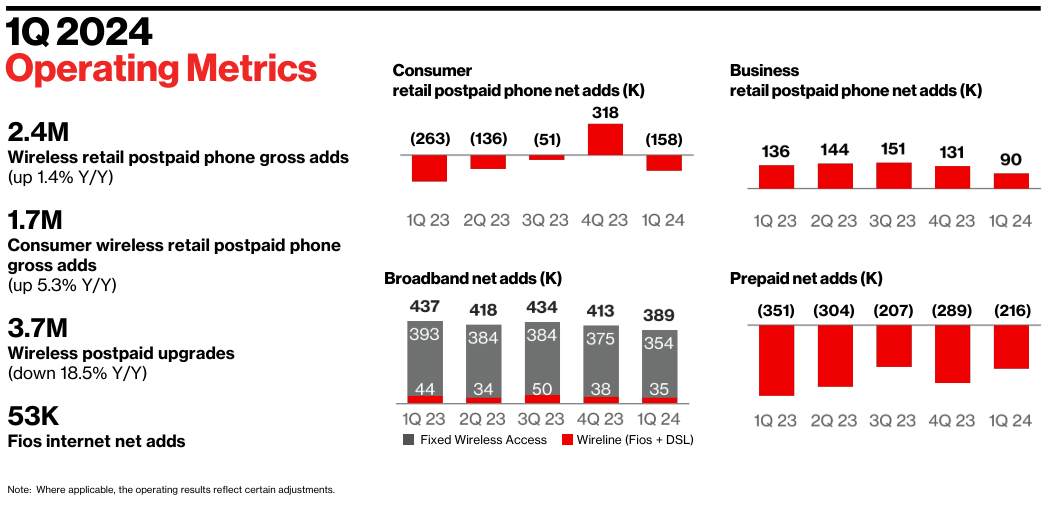
Verizon demonstrated robust growth in Wireless Service revenue, which reached $19.5 billion in the first quarter of 2024, marking a notable 3.3% increase year-over-year. This growth is significant as it indicates Verizon's ability to effectively monetize its wireless offerings and capture market share in a competitive landscape. The increase in Wireless Service revenue was primarily driven by strategic pricing actions implemented in recent quarters, higher adoption of premium price plans, and the expansion of the fixed wireless subscriber base.
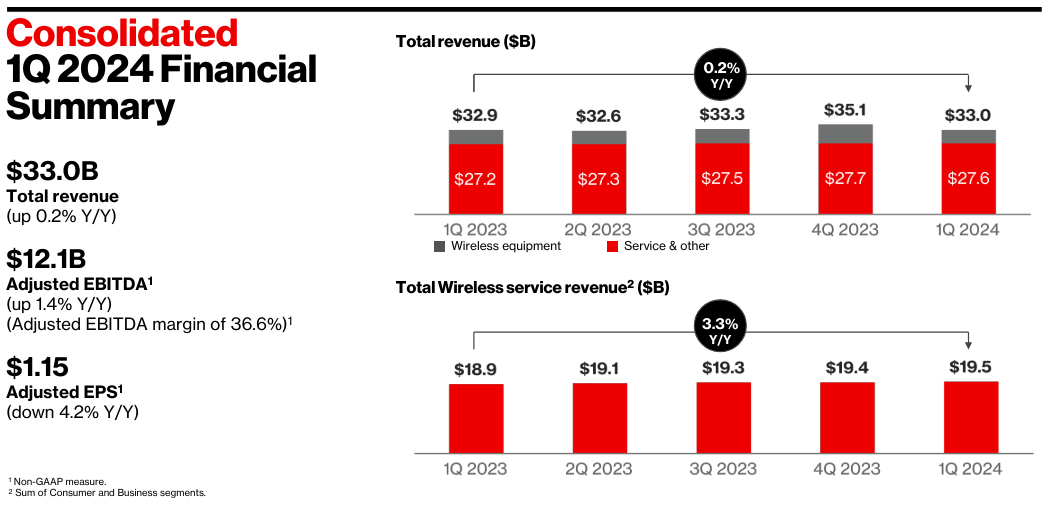
Source: Q1 2024 Earnings
Adjusted EBITDA Expansion:
Verizon reported a year-over-year growth of 1.4% in adjusted EBITDA, reaching $12.1 billion in the first quarter of 2024. This expansion in adjusted EBITDA reflects Verizon's ability to effectively manage operating costs while driving revenue growth, resulting in improved profitability and margin expansion. The company's disciplined approach to cost management and operational efficiency has contributed to the positive trajectory of its EBITDA performance.
Solid Cash Flow:
Verizon exhibited strong cash flow generation in the first quarter of 2024, with free cash flow totaling $2.7 billion, representing a significant increase of over 16% compared to the same period last year. This robust cash flow generation underscores Verizon's ability to convert its operating activities into cash and highlights the financial strength and stability of its business operations.
Broadband Subscriber Growth:
Verizon experienced robust growth in its broadband subscriber base, adding a total of 389,000 net additions in the first quarter of 2024. This growth was driven by both fixed wireless access (FWA) and Fios Internet, indicating strong demand for high-speed internet services among residential and business customers.
The expansion of Verizon's broadband subscriber base is significant as it reflects the company's ability to capture market share in the broadband market and capitalize on the growing demand for reliable and high-speed connectivity solutions. With the increasing reliance on digital technologies and remote work trends, broadband connectivity has become essential for consumers and businesses alike, driving the demand for Verizon's broadband services.
Fixed Wireless Access Revenue Growth:
The fixed wireless access (FWA) segment emerged as a significant revenue contributor for Verizon, with FWA revenue reaching $452 million in the first quarter of 2024. This represented a substantial increase of nearly $200 million compared to the prior year period, underscoring the rapid growth and adoption of FWA services among residential and business customers.
The strong growth in FWA revenue reflects Verizon's successful penetration into the fixed broadband market and the increasing preference for wireless-based connectivity solutions. FWA offers an attractive alternative to traditional cable broadband, providing customers with flexibility, reliability, and high-speed internet access without the need for physical infrastructure installations.
Verizon Fundamental Weakness
Prepaid Subscriber Losses:
Verizon's prepaid segment witnessed a substantial net loss of 216,000 wireless retail prepaid subscribers in the first quarter of 2024, excluding the SafeLink Wireless brand. This decline in prepaid subscribers indicates challenges in retaining and attracting prepaid customers, reflecting potential weaknesses in Verizon's prepaid offerings or competitive pressures.
The significant loss of prepaid subscribers suggests that Verizon may be facing difficulties in meeting the needs and expectations of this customer segment. Despite improvements in prepaid performance, as indicated by the reduction in net losses compared to the previous year, the continued decline in prepaid subscribers remains a concern.
Source: Q1 2024 Earnings
Business Wireline Revenue Decline:
Verizon Business experienced a decrease in wireline revenue in the first quarter of 2024, contributing to a 1.6% year-over-year decline in total Verizon Business revenue. This decline in wireline revenue signals challenges or shifts in the business segment's traditional wireline services, potentially due to increased competition or evolving customer preferences towards wireless or alternative technologies.
The decline in wireline revenue underscores the need for Verizon to reassess its business wireline offerings and strategies to adapt to changing market dynamics. Factors contributing to the decline in wireline revenue may include pricing pressures, technological disruptions, or shifts in customer demand towards wireless or cloud-based solutions.
Overall Wireline Segment Performance:
Despite challenges in the wireline segment, Verizon Business experienced a decrease in segment operating income margin and segment EBITDA margin compared to the first quarter of 2023. This decline in profitability metrics suggests inefficiencies or increased costs within the wireline segment, impacting overall profitability and hindering potential growth.
The decline in segment operating income margin and segment EBITDA margin highlights the need for Verizon to improve operational efficiency and cost management within its wireline business. Factors contributing to the decline in profitability metrics may include rising operating expenses, declining revenue per user, or competitive pricing pressures.
High Wireless Retail Postpaid Churn:
While Verizon Consumer reported improvements in wireless retail postpaid phone net losses, the wireless retail postpaid churn rate remained relatively high at 0.83% in the first quarter of 2024. High churn rates indicate challenges in customer retention, potentially due to dissatisfaction with service quality, pricing, or competition from other carriers.
The high wireless retail postpaid churn rate underscores the importance of enhancing customer satisfaction and loyalty to reduce churn and improve long-term revenue stability. Factors contributing to high churn rates may include aggressive promotional offers from competitors, network performance issues, or inadequate customer support experiences.
Verizon Outlook
Consensus EPS and Revenue Estimates:
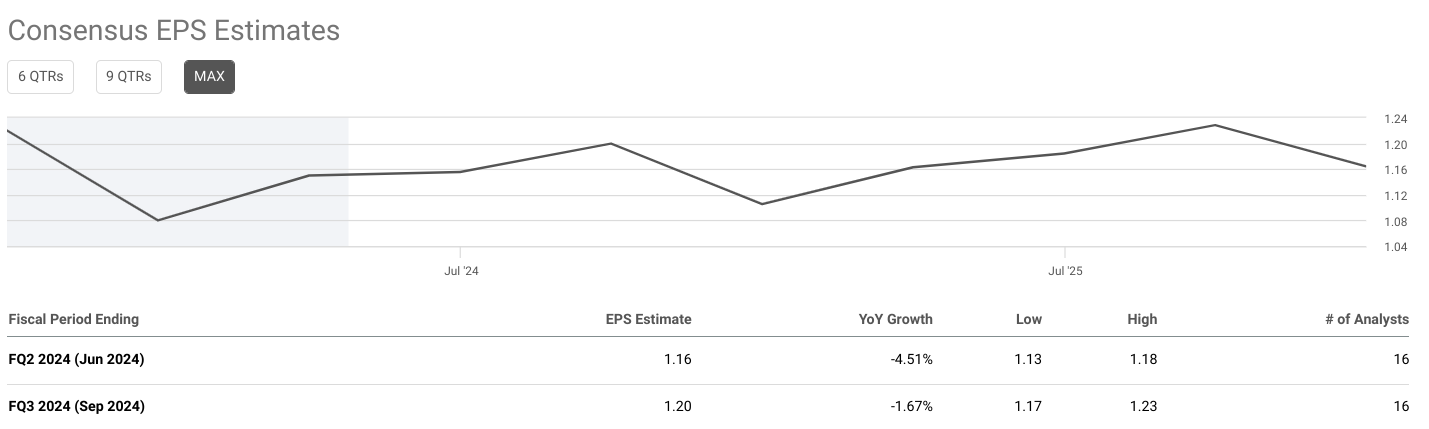
Verizon's earnings per share (EPS) estimates for FQ2 2024 stand at $1.16, reflecting a 4.51% decrease year over year (YoY). For FQ3 2024, EPS is estimated at $1.20, indicating a more moderate 1.67% YoY decrease. Despite the downward trend, these figures align closely with analyst expectations, as evidenced by the stability of consensus estimates over the past month and three months.
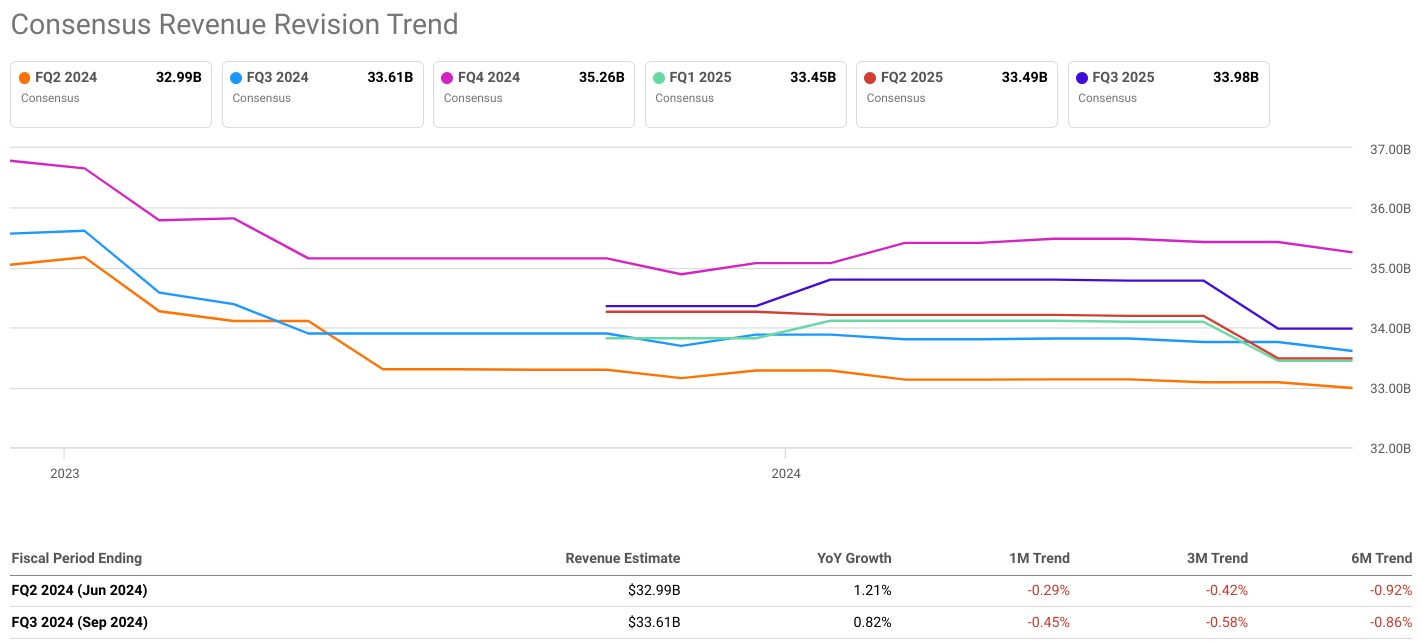
Similarly, revenue estimates for FQ2 2024 and FQ3 2024 indicate modest growth, with estimates of $32.99B and $33.61B, respectively. YoY growth rates stand at 1.21% and 0.82%, indicating a slight deceleration in revenue growth compared to previous periods. However, these estimates fall within the range predicted by analysts, suggesting that Verizon's revenue outlook remains stable.
Source:seekingalpha.com
Consensus EPS and Revenue Revision Trends:
Verizon's EPS and revenue revision trends for both FQ2 2024 and FQ3 2024 indicate mixed sentiments among analysts. While there have been positive revisions in the short term (1-month trend), with EPS and revenue estimates slightly increasing, the longer-term trends (3-month and 6-month) show a more negative outlook, with downward revisions in both EPS and revenue estimates. However, it's noteworthy that the magnitude of these revisions is relatively small, indicating a cautious rather than pessimistic sentiment among analysts.
Source:seekingalpha.com
Internal Estimates and Guidance:
Verizon's internal estimates and guidance for 2024 reaffirm the company's confidence in meeting financial targets despite market challenges. The company expects total wireless service revenue growth of 2.0% to 3.5%, adjusted EBITDA growth of 1.0% to 3.0%, and adjusted EPS in the range of $4.50 to $4.70. Additionally, Verizon anticipates capital expenditures between $17.0 billion and $17.5 billion and an adjusted effective income tax rate of 22.5% to 24.0%. These projections demonstrate Verizon's commitment to maintaining steady growth and financial stability amid industry headwinds.
Industry and Credit Outlook:
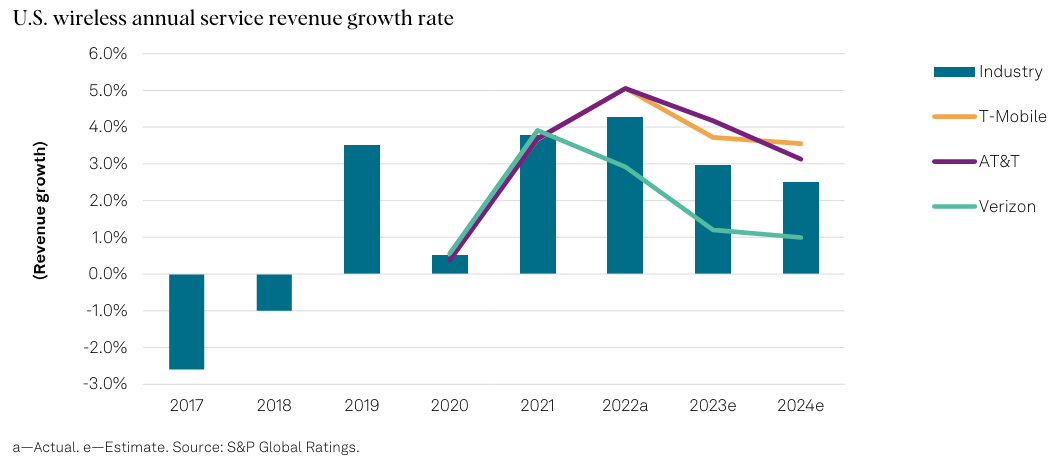
The industry outlook for North American telecoms, as assessed by S&P Global, highlights challenges such as negative rating actions and downgrades outpacing upgrades, primarily due to high interest rates and capital structure concerns. Despite solid industry fundamentals, elevated interest expenses and leveraged capital structures are expected to continue stressing telecom and cable operators in the U.S. and Canada. However, there are expectations of modest service revenue and earnings growth in the wireless market, low-single-digit EBITDA growth for cable, and declining telco capex offset by increased cable investments. These trends indicate a complex operating environment for Verizon, requiring strategic adaptation to navigate effectively.
Source: S&P Global
VZ Stock Valuation
Price-to-Earnings (P/E) Ratio Analysis:
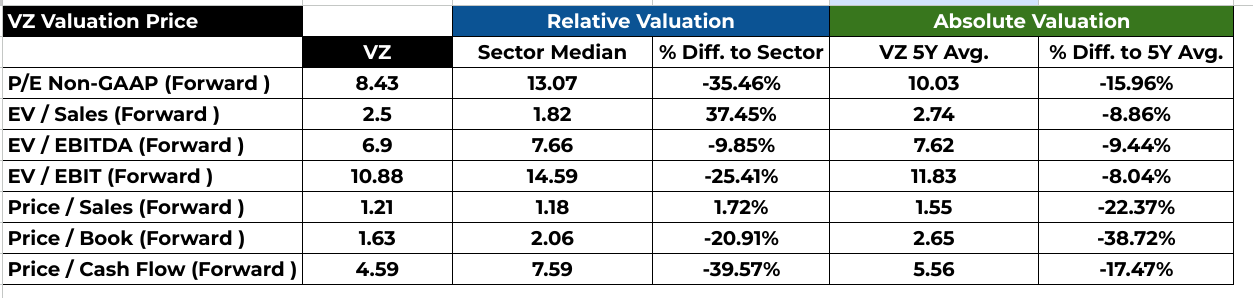
The forward P/E ratio for Verizon stands at 8.43, notably lower than the sector median of 13.07, indicating an undervaluation relative to its peers. Moreover, it's also below its 5-year average of 10.03, suggesting a discounted valuation compared to historical norms. This suggests investors might perceive Verizon as offering better value relative to its earnings potential.
Enterprise Value (EV) Ratios:
When considering EV ratios, Verizon's forward EV/Sales and EV/EBITDA ratios are both higher than the sector median, implying a premium valuation concerning these metrics. However, they are below Verizon's 5-year averages, signaling a potential reversion to a historical mean. The EV/EBIT and Price/Book ratios also exhibit similar trends, with Verizon trading at a discount compared to its sector median but higher than its 5-year averages.
Price-based Ratios:
Verizon's forward Price/Sales ratio is slightly above the sector median, suggesting a modest premium valuation in terms of sales generation capability. However, it's notably lower than Verizon's 5-year average, indicating a potential bargain based on historical sales metrics. The forward Price/Book ratio further reinforces this notion, with Verizon priced lower relative to its sector but significantly discounted concerning its 5-year average.
Price / Cash Flow Analysis:
Verizon's forward Price/Cash Flow ratio is substantially lower than both the sector median and its 5-year average. This suggests that investors might perceive Verizon as undervalued relative to its cash flow generation potential.
Source: Analyst's compilation
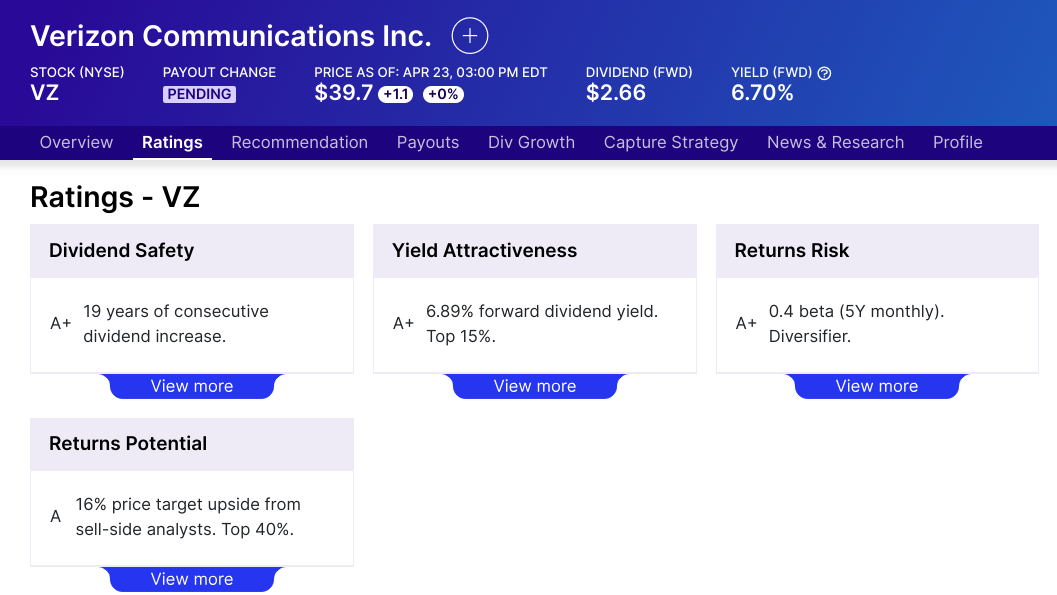
VZ Dividend Dynamics:
With a forward dividend yield of 6.89% and a payout ratio of 56.55%, Verizon offers an attractive dividend profile. The 19-year dividend growth streak underscores its commitment to returning value to shareholders. However, the modest 2% 5-year growth rate might signal a potential slowdown in dividend growth.
Source: dividend.com
VZ Stock Price Analyst Forecasts and Ratings:
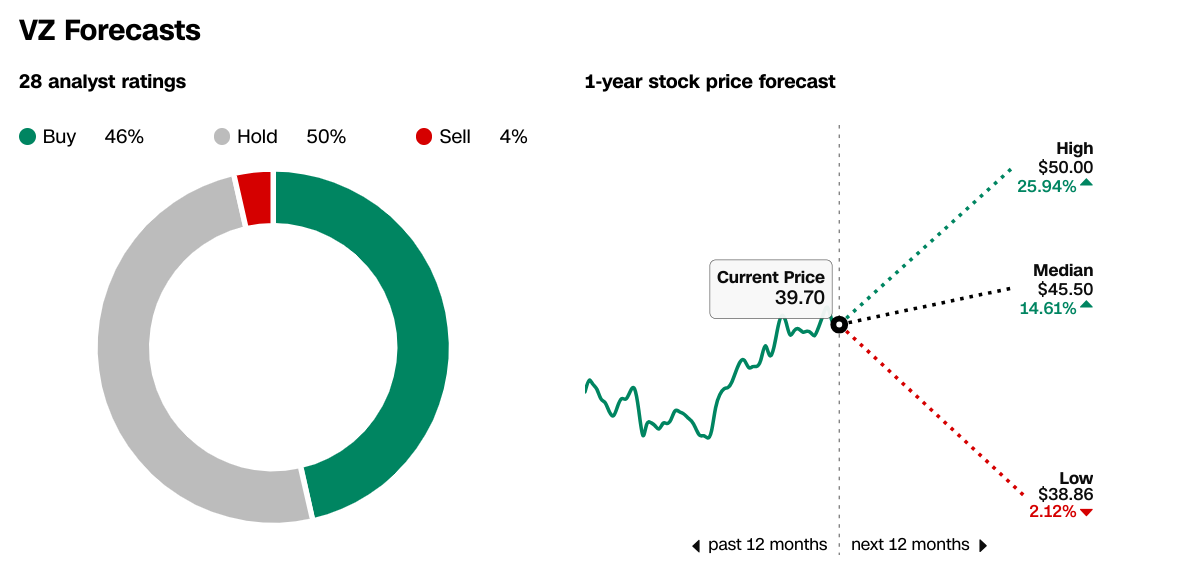
CNN's analyst forecasts offer a spectrum of potential outcomes for Verizon stock price. The median forecast indicates a moderate upside of 14.61%, while the high forecast suggests a more optimistic growth of 25.94%. In contrast, the low forecast presents a conservative estimate of just 2.12% growth. This range underscores the uncertainty surrounding future stock performance, influenced by various market factors.
Source: CNN.com
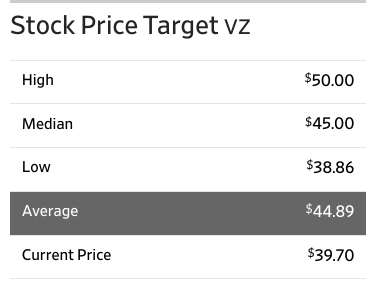
The Wall Street Journal provides additional insight into analyst sentiment regarding Verizon's future performance. The average target price of $44.89 suggests a potential upside. While the high, median, and low forecasts align closely with those of CNN, the average target price offers a consolidated view of analyst expectations. Analyst ratings for Verizon have remained relatively stable over the past three months, reflecting a consistent sentiment among analysts. A majority of analysts recommend Verizon as a hold or buy, indicating cautious optimism regarding the company's prospects.
Source: WSJ.com
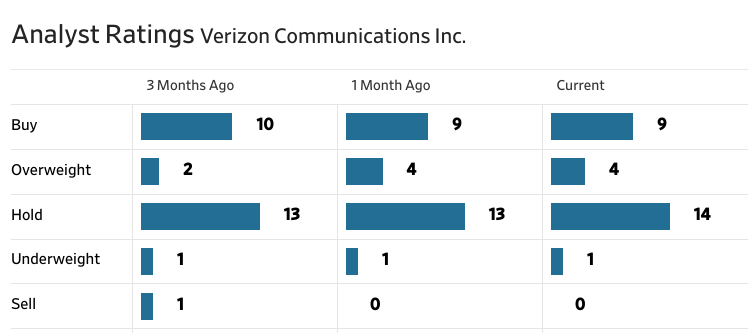
Source: WSJ.com
VZ Stock Forecast 2024
VZ Stock Forecast - Price Targets Analysis
Technical analysis projects an average price target of $48.80 by the end of 2024. This forecast is based on momentum and is derived from change-in-polarity over the mid- to short-term, extrapolated over Fibonacci retracement/extension levels.
The optimistic VZ price target of $54 by 2024 is based on the current swing's price momentum over the mid- to short-term, extended over Fibonacci retracement/extension levels.
Numerically, the difference between the current price and the average price target indicates a potential upside of $9.10 ($48.80 - $39.70), while the optimistic target suggests a potential upside of $14.30 ($54.00 - $39.70).
Verizon Stock Forecast - Trend Analysis
Verizon's (NYSE:VZ) current stock price of $39.70 is slightly above the trendline of $39.53, derived from a modified exponential moving average. This indicates a mild upward trend in VZ stock price. However, the trendline is also close to the baseline of $39.32, another modified exponential moving average, suggesting a relatively stable sideways movement overall. The relationship between the current price and the trendline/baseline highlights a subtle but persistent upward bias. Investors may interpret this as the stock gradually gaining strength but still maintaining a consolidated pattern.
The difference between the current price and the trendline/baseline is small, indicating a tight range within which the stock is trading. This suggests a lack of significant momentum in either direction, emphasizing the sideways movement. The proximity of the trendline and baseline further supports the notion of a consolidation phase. When these moving averages converge closely, it typically indicates a period of equilibrium, where buyers and sellers are in relative balance.
VZ Stock Forecast - Support and Resistance Levels
Verizon's support and resistance levels provide numerical benchmarks for traders to gauge potential price movements. The primary support of $32.50 represents a critical level where buying interest may emerge, while the pivot of the current horizontal price channel at $36.40 suggests a possible reversal point.
The core resistance of $48.85 serves as a significant barrier to upward movement, indicating a level where selling pressure could intensify. The resistance level of $40.35 provides additional insight into potential price barriers, albeit less robust than the core resistance.
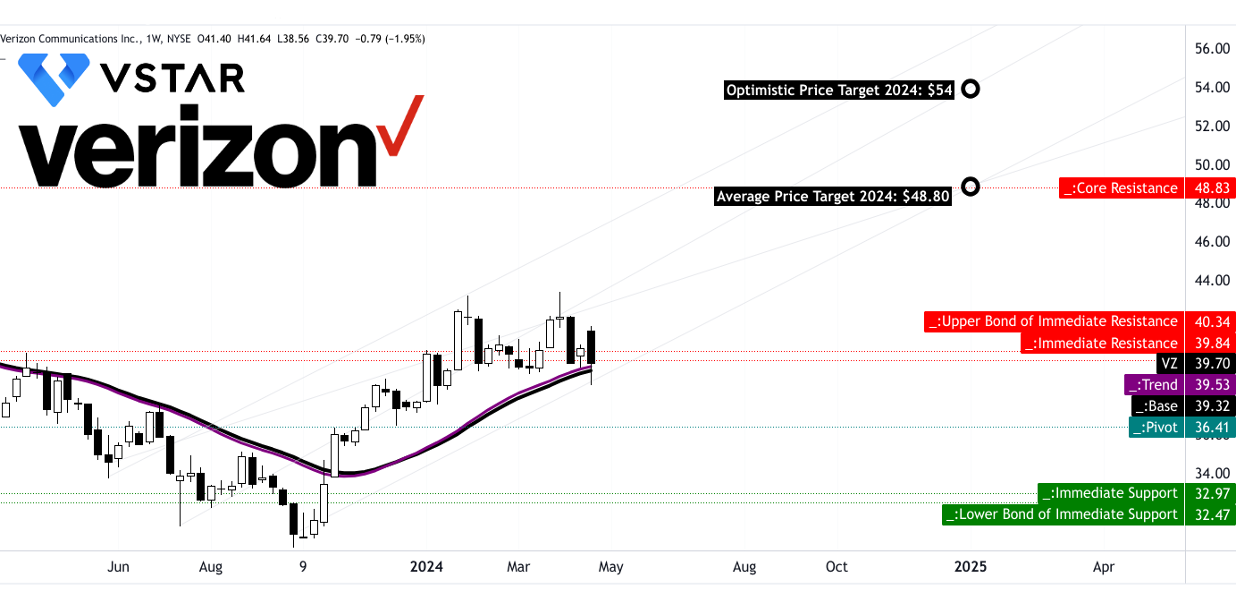
Source: tradingview.com
Verizon Stock Forecast - Relative Strength Index (RSI) Analysis
Verizon's RSI value of 50.11 falls within the neutral zone, indicating a balanced market sentiment. However, it's slightly above the regular bullish level of 29.58, suggesting a potential for bullish momentum to build. Conversely, it's below the regular bearish level of 73.02, indicating a lack of strong bearish sentiment.
The presence of a bearish divergence despite the RSI being in the neutral zone suggests caution. Numerically, the RSI line trend is downward, indicating a weakening bullish momentum. This numerical relationship between the RSI value and its trend provides valuable insight into potential shifts in market sentiment.
VZ Stock Forecast - Moving Average Convergence/Divergence (MACD) Analysis
Verizon's MACD analysis indicates a bearish trend, with the MACD line of 0.9588 below the signal line of 1.04. The negative MACD histogram of -0.085 further confirms the bearish sentiment. Numerically, the increasing strength of the bearish trend suggests that selling pressure may be intensifying.
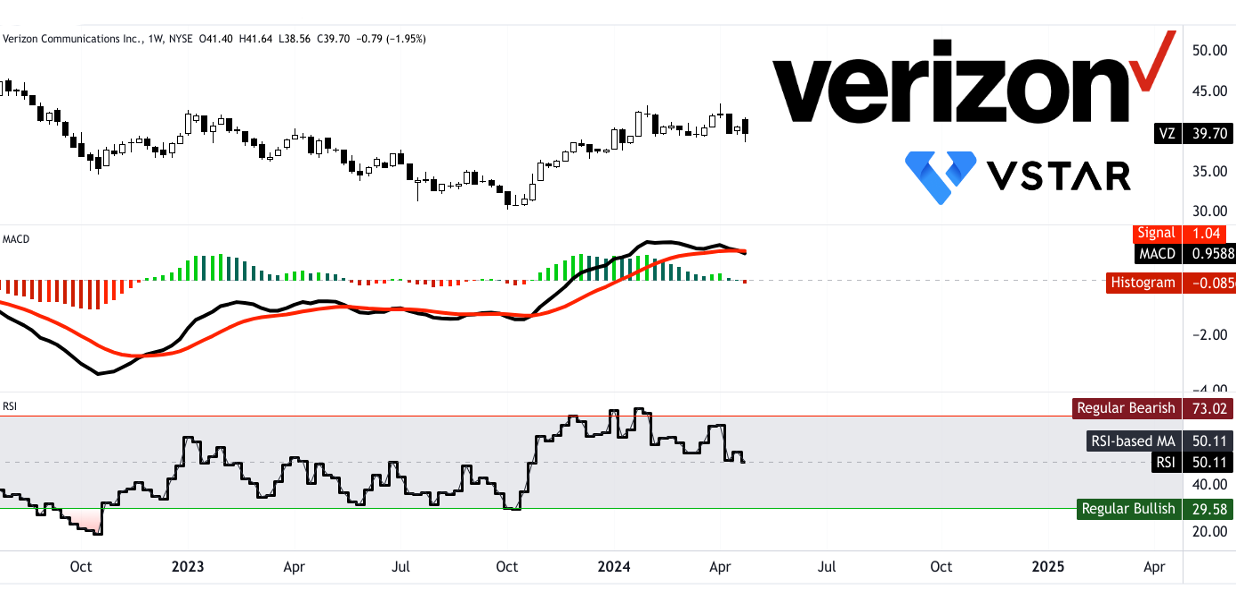
Source: tradingview.com
Conclusion
Verizon's stock price fundamental strengths, like wireless revenue growth and EBITDA expansion, bolster its position. However, challenges persist, notably in prepaid subscribers and declining wireline revenue. Despite these, Verizon's broadband growth and strong cash flow signal potential. Analyst forecasts and technical analysis hint at a cautious optimism, with potential upsides projected.