


Before delving into the current developments, it's vital to establish the context of the relationship between oil and natural gas prices. Traditionally, there has been a strong correlation between these two commodities due to several factors:
- Energy Substitution Effect: Oil and natural gas are often considered substitutes for each other in various applications, particularly in the industrial and transportation sectors. When oil prices rise significantly, users may opt to switch to natural gas, increasing its demand and consequently its price.
- Commodity Market Sentiment: Investors and traders often view oil and natural gas as part of the broader energy complex. Changes in oil prices can influence sentiment across the entire energy sector, impacting both oil and gas prices.
- Production Overlap: Many natural gas reserves are found alongside oil deposits. As a result, changes in oil drilling activity can indirectly affect natural gas production, creating a ripple effect on prices.
- Global Energy Demand: Both oil and natural gas are essential for meeting global energy demands. Therefore, changes in demand for one commodity can influence the other as well.
Price Volatility and Its Effects
Middle East Conflict: The ongoing conflict in the Middle East, particularly the attacks on Israel, has caused significant volatility in oil prices. Crude oil prices surged to $87 from a declining trajectory in response to geopolitical tensions. This rapid and substantial increase in oil prices has immediate repercussions on Natural Gas CFDs. CFDs experienced a rapid enhancement from below $3 to above $3.50.
In 2022, the natural gas spot price at the U.S. benchmark Henry Hub averaged a robust $6.45 per million British thermal units (MMBtu). However, the beginning of 2023 saw a stark reversal, with the Henry Hub price plummeting to an average of just $2.46/MMBtu for the first nine months of the year. This marked a significant decline of nearly $4.00/MMBtu compared to the 2022 annual average.
- Price Correlation: Historically, geopolitical events and oil prices have exhibited a strong positive correlation. As oil prices spike due to geopolitical tensions, they tend to drag natural gas prices higher as well.
- Immediate Impact: The swift surge in oil prices can create a sense of uncertainty and panic in the energy markets, leading to a knee-jerk reaction of higher natural gas prices. Traders should be cautious about the short-term volatility caused by geopolitical events.
- Potential for Prolonged Impact: The duration of the Middle East conflict will be a key determinant of the long-term impact on oil prices and, subsequently, on Natural Gas CFDs. If the conflict persists or escalates, it may lead to sustained high oil prices, which can contribute to elevated natural gas prices.
- Regional Supply Disruption: If the conflict spreads to major oil-producing areas, such as Iran, it could disrupt oil supplies. This scenario could have a cascading effect on natural gas markets, as both commodities are interconnected in global energy supply chains.
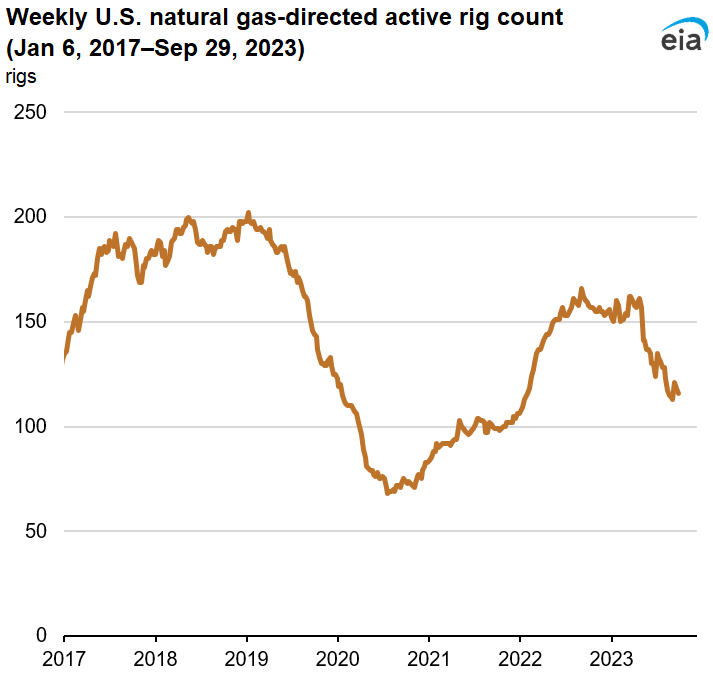
Rig Counts and Drilling Activity
As of September 29, 2023, Baker Hughes reported that the U.S. natural gas-directed rig count had declined by a substantial 26% since the start of the year. The rig count stood at 116 active natural gas-directed rigs, reflecting a reduction of 40 rigs from the beginning of 2023. According to Baker Hughes, the natural gas rig count decreased by 2 from a week ago as of September 26, 2023. The oil-directed rig count also decreased by 5 to 502 rigs during the same period. The total rig count, including miscellaneous rigs, stood at 623 rigs, reflecting a decrease of 142 rigs compared to the previous year at the same time.
Lower natural gas prices throughout 2023 prompted producers to mitigate their costs through strategies such as reducing development expenses and scaling back drilling activities, which include decreasing the number of active drilling rigs deployed. The Permian region is a crucial area for natural gas production in the United States. Producers in this region often respond to changes in crude oil prices when planning their exploration and production activities, which can subsequently affect natural gas drilling.
In 2022, the Permian region accounted for approximately 18% of all U.S. natural gas production. However, this production is closely linked to crude oil production in the area. Despite fluctuations in crude oil prices, the oil-directed rig count in the Permian region declined from 357 rigs in May to 308 rigs on September 29, 2023, indicating that producers in the Permian have taken a cautious approach.
Despite the decline in drilling activity, average daily U.S. production of natural gas in 2023 has been higher than in 2022. U.S. dry natural gas production averaged 103.0 billion cubic feet per day (Bcf/d) in the first seven months of 2023, representing a 3% increase from the 2022 annual average of 99.6 Bcf/d. Increased well-level productivity in the Permian region has been a contributing factor to this boost in production efficiency.
- Price and Rig Count Relationship: Historically, there is an inverse relationship between natural gas prices and rig counts. When prices drop, producers tend to reduce drilling activity to cut costs, which subsequently reduces the supply of natural gas. This reduction in supply can drive prices higher.
- Lag Effect: It's important to note that the impact of rig count changes on natural gas production is not immediate. Producers typically respond to price changes with a lag of four to six months. Therefore, even though rig counts have fallen, it may take time before production levels adjust accordingly.
- Production Efficiency: Despite declining rig counts, U.S. natural gas production has remained relatively stable due to increased well-level productivity. This efficiency in production could mitigate the traditional price increase associated with reduced drilling activity.
Source: eia.gov
LNG Market Dynamics
LNG exports are a critical component of the natural gas market, as they represent an outlet for surplus gas and can influence overall market dynamics. Deliveries to U.S. LNG export terminals increased by 5.0% week over week, indicating growing demand for LNG exports. Maintenance activities at certain LNG terminals, such as the Cove Point LNG terminal in Maryland, can affect LNG supply and prices.
- Impact on Natural Gas Prices: Higher LNG demand can put upward pressure on natural gas prices. As more natural gas is diverted to the LNG export market, domestic supply can tighten, potentially raising prices for consumers and investors in Natural Gas CFDs.
- Infrastructure Investments: The request for approval to return the Freeport LNG export facility to full commercial operations signifies growing confidence in LNG exports. Further investments in LNG infrastructure can sustain LNG demand, influencing natural gas prices.
Supply and Demand Dynamics
The average total supply of natural gas in the U.S. remained relatively stable, averaging 106.0 Bcf/d. This stability reflects minor fluctuations in dry natural gas production and net imports from Canada. Demand for natural gas exhibited variations, with total U.S. consumption falling by 0.9%. However, consumption patterns varied across sectors, with power generation decreasing but industrial and residential/commercial sector consumption showing mixed trends.
- Power Generation Influence: Declining natural gas consumption for power generation may indicate a shift towards alternative energy sources, potentially affecting natural gas prices. Traders should monitor shifts in energy generation trends closely.
- Industrial and Residential Consumption: While power generation has seen a decrease, industrial and residential consumption has increased slightly. These trends can offset some of the downward pressure on natural gas prices.
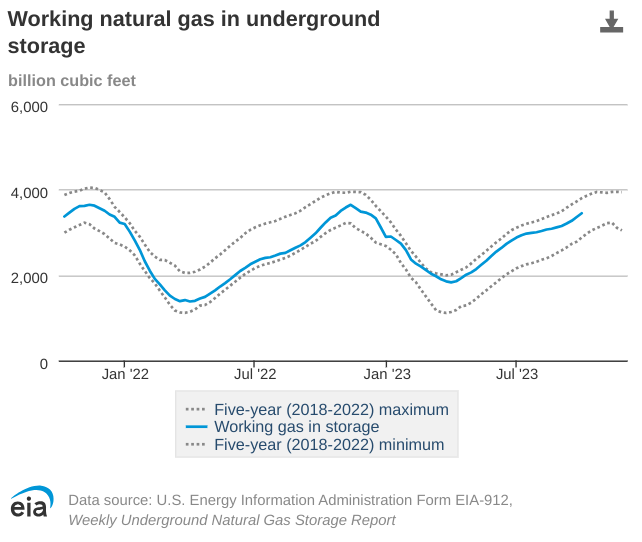
Storage Levels
Net injections into storage for the week ending September 29, 2023, totaled 86 Bcf. This was below both the five-year average and the net injections during the same week in the previous year. Working natural gas stocks totaled 3,445 Bcf, which is 5% more than the five-year average and 12% more than the previous year at the same time.
- Impact on Price: Higher storage levels can ease price volatility during periods of increased demand or supply disruptions. It provides a cushion that prevents extreme price spikes.
- Refill Season Trajectory: The trajectory of injections into storage during the refill season is crucial for understanding future pricing.
- Lower Injection Rate: The average rate of injections into storage is currently 7% lower than the five-year average. If this trend continues, it could indicate a tightening of supply and contribute to upward price pressure.
- Potential Inventory Increase: If injections into storage align with the five-year average for the rest of the refill season, total inventory could surpass the historical average. This scenario could stabilize prices.
Source: eia.gov
In conclusion, the intricate relationship between oil prices and Natural Gas CFDs continues to evolve in response to current developments. Oil price volatility driven by geopolitical tensions, declining rig counts, growing LNG demand, and shifts in supply and demand dynamics are all factors that influence natural gas prices.
Traders and investors must remain vigilant, as these factors interact dynamically to shape the future of Natural Gas CFDs. Geopolitical events, particularly those affecting oil prices, can have an immediate and lasting impact on natural gas prices. However, the resilience of U.S. natural gas production and storage levels provide a counterbalance that can mitigate price fluctuations.
The technical perspective on the weekly moves of CFDs on Natural Gas can be comprehended as follows:
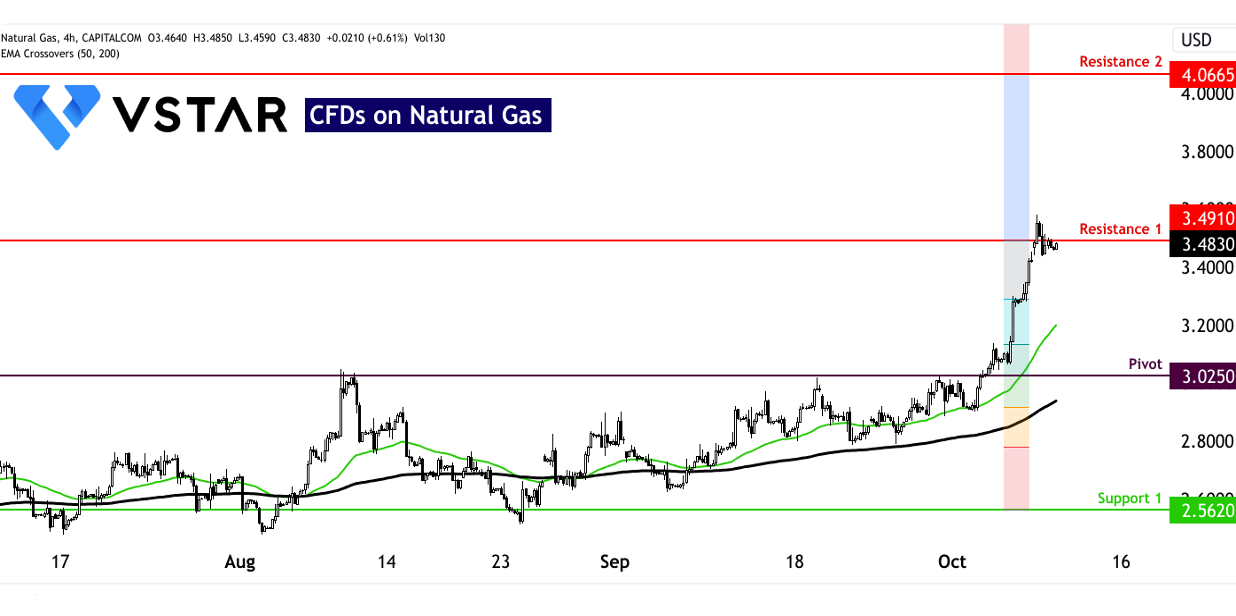
Source: tradingview.com


