


- Wells Fargo showcases resilience, with a 43% total return over the past year, outperforming the S&P 500 and the SPDR S&P Bank ETF.
- Noninterest income growth, cost management, and strong capital and liquidity positions underscore Wells Fargo's adaptability and growth potential.
- Challenges arise in declining net interest income, decreasing average loans and deposits, rising noninterest expenses, and credit quality concerns.
- While revenue estimates depict a mixed outlook, technical analysis indicates a bullish sentiment, albeit with caution warranted regarding potential overbought conditions and weakening bullish momentum.
Wells Fargo & Co (NYSE: WFC) holds the fundamentals of resilience and adaptation. Amidst market fluctuations and regulatory scrutiny, it has exhibited robust price performance and fundamental strengths across diverse segments. Opportunities abound in its noninterest income growth, cost management, and capital positions. However, challenges loom, particularly in net interest income decline and rising noninterest expenses. Delve deeper into Wells Fargo's trajectory, exploring valuation metrics, revenue outlooks, and technical trends, to discern the path forward amidst a complex financial ecosystem.
WFC Stock Price Performance
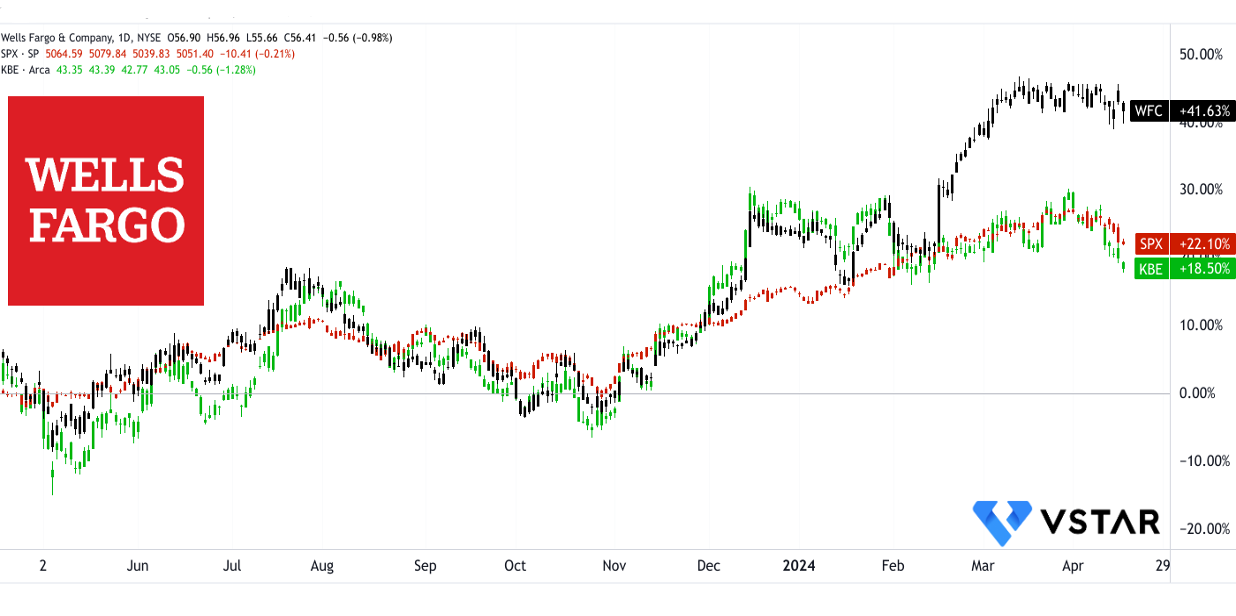
Wells Fargo & Co (NYSE:WFC) has shown resilience in its price performance, outperforming the S&P 500 across various time frames. Over the past year, WFC has delivered a total return of 43%, significantly surpassing the S&P 500's 23% and the benchmark SPDR S&P Bank ETF’s (KBE) 19%. This trend extends over longer periods against the benchmark (KBE), with WFC's 5-year total returns at 39%, respectively, compared to the KBE's 11%.
Notably, the KBE has faced challenges, especially year-to-date, recording a negative 6% total return compared to the S&P 500's over 6%. The stock has outperformed both the market and the benchmark with a year-to-date total return of over 17%. Overall, Wells Fargo & Co has exhibited strong performance recently, making the fundamentals worth exploring.
Source: tradingview.com
Wells Fargo Fundamental Strengths And Implications
Strong Capital and Liquidity Positions:
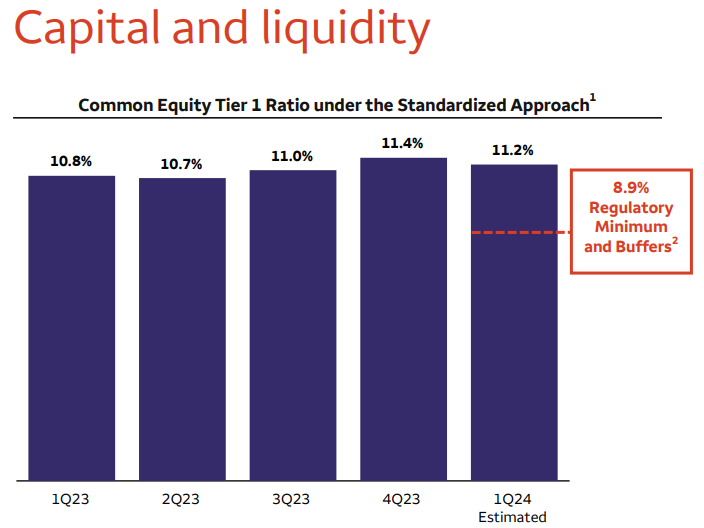
Wells Fargo maintains a strong capital and liquidity position:
- Common Equity Tier 1 (CET1) capital stood at $136.7 billion, with a CET1 ratio of 11.2%, well above regulatory minimums.
- Liquidity coverage ratio (LCR) was 126%.
The robust capital and liquidity positions signify Wells Fargo's financial strength and resilience. The high CET1 ratio indicates ample capital buffers to absorb potential losses and support business growth. Additionally, a strong liquidity coverage ratio reflects the bank's ability to meet short-term obligations and withstand liquidity shocks, enhancing overall stability and risk management.
Source: Earning presentation
Noninterest Income Growth:
Noninterest income increased by $1.2 billion, or 17%, from 1Q23. This growth is primarily attributed to various factors:
- Investment advisory fees and brokerage commissions increased by $224 million, or 8%, driven by higher market valuations.
- Deposit and lending-related fees increased by $93 million, or 6%, due to higher treasury management fees and one additional business day.
- Net gains from trading activities increased by $112 million, or 8%, reflecting market conditions and investments in the Markets business.
- Investment banking fees surged by $301 million, or 92%, due to increased activity across all products.
- Other income rose by $485 million, primarily due to higher net gains from equity securities in the affiliated venture capital business.
The significant increase in noninterest income reflects Wells Fargo's ability to diversify revenue streams and capitalize on favorable market conditions. The growth in investment advisory fees, brokerage commissions, and deposit-related fees underscores the strength of the wealth management and treasury management businesses. Additionally, higher trading activity and increased investment banking fees highlight the effectiveness of strategic investments in the Markets and Investment Banking segments.
Cost Management and Efficiency:
Noninterest expense increased by $662 million, or 5%, from 1Q23, driven by several factors:
- Operating losses increased by $366 million due to customer remediation accruals.
- Personnel expenses rose by $77 million, primarily reflecting higher revenue-related compensation.
- FDIC special assessment expenses amounted to $284 million in 1Q24.
- However, non-personnel expenses decreased by $65 million due to lower professional and outside services expenses.
Despite the overall increase in noninterest expenses, Wells Fargo demonstrated effective cost management and efficiency initiatives. The rise in operating losses, predominantly driven by customer remediation accruals, underscores the bank's commitment to addressing historical issues and enhancing risk management. Moreover, the increase in personnel expenses, offset by lower non-personnel expenses, reflects strategic investments in revenue-generating activities while controlling discretionary spending.
Credit Quality Management:
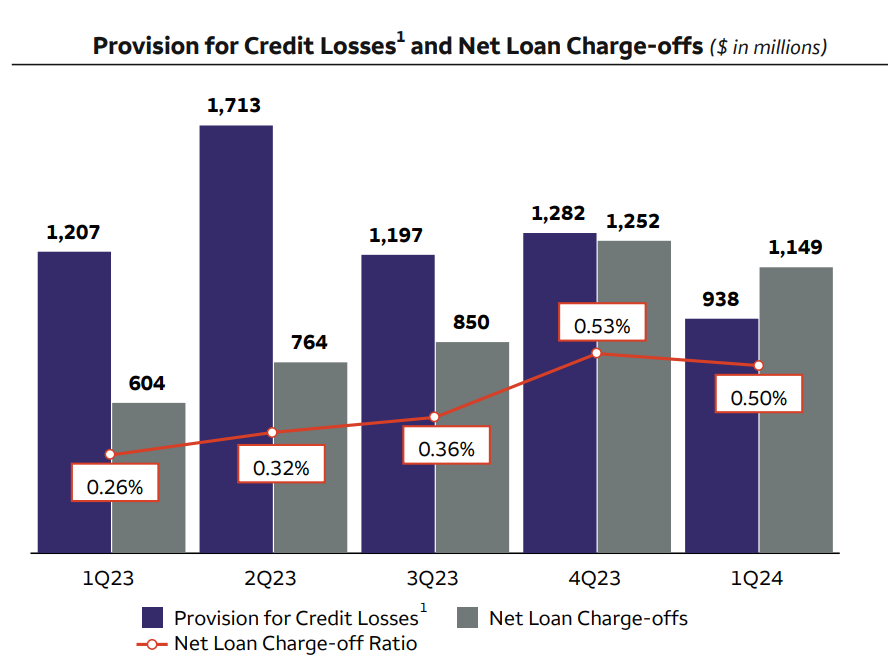
Despite higher net charge-offs, credit quality remains generally consistent:
- Provision for credit losses amounted to $938 million.
- Total net loan charge-offs were $1.1 billion, up $545 million from 1Q23.
- The allowance for credit losses for loans decreased modestly, driven by declines in commercial real estate and auto loans.
Wells Fargo's proactive approach to credit risk management is evident in its provision for credit losses and allowance for loan losses. Despite higher net charge-offs, credit quality remains stable, with consistent performance in consumer and wholesale credit portfolios. The decrease in the allowance for credit losses reflects confidence in the creditworthiness of certain loan segments, mitigating potential losses and supporting overall asset quality.
Source: Earning presentation
Business Segment Performance:
Despite challenges in certain segments, Wells Fargo's operating segments exhibit resilience and strategic focus:
- Consumer banking revenue declined 4% from a year ago, driven by lower deposit balances.
- Investment banking revenue increased by 2% YoY and 5% from 4Q23, driven by higher investment banking revenue.
- Wealth and Investment Management revenue declined 7% YoY, primarily due to lower asset-based fees.
Wells Fargo's diversified business model enables it to navigate challenges and capitalize on opportunities across various segments. While consumer banking faces pressure from lower deposit balances, investment banking demonstrates resilience with higher revenue. Wealth and Investment Management revenue decline reflects market volatility and fee pressure. However, strategic focus areas like investment banking contribute to overall revenue growth.
Wells Fargo Fundamental Weakness
Declining Net Interest Income:
Net interest income (NII) serves as a fundamental revenue source for banks like Wells Fargo, representing the difference between interest earned on loans and investments and interest paid on deposits and borrowings. However, the bank has faced a notable decline in NII, signaling a weakness in its core revenue generation capabilities.
In the first quarter of 2024, Wells Fargo reported a decrease in NII by $1.1 billion, or 8%, compared to the same period in the previous year. This decline can be primarily attributed to higher interest rates impacting funding costs and lower loan balances, exacerbated by customers' migration to higher-yielding deposit products.
The forecasted continuation of NII decline, expected to be approximately 7-9% lower than the full year 2023 level, further underscores the weakness in Wells Fargo's revenue outlook. Despite unchanged guidance, this projection indicates ongoing challenges in stabilizing and growing NII, hindering the bank's ability to achieve rapid growth potential through traditional banking activities.
Decrease in Average Loans and Deposits:
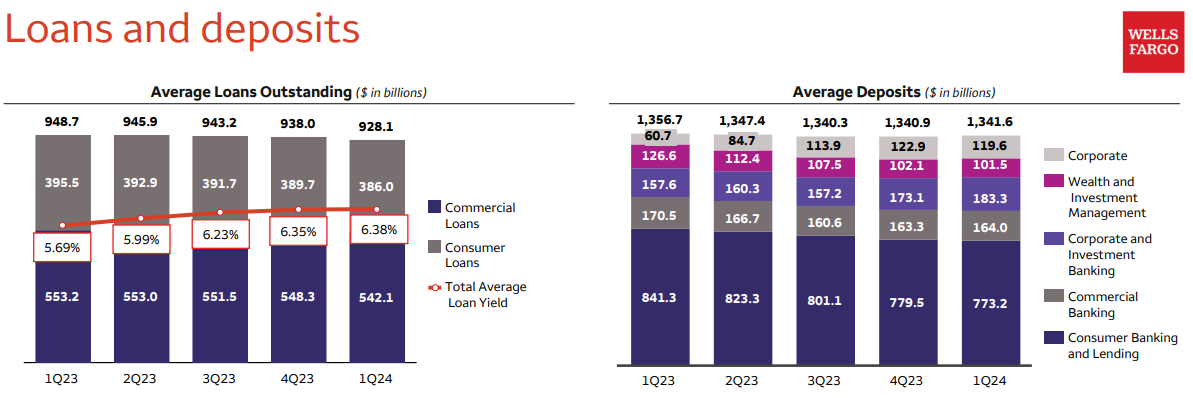
Average loans and deposits are key indicators of a bank's lending and deposit-taking activities, reflecting its ability to attract and retain customers' funds while deploying capital in the form of loans. However, Wells Fargo has experienced a decline in both average loans and deposits, signaling a weakness in its ability to sustain and grow these core banking operations.
In the first quarter of 2024, Wells Fargo reported a decrease in average loans by $20.6 billion, or 2%, year-over-year, and a decline in average deposits by $15.1 billion, or 1%, year-over-year. These trends highlight challenges in stimulating loan demand and retaining customer deposits, impacting the bank's ability to deploy capital effectively and generate interest income.
On the positive side, total average loan yield is enhancing and average deposits level is stabilizing sequentially.
Source: Earning presentation
Rising Noninterest Expense:
Noninterest expenses encompass various operating costs incurred by a bank in conducting its business activities, including personnel expenses, technology costs, and regulatory compliance expenses. However, Wells Fargo has faced a notable increase in noninterest expenses, reflecting challenges in controlling operational costs and enhancing efficiency.
In the first quarter of 2024, Wells Fargo reported a rise in noninterest expenses by $662 million, or 5%, compared to the same period in the previous year. This increase can be attributed to several factors, including higher operating losses, FDIC special assessment expenses, and increased revenue-related compensation expenses. The trends highlight the upward trajectory of noninterest expenses, signaling operational inefficiencies within the bank's cost structure.
Despite efforts to implement efficiency initiatives and reduce certain expenses, such as professional and outside services expense, the overall trend indicates challenges in controlling costs effectively. The unchanged full-year noninterest expense guidance of approximately $52.6 billion underscores the persistent pressure on expenses, which could impede the bank's ability to improve profitability and allocate resources towards growth initiatives.
Credit Quality Concerns:
Credit quality serves as a critical determinant of a bank's asset quality and risk management capabilities, reflecting its ability to assess, monitor, and mitigate credit risks. However, Wells Fargo has faced challenges in maintaining credit quality, as evidenced by an increase in net loan charge-offs and a decline in the allowance for credit losses.
In the first quarter of 2024, Wells Fargo reported an increase in net loan charge-offs to 0.50% of average loans, with total net charge-offs rising by $545 million compared to the same period in the previous year. This deterioration in credit quality can be attributed to higher consumer net loan charge-offs, particularly in credit card loans, indicating potential weaknesses in consumer credit performance.
Regulatory Risks and Compliance Costs:
Regulatory risks and compliance costs represent significant challenges for banks, particularly those with a history of regulatory violations and misconduct. Wells Fargo has been subject to regulatory actions and consent orders related to sales practices misconduct, highlighting weaknesses in its risk management and compliance frameworks.
The trends indicate significant investments in risk and control functions, with expenses exceeding $2.5 billion more per year since 2018. While these investments demonstrate the bank's commitment to addressing regulatory concerns and enhancing its control environment, they also reflect ongoing challenges in remediation efforts and compliance obligations.
Wells Fargo Outlook
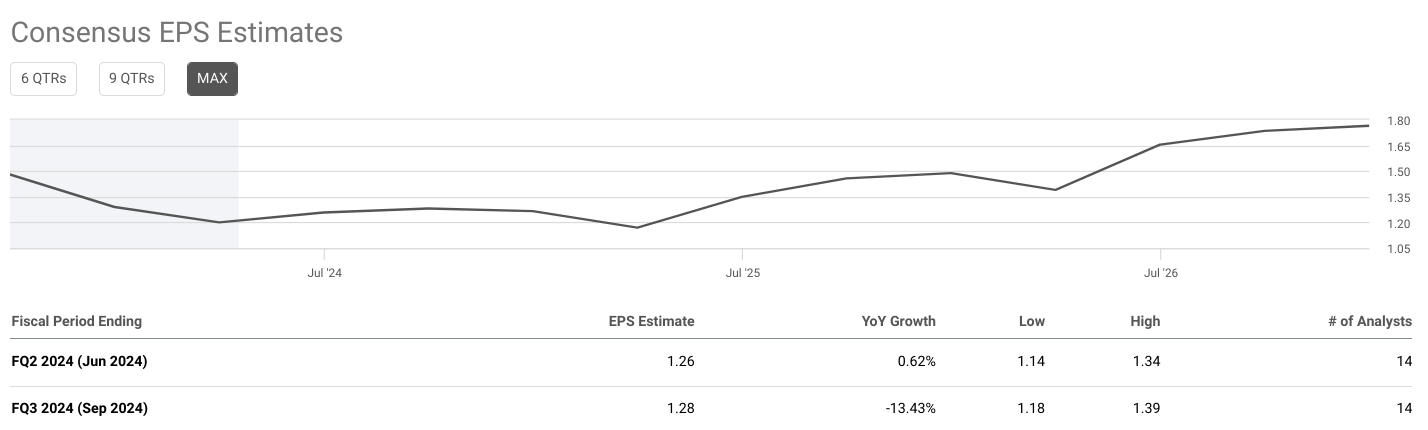
Consensus EPS Estimates:
The consensus EPS estimate for FQ2 2024 stands at $1.21. Compared to the previous year, this reflects a decrease of 3.21%. The range of analyst estimates is relatively narrow, with a low estimate of $1.15 and a high estimate of $1.30. This suggests a consensus among analysts regarding the expected earnings for this period. Additionally, the number of analysts providing estimates remains consistent at 11, indicating a sufficient sample size for reliable consensus.
Source: seekingalpha.com
For FQ3 2024, the consensus EPS estimate is $1.23, representing a more substantial decline of 16.77% compared to the same period in the previous year. Similar to FQ2 2024, the range of analyst estimates is relatively narrow, with a low estimate of $1.16 and a high estimate of $1.30. Despite the decline in EPS, the number of analysts providing estimates remains consistent at 11, reinforcing the reliability of the consensus.
The trends in consensus EPS estimates indicate a pessimistic outlook for Wells Fargo & Co in both FQ2 and FQ3 2024.
Consensus Revenue Estimates:
The consensus revenue estimate for FQ2 2024 is $20.07 billion, reflecting a slight decrease of 2.25% year-over-year. Similar to EPS estimates, the range of revenue estimates is relatively narrow, with a low estimate of $19.81 billion and a high estimate of $20.38 billion. Additionally, the number of analysts providing revenue estimates remains consistent at 11, ensuring a robust consensus.
In FQ3 2024, the consensus revenue estimate decreased further to $20.06 billion, with a more significant decline of 3.81% compared to the same period in the previous year. The range of revenue estimates remains narrow, with a low estimate of $19.85 billion and a high estimate of $20.34 billion. Despite the decline in revenue, the number of analysts providing estimates decreases slightly to 10, which may have a minor impact on the consensus.
The trends in consensus revenue estimates mirror those of EPS, indicating a challenging operating environment for Wells Fargo & Co in both FQ2 and FQ3 2024. The declining revenue estimates suggest potential issues affecting the company's top-line growth, such as decreased consumer demand, increased competition, or changes in market dynamics.
Consensus EPS Revision Trends:
In FQ2 2024, the consensus EPS estimate of $1.21 exhibits a positive 1-month trend of 3.13%, indicating an upward revision in estimates over the short term. This trend suggests growing optimism among analysts regarding Wells Fargo & Co's earnings performance for the period. However, the 3-month and 6-month trends of 1.93% and 1.06%, respectively, indicate a slower pace of growth in EPS estimates over longer time frames.
For FQ3 2024, the consensus EPS estimate of $1.23 shows a 1-month trend of 1.71%, indicating a continued but slower upward revision in estimates compared to the previous period. However, the 3-month and 6-month trends of -0.21% and -2.42%, respectively, signal a reversal in growth momentum, with EPS estimates declining over longer time frames.
The trends in EPS revision indicate a mixed outlook for Wells Fargo & Co's earnings performance in both FQ2 and FQ3 2024. While short-term revisions show some optimism, longer-term trends suggest a slowdown or decline in growth momentum.
Consensus Revenue Revision Trends:
In FQ2 2024, the consensus revenue estimate of $20.07 billion demonstrates positive 1-month, 3-month, and 6-month trends of 0.22%, 0.27%, and 0.25%, respectively. These trends indicate a consistent upward revision in revenue estimates over various time frames, reflecting growing optimism among analysts regarding Wells Fargo & Co's revenue performance for the period.
Conversely, in FQ3 2024, the consensus revenue estimate of $20.06 billion shows negative 1-month and 3-month trends of -0.16% and -0.86%, respectively. However, the 6-month trend remains positive at 1.78%, suggesting a potential turnaround in revenue estimates over longer time frames.
The trends in revenue revision paint a nuanced picture of Wells Fargo & Co's revenue outlook for FQ2 and FQ3 2024. While short-term trends vary, longer-term trends indicate a potential recovery or stabilization in revenue estimates.
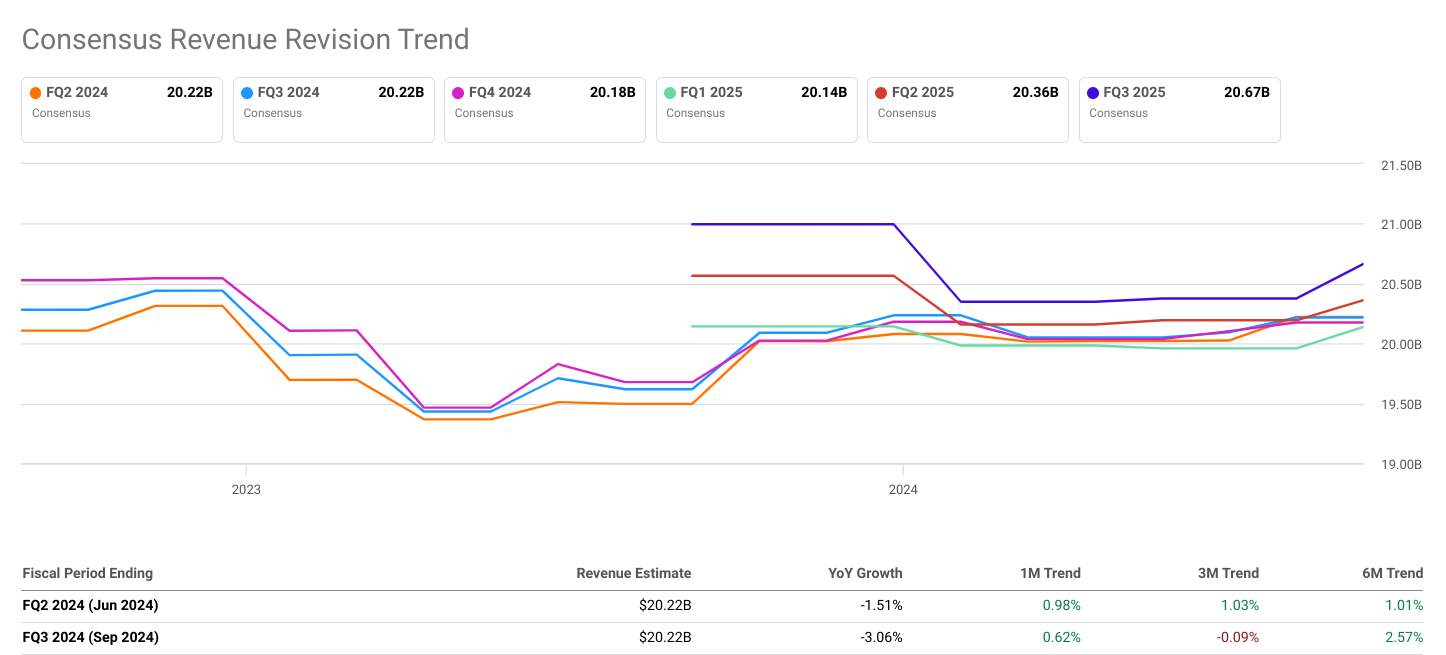
Source: seekingalpha.com
Notable Estimate Trends:
The WSJ estimate trends for Q2 2024 show a consistent EPS estimate of $1.20 across different time frames, including the current period, one month ago, and three months ago. This stability in estimates suggests a level of confidence or consensus among analysts regarding Wells Fargo & Co's earnings performance for the quarter.
Similarly, the WSJ estimate trends for Q3 2024 reveal minimal changes in EPS estimates over different time frames. The current EPS estimate of $1.23 remains unchanged from one month ago, while showing a marginal increase from three months ago. This consistency in estimates indicates a steady outlook for Wells Fargo & Co's earnings performance in the third quarter of 2024. The trends in WSJ estimate trends corroborate the consensus EPS estimates provided, reflecting a stable or consistent outlook for Wells Fargo & Co's earnings performance in both Q2 and Q3 2024.
Wells Fargo Valuation
P/E Non-GAAP (Forward)
The forward Price-to-Earnings (P/E) ratio is a key metric used to evaluate a stock's valuation relative to its earnings outlook. For Wells Fargo & Co (NYSE:WFC), the current forward P/E stands at 11.2, indicating that investors are willing to pay $11.20 for every dollar of expected future earnings per share. Comparing this to the sector median forward P/E of 9.9, we observe that WFC trades at a premium of 13.20%. This suggests that investors are relatively optimistic about WFC's earnings potential compared to its industry peers. However, when we consider WFC's 5-year average forward P/E of 18.1, the current valuation reflects a substantial discount of approximately 38.09%. This indicates a notable deviation from historical valuation levels, implying that either WFC's earnings outlook has improved, or investor sentiment has become more conservative.
PEG Non-GAAP (Forward)
The Price/Earnings to Growth (PEG) ratio offers insight into a stock's valuation relative to its earnings growth potential. With a forward PEG ratio of 0.84, Wells Fargo & Co (NYSE:WFC) appears undervalued in terms of growth prospects compared to its sector peers. This indicates that investors may be pricing WFC shares at a discount relative to its expected earnings growth rate. The negative percentage difference of -31.07% compared to the sector median suggests that WFC's growth potential is not fully reflected in its current stock price. Similarly, when contrasted with its 5-year average forward PEG ratio of 1.71, WFC shows a substantial undervaluation of approximately 51.13%. This implies that the market may be underestimating WFC's ability to generate earnings growth in the future, possibly due to lingering concerns or conservative investor sentiment.
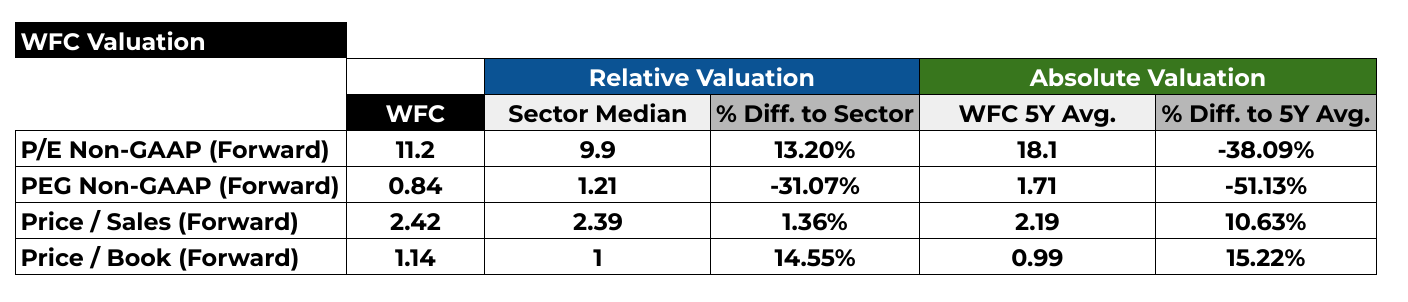
Source: Analysts'compilation
Price / Sales (Forward)
The Price-to-Sales (P/S) ratio is a valuation metric that measures a stock's price relative to its revenue per share. At a forward P/S ratio of 2.42, Wells Fargo & Co (NYSE:WFC) commands a slight premium of 1.36% compared to the sector median forward P/S ratio of 2.39. This indicates that investors are willing to pay a slightly higher price for WFC's expected future sales relative to its industry peers. However, when we consider WFC's 5-year average forward P/S ratio of 2.19, the current valuation shows a more substantial premium of approximately 10.63%. This suggests that investors may be anticipating stronger sales growth or improved profitability for WFC in the future, driving up its valuation relative to historical levels.
Price / Book (Forward)
The Price-to-Book (P/B) ratio compares a company's market value to its book value, reflecting investor sentiment towards the company's asset base. With a forward P/B ratio of 1.14, Wells Fargo & Co (NYSE:WFC) trades at a premium of 14.55% compared to the sector median forward P/B ratio of 1. This suggests that investors are willing to pay a higher price relative to WFC's book value compared to its industry peers. Similarly, when compared to its 5-year average forward P/B ratio of 0.99, WFC's current valuation reflects a premium of approximately 15.22%. This indicates that investors may have a positive outlook on WFC's asset quality and potential for generating returns on its assets in the future.
Street Price Forecast
As per CNN, analysts' outlook on Wells Fargo & Co (NYSE:WFC) is mixed, with 52% recommending a "Buy," 48% suggesting a "Hold," and no "Sell" recommendations. The 1-year stock price forecast ranges from a high of $70.00 to a low of $55.00, with a median forecast of $62.00. This implies potential upside ranging from 3.81% to 22.42% from the current stock price of $57.18. The average price target of $62.39 aligns closely with the median forecast, indicating a consensus among analysts regarding WFC's valuation over the next 12 months.
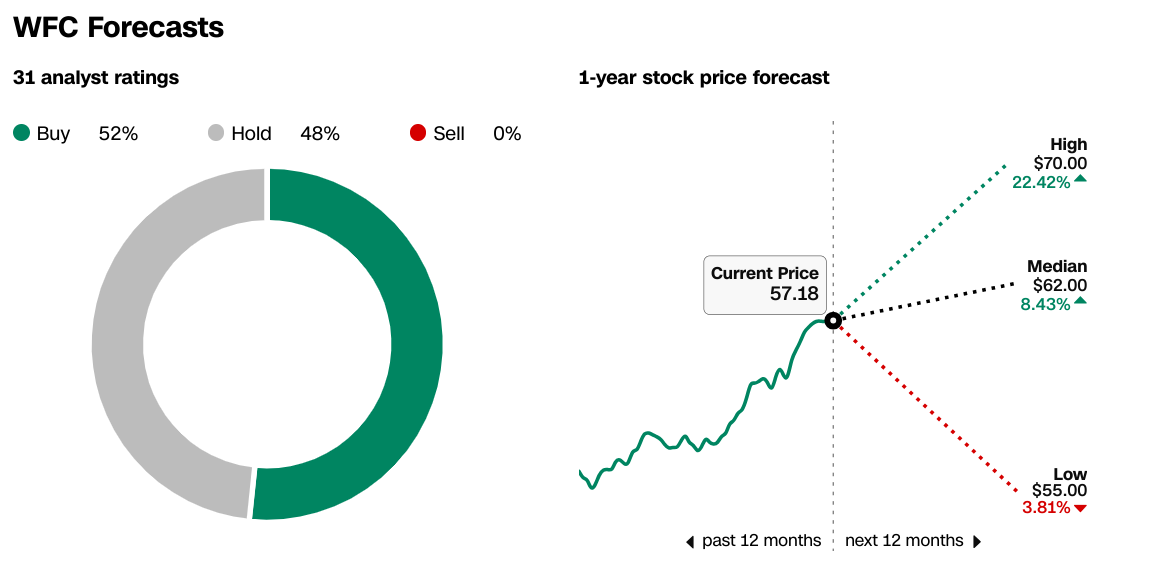
Source: CNN.com
WFC Stock Dividend Summary
Wells Fargo & Co (NYSE:WFC) offers a forward dividend yield of 2.48%, with an annual payout of $1.40 per share and a payout ratio of 25.86%. The negative 5-year growth rate of -4.51% suggests that the company's dividend payments have been declining over the past five years. However, the fact that the dividend has shown growth over the past 2 years indicates a potential reversal in this trend. Investors seeking income may find WFC's dividend yield attractive, especially considering the relatively low payout ratio, which suggests room for potential dividend increases in the future.
WFC Stock Forecast Technical Take
WFC Stock Price Trend Analysis
Wells Fargo & Co (WFC) has shown a significant upward trend, as indicated by the current price of $57.17 compared to the modified exponential moving average (EMA) trendline of $51.39. This suggests bullish momentum in the stock's movement. The baseline, another modified EMA indicator, stands at $50.84, further reinforcing the upward trajectory of Wells Fargo stock.
The trendline analysis indicates a strong bullish sentiment, supported by the current price trading well above the trendline. This suggests that the stock has potential for further upside movement. However, it's essential to monitor whether the stock maintains its position above the trendline to confirm the continuation of this upward trend.
Wells Fargo Stock Price Targets
The average price target for WFC by the end of 2024 is $67.80, based on the momentum in change in polarity over the mid- to short-term, projected over Fibonacci retracement/extension levels. This indicates an expected increase in the stock price from its current level.
Additionally, the optimistic price target of $72.00 for the same period suggests further upside potential. This target is based on the price momentum of the current swing over the mid- to short-term, projected over Fibonacci retracement/extension levels. These targets reflect the positive sentiment surrounding WFC's future performance.
Support and Resistance Levels
The primary support level for WFC stock is at $54.55, indicating a price point where buying interest could potentially increase, supporting the stock price during pullbacks or corrections. On the other hand, the pivot of the current horizontal price channel is at $48.40, serving as a crucial level to monitor for potential trend reversals or significant price movements.
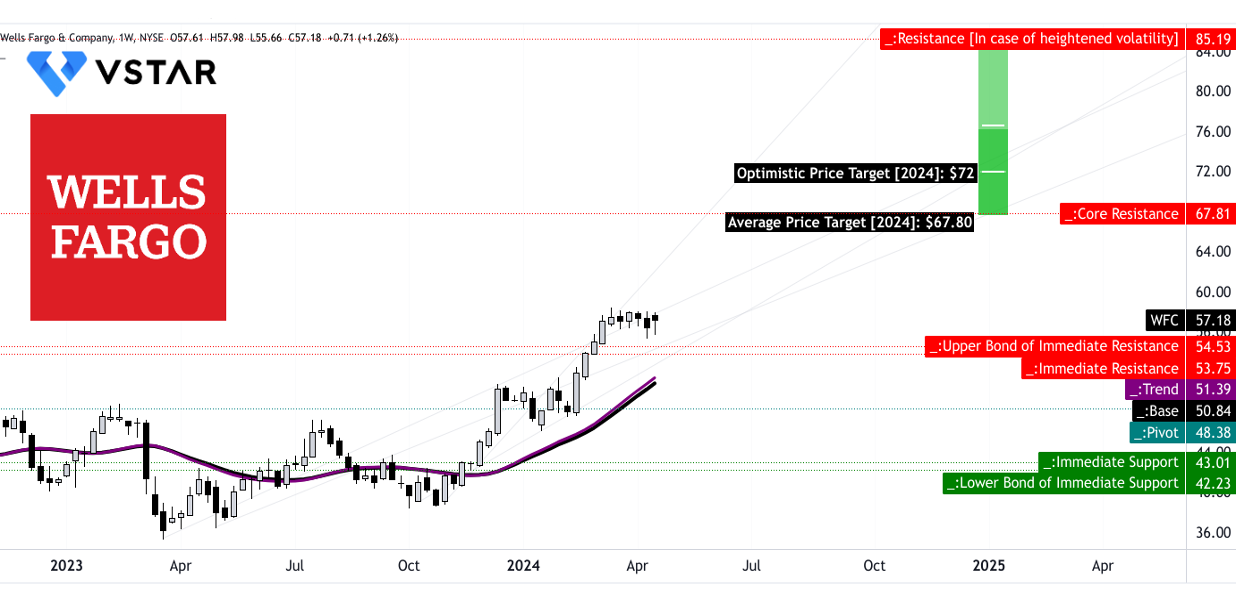
Source: tradingview.com
Relative Strength Index (RSI)
The RSI value of 74.12 suggests that WFC is currently in overbought territory, indicating strong buying pressure. However, it's important to note that this level is above the regular bullish level of 59.83, signaling potential overheating in the stock price. Despite not showing bullish or bearish divergences, the high RSI value warrants caution as it may precede a correction or consolidation phase.
Moving Average Convergence/Divergence (MACD)
The MACD indicator shows a bullish trend with the MACD line of 3.23 above the signal line of 2.64. However, the decreasing strength of the trend, as indicated by the decreasing MACD histogram, suggests a potential weakening of bullish momentum. This indicates the need for careful monitoring to assess whether the bullish trend will continue or undergo a reversal.
In summary, while the technical analysis indicates a bullish sentiment for WFC, traders should remain vigilant, especially regarding potential overbought conditions and weakening bullish momentum indicated by certain indicators.
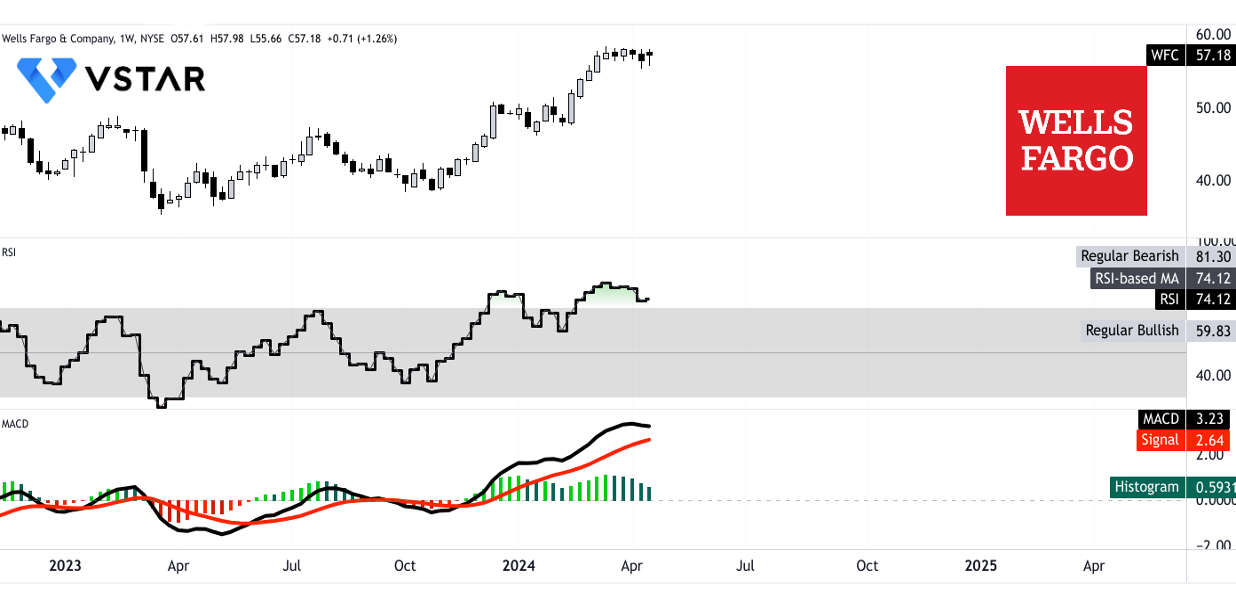
Source: tradingview.com
In conclusion, Wells Fargo & Co's trajectory in the financial landscape hinges on a delicate balance between its strengths and weaknesses. While technical indicators suggest bullish momentum, fundamental challenges like declining net interest income and credit quality concerns pose risks.


