


- US crude oil refinery inputs rose to 15.9 million bpd, signaling heightened demand or improved capacity utilization.
- Gasoline and distillate fuel production decreased, indicating potential operational challenges or shifts in priorities.
- Crude oil imports increased slightly, while inventories rose by 2.7 million barrels, suggesting a buildup relative to demand.
- Total products supplied averaged 19.8 million bpd, with declines in gasoline and distillate fuel demand, offset by a modest increase in jet fuel consumption.
The Energy Information Administration (EIA) report serves as a critical map, offering a path forward for trading operations. The article delves into the latest EIA insights, dissecting key metrics ranging from crude oil refinery inputs to pricing dynamics. From the bustling refineries of the United States to the far-flung oil fields of major exporters, each data element points to the supply, demand, and market sentiment. Read more to learn the behind fluctuations in refinery inputs, production volumes, import trends, inventory levels, and technical price projection for the next week.
Interpretation of EIA data
Crude Oil Refinery Inputs and Production:
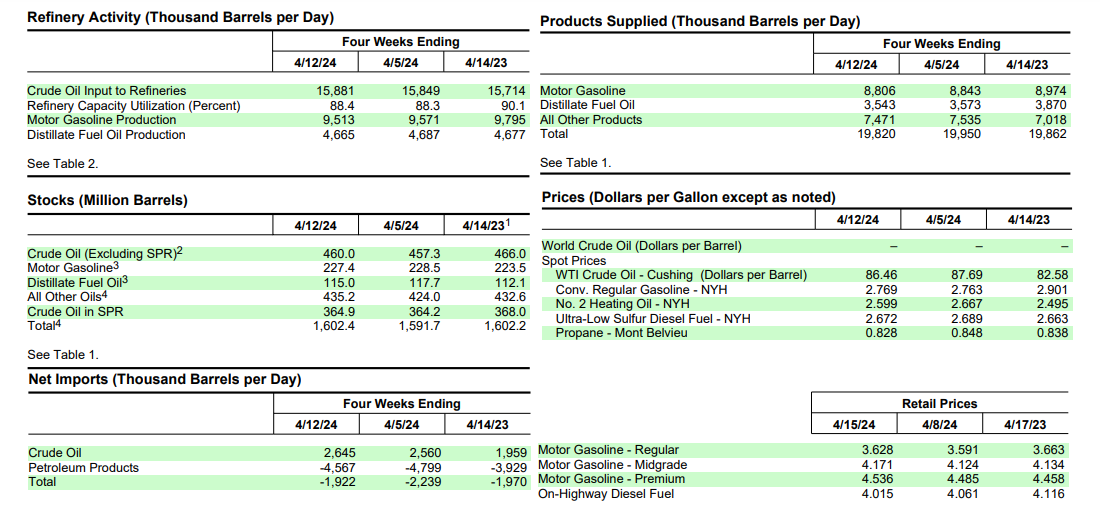
Refinery inputs, which averaged 15.9 million barrels per day (bpd) during the week ending April 12, 2024, increased by 131 thousand barrels per day compared to the previous week. This slight uptick suggests a modest rise in demand for crude oil processing. However, it's important to note that refineries operated at 88.1% of their operable capacity last week, indicating that there is still room for increased utilization if demand were to surge further.
Source: EIA.gov
Gasoline production, averaging 9.4 million bpd, decreased last week. This decline may be attributed to factors such as seasonal demand patterns, changes in consumer behavior, or operational challenges at refineries. A decrease in gasoline production can impact gasoline inventories and, subsequently, prices at the pump.
Similarly, distillate fuel production decreased to 4.6 million bpd last week. Distillate fuels include diesel, heating oil, and jet fuel. A decrease in distillate fuel production could indicate lower demand from industries such as transportation, heating, and aviation.
Crude Oil Imports and Inventory Levels:
Despite a slight increase in crude oil imports by 27 thousand barrels per day (kbpd) compared to the previous week, commercial crude oil inventories in the U.S. increased by 2.7 million barrels, reaching 460.0 million barrels. However, this level is still about 1% below the five-year average for this time of year. The discrepancy between imports and inventory levels suggests that domestic production or other factors may have contributed to the inventory build-up.
Total commercial petroleum inventories increased by 10.0 million barrels last week, indicating a broader accumulation of petroleum stocks. This increase could be influenced by factors such as changes in production levels, import volumes, or shifts in demand for petroleum products.
Petroleum Product Supplied:
Total products supplied over the last four weeks averaged 19.8 million barrels per day (bpd), down by 0.2% from the same period last year. This marginal decrease suggests relatively stable demand for petroleum products compared to the previous year. However, variations in product supplied for specific categories provide more nuanced insights.
Motor gasoline product supplied averaged 8.8 million bpd over the past four weeks, down by 1.9% from the same period last year. This decline could be attributed to factors such as changes in vehicle fuel efficiency, shifts in consumer preferences for alternative transportation modes, or economic factors impacting consumer spending.
Distillate fuel product supplied averaged 3.5 million bpd over the past four weeks, down by 8.4% from the same period last year. The significant decrease in distillate fuel consumption may reflect reduced industrial activity, changes in heating oil demand, or shifts in transportation patterns.
Jet fuel product supplied experienced a modest increase of 0.8% compared to the same four-week period last year. This uptick could be driven by factors such as growth in air travel demand, changes in airline fuel efficiency, or shifts in cargo transportation.
Price Analysis:
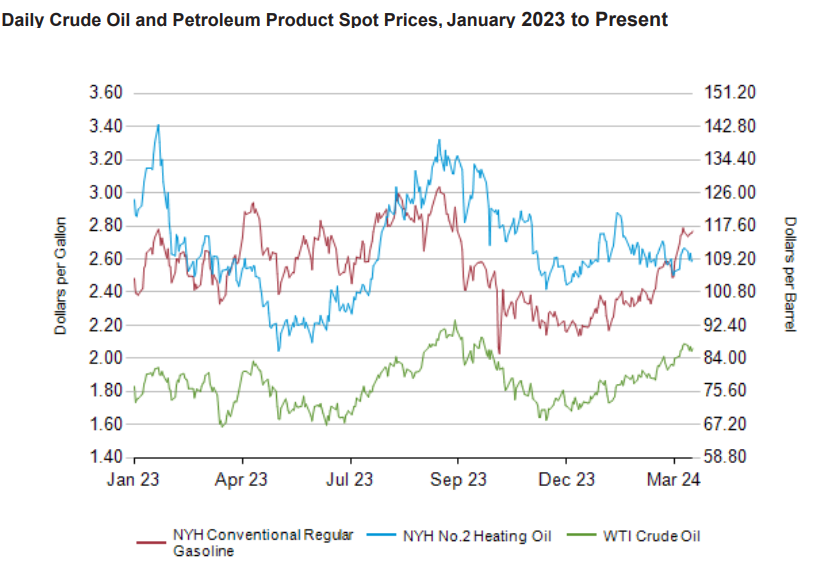
On April 12, 2024, WTI crude oil price was $86.46 per barrel, $1.23 lower than the previous week's price but $3.88 higher than a year ago. This price movement reflects short-term volatility in crude oil markets, influenced by factors such as changes in production levels, geopolitical tensions, and global economic conditions.
Spot prices for petroleum products also exhibit fluctuations based on supply and demand dynamics, as well as seasonal factors. The New York Harbor spot price for conventional gasoline increased slightly to $2.769 per gallon, while the spot price for No. 2 heating oil declined to $2.599 per gallon. These movements may reflect changes in refining margins, regional supply imbalances, or shifts in consumer demand patterns.
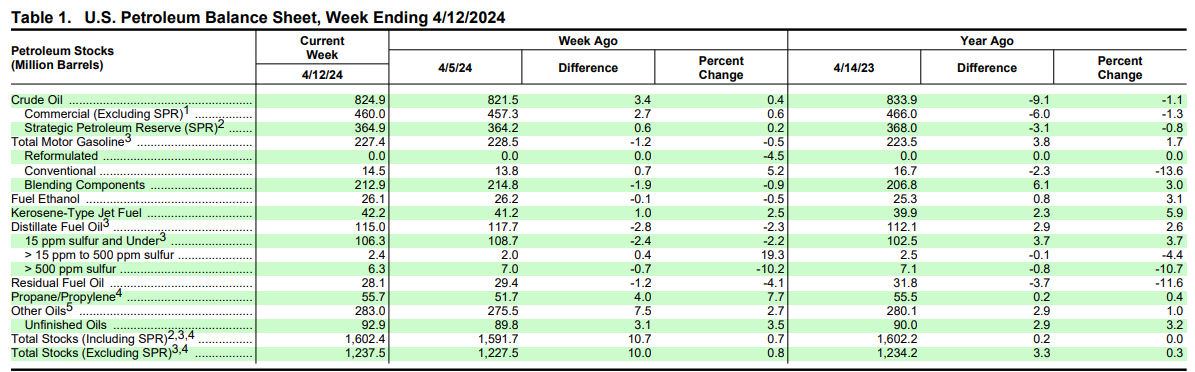
Petroleum Balance Sheet:
Crude oil stocks increased slightly by 0.4% from the previous week but remained 1.1% below the levels of the same period last year. This suggests a relatively stable inventory situation for crude oil, with modest fluctuations compared to historical averages.
Motor gasoline stocks decreased slightly by 0.5% from the previous week but increased by 1.7% compared to the same period last year. Despite the weekly decline, gasoline stocks remain above the levels of the previous year, indicating adequate supply levels relative to demand.
Distillate fuel oil stocks decreased by 2.3% from the previous week but increased by 2.6% compared to the same period last year. This suggests a mixed picture for distillate fuel inventories, with short-term declines but long-term stability relative to historical levels.
Source: EIA.gov
Preliminary Crude Imports by Country of Origin:
Canada remains the largest importer of crude oil to the U.S., with imports averaging 3,458 thousand barrels per day (kbpd). Canada's proximity to the United States and its significant oil reserves make it a key supplier of crude oil, providing stability to U.S. energy supply chains.
Mexico and Saudi Arabia are also significant sources of crude oil imports, although their import volumes exhibit more variability compared to Canada. Fluctuations in crude imports from these countries may be influenced by geopolitical factors, changes in production levels, or shifts in trade dynamics.
Bullish Price Implications
Decrease in U.S. Crude Oil Refinery Inputs:
The decline, though marginal, suggests a potential reduction in crude oil supply. Refinery inputs are directly linked to crude oil processing and production. A decrease in refinery inputs could indicate either planned maintenance or lower demand from refineries due to economic factors. In either case, a decrease in refinery inputs is generally interpreted as bullish for crude oil prices since it implies reduced supply to the market.
Decrease in Gasoline and Distillate Fuel Production:
Lower production levels of refined products like gasoline and distillate fuels suggest either weakening demand or supply constraints. In either scenario, reduced production implies a potential imbalance between supply and demand, which tends to exert upward pressure on crude oil prices, thus signaling a bullish market sentiment.
Decline in Crude Oil Imports:
Although U.S. crude oil imports saw a slight increase, the data highlight notable declines in imports from key oil-producing countries like Saudi Arabia, Colombia, and Nigeria. This decrease in imports from significant suppliers suggests potential disruptions or geopolitical factors affecting supply chains. Reduced imports contribute to tightening supply conditions in the domestic market, thereby supporting higher crude oil prices. Consequently, a decline in crude oil imports, particularly from major suppliers, is interpreted as bullish for the market.
Decrease in Distillate Fuel Inventories:
The data reveal a substantial decrease in distillate fuel inventories, with current levels approximately 7% below the five-year average for this time of year. A decrease in distillate fuel inventories signifies either increased demand or supply constraints, both of which are supportive of higher crude oil prices. Therefore, the decline in distillate fuel inventories reinforces the bullish sentiment in the crude oil market.
Mixed Price Movements:
While the price for West Texas Intermediate (WTI) crude oil experienced a marginal decrease from the previous week, it remained higher than the price from a year ago. Similarly, the national average retail price for regular gasoline rose slightly from the previous week but was lower than the price from a year ago. Despite the short-term fluctuations, the overall trend of higher prices compared to the previous year supports a bullish outlook for crude oil.
Source: EIA.gov
Bearish Price Implications
Increase in Crude Oil Inventories:
Moreover, total motor gasoline inventories decreased slightly, but distillate fuel inventories registered a notable decline. The increase in crude oil inventories, coupled with mixed movements in gasoline and distillate fuel inventories, suggests potential oversupply conditions in the market. Elevated inventory levels typically exert downward pressure on crude oil prices, signaling a bearish market sentiment.
Decline in Total Products Supplied:
The data indicate a slight decrease in total products supplied over the last four-week period compared to the same period last year. Notably, motor gasoline product supplied experienced a decline of 1.9%, while distillate fuel product supplied decreased by 8.4%. These declines in product supplied suggest weakening demand for petroleum products, including crude oil.
Decline in Jet Fuel Product Supplied:
Despite a modest increase compared to the same period last year, jet fuel product supplied saw a decline in the last four weeks. This decline could be attributed to various factors such as reduced air travel demand, airline industry challenges, or shifts towards alternative energy sources. Jet fuel consumption is closely tied to aviation activity, and any downturn in this sector can have broader implications for crude oil demand. Therefore, the decline in jet fuel product supplied reflects weakening demand dynamics that contribute to a bearish outlook for crude oil prices.
Increase in Propane/Propylene Inventories:
The increase in inventories suggests ample supply in these specific petroleum products, which may indicate softer demand or production surpluses. While propane and propylene inventories may not directly impact crude oil prices, they reflect broader market conditions and sentiment, potentially exerting downward pressure on crude oil prices.
Mixed Price Movements:
Despite the overall trend of higher prices compared to the previous year, the mixed price movements observed in WTI crude oil and retail gasoline prices signal market uncertainties and volatility. Factors such as geopolitical tensions, macroeconomic indicators, and policy decisions can influence short-term price movements in crude oil and related products.
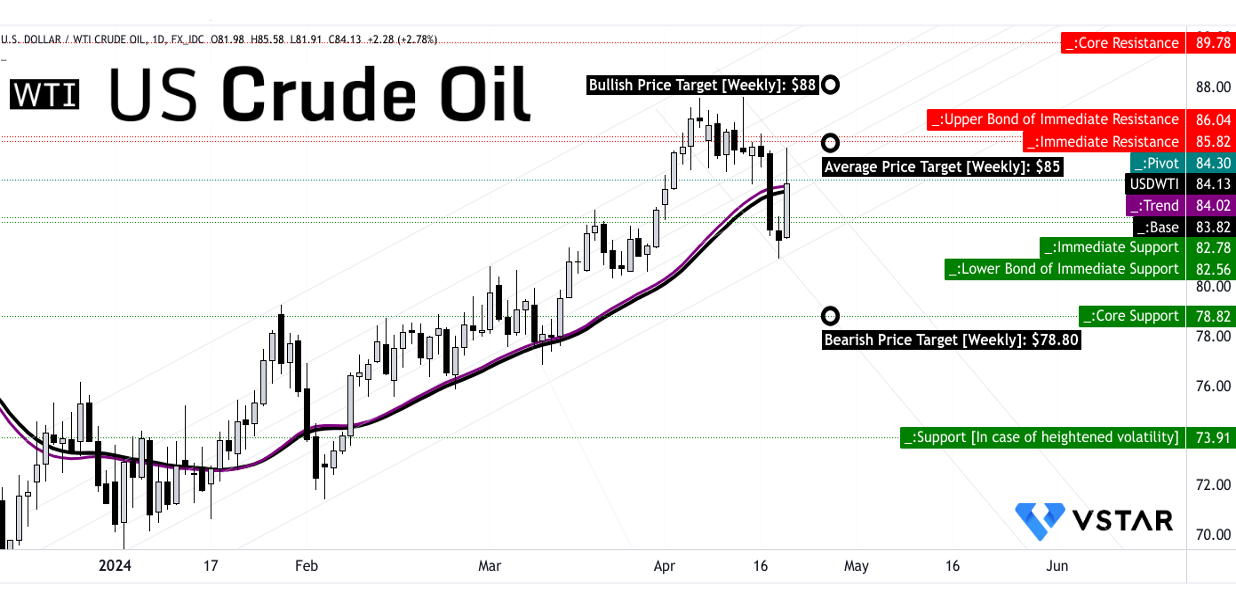
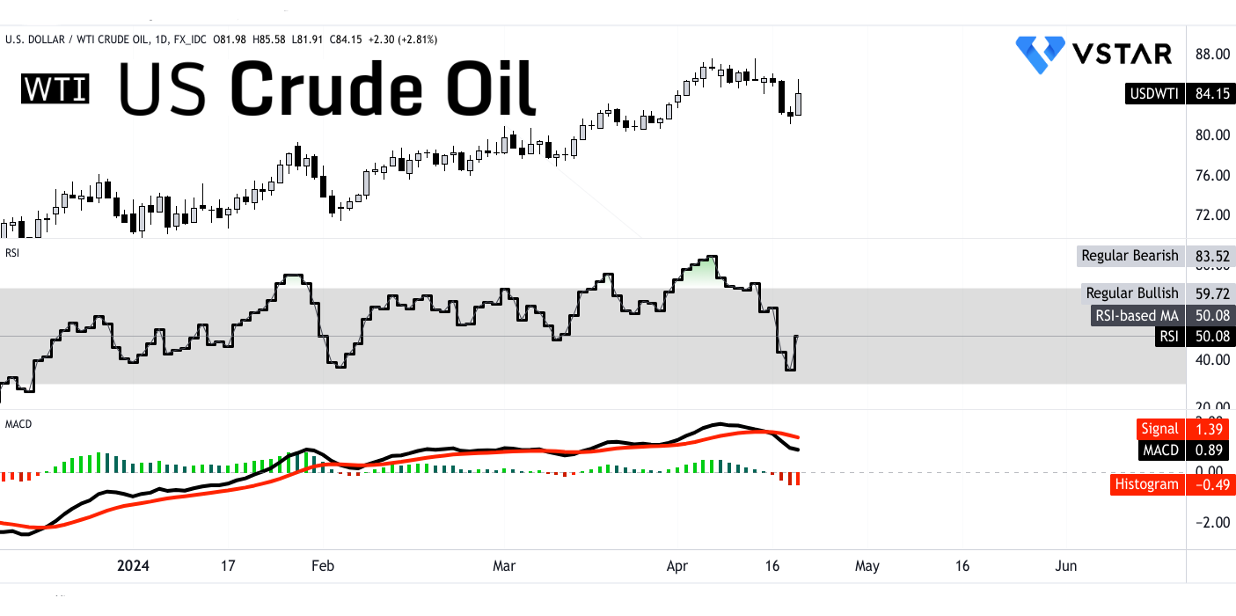
WTI Crude Oil Price Technical Take
Trend Analysis:
The current WTI Oil price stands at $84.13, slightly above the trendline and baseline values of $84.02 and $83.82, respectively. This suggests a marginal upward movement in the short term. However, the overall direction of the price is indicated as downward. It's essential to monitor if the price remains above the trendline or if it consolidates below it, indicating a potential reversal.
WTI Price Targets:
- Average Price Target: $85.00.
This target is derived from momentum of change-in-polarity and projected over Fibonacci retracement/extension levels, implying a modest increase from the current price.
- Bullish Price Target: $88.00.
This target is based on the higher-high price momentum of the current swing, indicating a more optimistic outlook.
- Bearish Price Target: $78.80.
This target reflects the lower-low price momentum of the current swing, suggesting a pessimistic scenario.
These targets provide a range of potential outcomes, with bullish and bearish scenarios depending on the prevailing market sentiment.
Support and Resistance Levels:
- Primary Support: $82.55
- Primary Resistance: $86
- Major Support: $78.80
- Major Resistance: $89.80
- Pivot of Current Horizontal Price Channel: $84.30
These levels serve as important reference points for traders. The primary support and resistance levels are crucial for assessing short-term price movements, while major support and resistance levels provide insights into longer-term trends. The pivot of the current horizontal price channel at $84.30 could act as a significant turning point.
Source: tradingview.com
Relative Strength Index (RSI):
The RSI value of 50.08 suggests a neutral stance. Although the trend is increasing, it hasn't reached bullish or bearish extremes. The absence of bullish or bearish divergences indicates a lack of significant price anomalies that could signal potential reversals.
Moving Average Convergence/Divergence (MACD) Indicator:
The MACD line at 0.89 is below the signal line of 1.39, with a negative histogram reading of -0.49, indicating a bearish trend. However, the strength of the trend is stabilized, suggesting a potential consolidation rather than a sharp decline.
Source: tradingview.com
Conclusion
With refinery inputs showing a modest rise in demand but operating below full capacity, coupled with decreased gasoline and distillate fuel production, bullish sentiments prevail, suggesting potential supply constraints. Despite a slight increase in crude oil imports, elevated inventories, and mixed product supply trends, the overall trend toward higher prices compared to the previous year supports a bullish outlook. However, cautious monitoring is advised as technical analysis suggests a marginal upward short-term movement but an overall downward trend, with resistance at $86 and support at $82.55. Potential price targets range from a bullish $88 to a bearish $78.80, reflecting market uncertainties.


