Robinhood Markets, Inc. (HOOD)
I. Company Overview: From "Commission-Free" to High-Frequency Trading Platform
Robinhood Markets, Inc. is one of the most recognizable companies in the U.S. retail brokerage industry. In its early days, the company reshaped the industry's pricing structure with commission-free trading, attracting a large number of young, high-frequency, and higher risk-preference investors. In recent years, management has attempted to shed the "single broker" label through product innovation, aiming to build Robinhood into a comprehensive financial platform covering trading, payments, subscriptions, and derivatives. From a business direction perspective, this transformation path is clear and aggressive, and it has indeed received phased validation in financial data.

II. Performance Review: Growth and Profitability Amplify Simultaneously
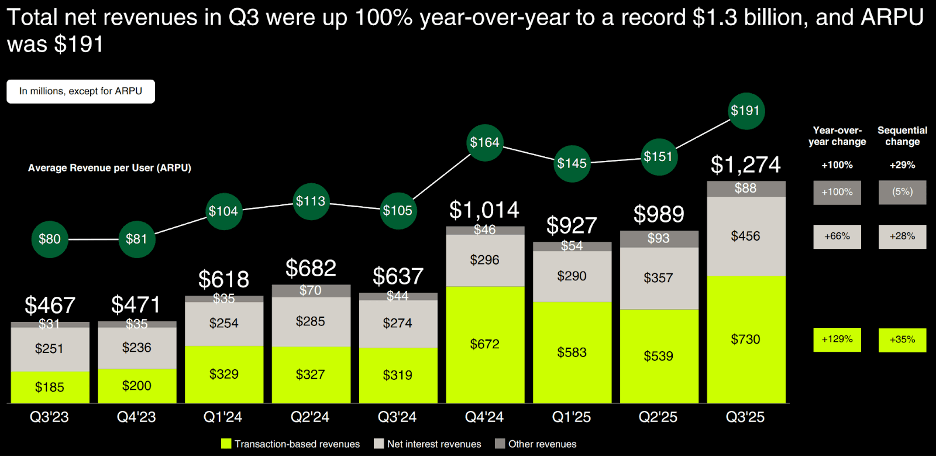
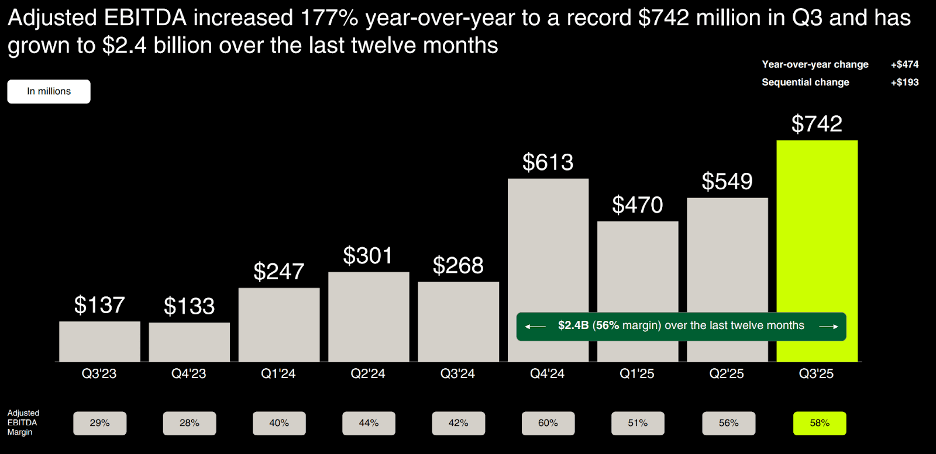
Based on the latest disclosed Q3 2025 data, Robinhood's fundamental performance is almost impeccable. The company's revenue in the quarter grew 100% year-over-year to $1.3 billion, with trading revenue surging by 129% year-over-year, becoming the most core source of growth. More noteworthy is the jump in profitability, with the adjusted EBITDA margin improving by 1,600 basis points to 58%, showing simultaneous delivery on economies of scale and cost control.
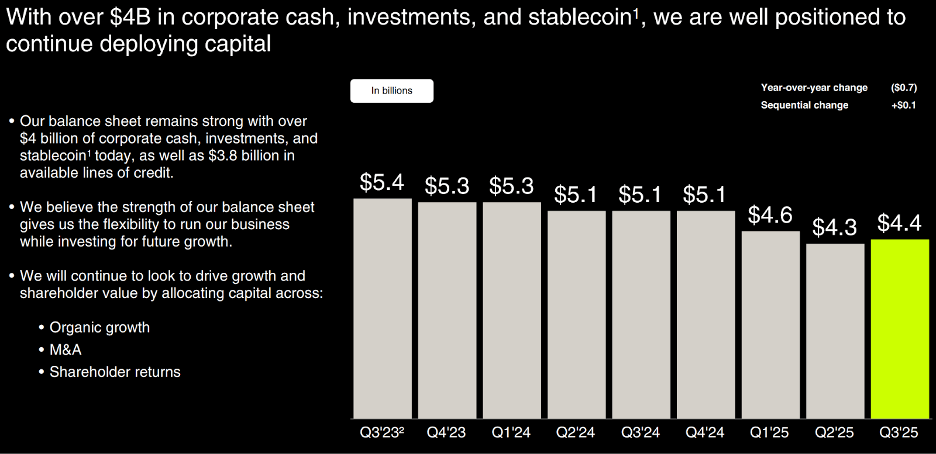
The balance sheet is also solid. At the end of the quarter, the company held approximately $4.4 billion in cash and investments and had almost no interest-bearing debt, a rare "net cash" position among its peers.
III.Product and User Structure: Scaling of Gold and Prediction Markets
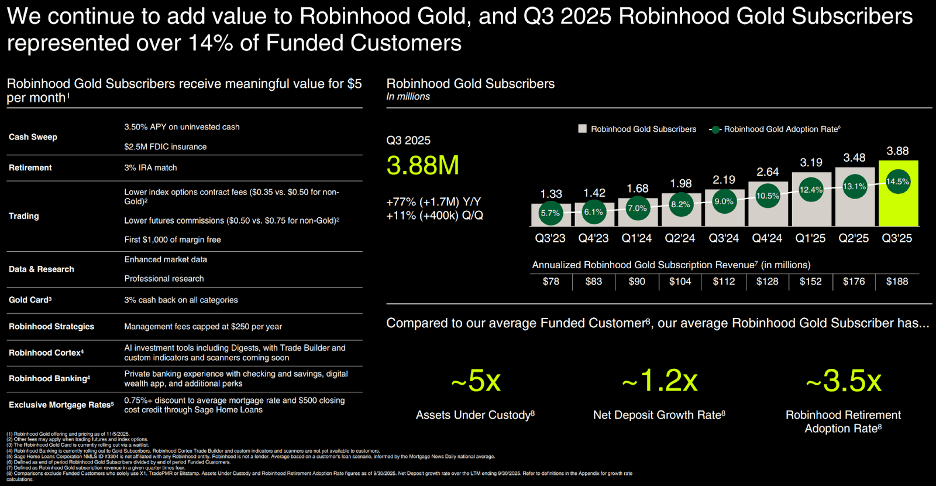
The core driver behind this acceleration in performance is a change in user structure rather than simply market conditions. The Robinhood Gold subscription business has become a key lever, with Gold member count increasing by 77% year-over-year and penetration rising to 14.5%. Among these, the "Gold Card," which offers 3% cash back, has significantly boosted user stickiness and usage frequency, indirectly elevating the proportion of active trading accounts.
Simultaneously, prediction markets have become a significant source of new trading volume. Through a partnership with Kalshi, Robinhood rapidly entered this space while regulatory risks remained relatively manageable. Management disclosed that trading volume in prediction markets reached approximately 25 billion contracts in October alone, already exceeding the total volume for the entire third quarter. Strategically, this model resembles Shopify’s early reliance on Affirm to outsource capabilities and complete its product offering—first capturing user mindshare, then discussing the long-term form.
IV.Implicit Risks:
Implicit Risk One: High Year-over-Year Base is Creating Pressure
Although current data remains strong, one must be cautious that Robinhood has entered a high-base period. The rapid growth in trading volume and revenue during 2024–2025 will create significant pressure on a year-over-year basis in the coming quarters. Even if the business remains healthy, the growth rate of revenue and profit may naturally decline, and this type of "slowdown in growth" is often interpreted by the capital market as a structural deceleration rather than a normal cyclical adjustment.
Implicit Risk Two: Cyclical Exposure of Trading Revenue
Compared to traditional brokerages, Robinhood's revenue structure is more aggressive and more volatile. Taking Charles Schwab Corporation as an example, its trading revenue accounts for only about 16% of total revenue, with main profits coming from interest and asset management; Interactive Brokers Group also has more diversified revenue streams. In contrast, Robinhood's reliance on trading activity is markedly higher, which means its performance is more sensitive to market sentiment, volatility, and retail risk preferences. The company disclosed signs of a slowdown in trading volume in November, which appears to be a cyclical signal rather than an execution problem.
V. Valuation Judgment: Growth Has Been Priced In Ahead of Time
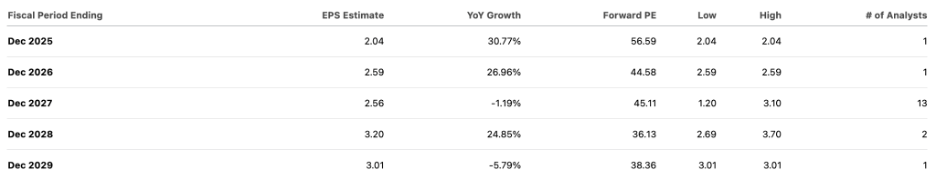
On the stock price level, market sentiment has shifted significantly. HOOD's current forward P/E ratio is approximately 45x, notably higher than its peers. Although the market generally expects revenue growth to remain close to 20% in 2026, this growth rate is insufficient to rationally explain the valuation premium of up to approximately 100% over IBKR and SCHW. Even under a more aggressive assumption that the company can maintain a 50% net margin long-term, its implied valuation is still equivalent to an upfront realization of many years of future growth. According to our calculation, a more attractive risk-reward range should be around $60, not the current level.
VI.Technical Analysis: $120 Becomes Mid-Term Resistance, Structure Shifts from Strong to Weak
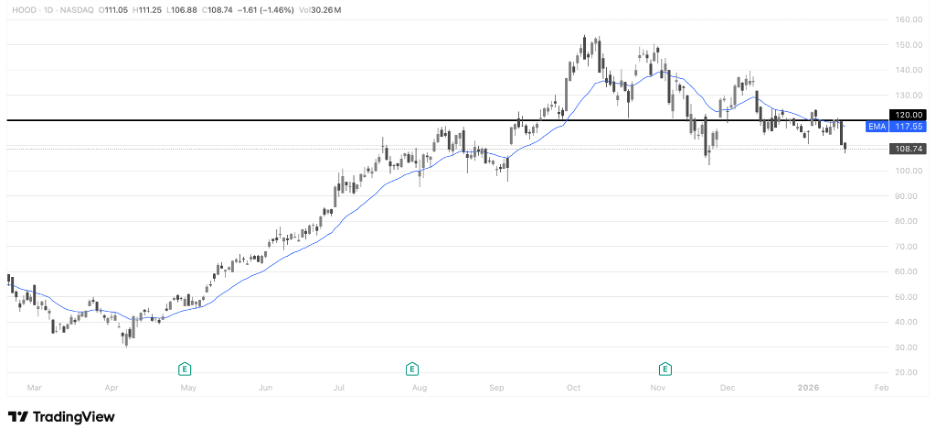
From a daily chart perspective, after completing the last major trend-driven rally, Robinhood Markets, Inc. has entered a clear stage of high-level pullback and structural weakening. Since the price retreated from its high, it has attempted to rally multiple times but has failed to reclaim the key former platform at $120. This level has transformed from its previous trend support into a clear mid-term resistance, reflecting a systematic weakening of bull power.
The current technical formation is closer to a trend correction stage after a high-level distribution, rather than a healthy strong consolidation. The technical picture continues to constrain valuation and fundamentals until the price reclaims $120 and restores the bullish alignment of moving averages. In the short term, the risk-reward structure is unfavorable for bulls.
VII. Conclusion: The Growth Story Continues, But the Price is Not Friendly
Overall, Robinhood has demonstrated clear progress in product execution, user operation, and profitability, and management's strategic direction possesses foresight. However, investment return is not determined by how "good" a company is, but by whether the current price leaves sufficient room for future growth. Against the backdrop of a high-base effect and the gradual emergence of trading cyclicality, we believe the current valuation appears tight.
Based on the above judgment, we maintain a Sell rating on HOOD.