Introduction
Brief background on swing trading: holding trades for days or weeks
Forex swing trading is a popular trading strategy that involves holding positions for days or weeks to capture price swings or fluctuations within a larger trend. This approach differs from day trading, where positions are typically opened and closed within the same trading day.
Advantages over day trading: less time intensive, flexibility
One of the main advantages of swing trading over day trading is that it requires less time and constant monitoring. Day traders often need to be actively engaged in the markets throughout the trading day, making quick decisions in response to short-term price movements. This intense focus can lead to increased stress and potential emotional trading mistakes.
In contrast, swing traders analyze longer-term trends, giving them more time to make informed decisions and potentially reducing the emotional pressure associated with frequent intraday trading.
In addition, swing trading offers greater flexibility in terms of time commitment. It is well-suited for individuals with full-time jobs or other commitments, as they can participate in the markets without being glued to their screens all the time. This flexibility also allows swing traders to adapt their strategies to different market conditions and time frames.

Source: axiory.com
Overview of key swing trading concepts
Identifying Market Trends: The first step in swing trading is to identify the prevailing market trend. This can be done using technical analysis tools such as moving averages, trendlines, and the Relative Strength Index (RSI). For example, a swing trader may observe a series of higher highs and higher lows on the price chart of a currency pair, indicating an upward trend.
Entry and exit points: Once a swing trader identifies a potential trend, they must determine appropriate entry and exit points for their trades. They often use support and resistance levels, Fibonacci retracements or candlestick patterns to determine these crucial levels. For example, a swing trader may enter a long position when the price of the currency pair bounces off a key support level.
Risk Management: Risk management is crucial in swing trading because holding positions for long periods of time exposes the trader to market fluctuations. A common approach is to use stop-loss orders to limit potential losses. For example, a swing trader might place a stop-loss order just below a key support level to protect against significant price declines.
Profit targets: Swing traders should also set profit targets based on their analysis of potential price movements. These targets can be set using resistance levels or projections from technical indicators. For example, a swing trader may decide to exit a long position when the price of the currency pair approaches a key resistance level.
Example: Swing Trading the EUR/USD Currency Pair
Suppose a swing trader analyzes the EUR/USD currency pair and identifies an upward trend using technical analysis. The trader notices a series of higher highs and higher lows, indicating that the pair is likely to continue its upward movement.
The trader decides to go long on the EUR/USD at 0.9840, which is just above a significant support level identified on the price chart. They place a stop loss order at 0.9700, below the support level, to limit potential losses if the trade goes against them.
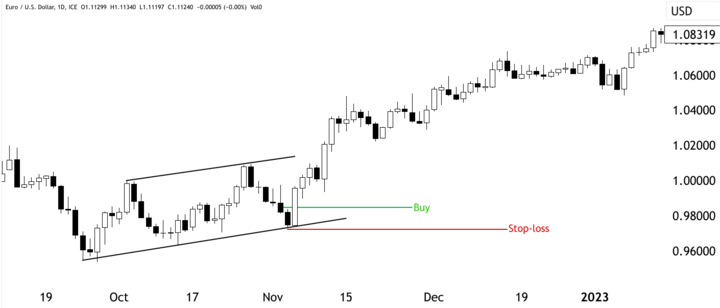
Source: tradingview.com
As the trade progresses, the price of EUR/USD begins to rise, confirming the swing trader's analysis. The trader monitors the trade closely, taking into account various factors such as economic news and geopolitical events that may affect the currency pair.
After a few days, the EUR/USD reaches the trader's profit target at 1.0540, which is an important resistance level. The trader decides to exit the trade, securing a profit of 700 pips (1.0540-0.9840). This illustrates how swing trading allows traders to capture a portion of a larger price move, resulting in potentially significant profits.
Developing a Trading Plan
To be successful in swing trading, traders must develop a comprehensive trading plan that matches their trading style, identifies appropriate markets and currency pairs, incorporates effective risk management techniques, and outlines rules for managing trades and exits.
Identifying trading style: trend following vs. mean reversion
The first step in developing a trading plan is to identify your preferred trading style. Forex swing traders typically fall into one of two categories: trend following or mean reversion traders.
Trend Following: Trend-following swing traders aim to identify and ride the prevailing market trends. They look for currency pairs with clear and sustained price movements and take positions in the direction of the trend. For example, suppose a trader observes a clear uptrend in the EUR/USD pair with a series of higher highs and higher lows. In this case, the trader may decide to enter a long position to capitalize on the upward momentum.
Mean Reversion: Mean reversion swing traders believe that prices tend to return to their average or historical mean over time. These traders look for exaggerated price movements and try to take positions that will benefit from the potential price correction.
For example, if a currency pair has experienced a sharp decline and is trading well below its historical average (such as the 200-day moving average), a mean reversion trader may decide to go long in anticipation of the price bouncing back to its mean.
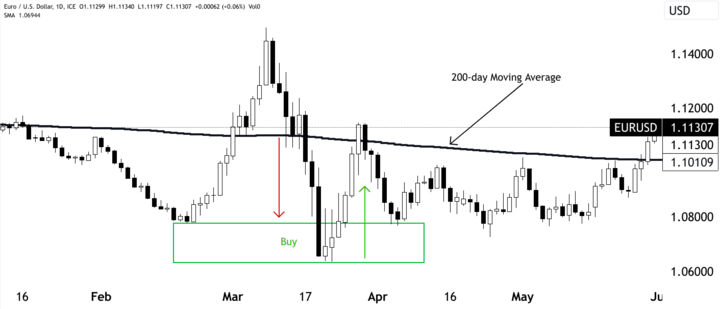
Source: tradingview.com
Selecting markets and pairs to trade
After determining your trading style, the next step is to select the markets and currency pairs you wish to trade. Forex offers a wide variety of currency pairs, each with unique characteristics and price behavior. Traders should focus on currency pairs that match their chosen trading style and have sufficient liquidity and volatility.
For example, a trend-following swing trader may prefer to focus on major currency pairs such as EUR/USD, GBP/USD, or USD/JPY, as these pairs tend to have significant trends and liquidity. On the other hand, a mean reversion trader may want to explore pairs with higher volatility and less liquidity, as these may offer more opportunities for price corrections.
Determining position sizing and risk management rules
Position sizing and risk management are critical elements of any trading plan. Swing traders must carefully determine the size of each position they take in relation to their total trading capital and establish rules to manage potential losses.
For example, a swing trader may decide to risk only 2% of his trading capital on any single trade. If their equity is $10,000, they would risk a maximum of $200 per trade. This means that if their stop loss level is set at 50 pips, they would adjust their position size to ensure that a 50 pip move would result in a $200 loss.
Setting profit targets and stop loss levels
To maintain a disciplined approach, swing traders should set clear profit targets and stop loss levels for each trade. Profit targets define the desired level of profit they aim to achieve, while stop-loss levels indicate the maximum loss they can tolerate before exiting the trade.
Source: tradingview.com
Continuing with our previous example, if a swing trader entered a long position on EUR/USD at 0.9840 and set a profit target at 1.0540, he would be looking for a profit of 700 pips. At the same time, they could set a stop loss at 0.9720, limiting their potential loss to 120 pips.
Managing trades and exits
Once a trade is active, swing traders must actively manage it based on market movements and adherence to their trading plan. This may involve trailing stop losses to lock in profits if the trade moves in their favor, or adjusting profit targets if the market shows strong momentum.
For example, if the aforementioned EUR/USD trade reaches a price of 1.0350, the swing trader might decide to move his stop loss to 0.9935 and lock in a profit of 95 pips. This way, even if the trade reverses, they would still walk away with a profit.
Trend Following Strategies
Trend-following strategies are an integral part of swing trading as they help traders identify and capitalize on prevailing market trends. In this guide, we will critically examine trend-following strategies used in forex swing trading, using specific examples to illustrate each concept.
Using moving averages to identify the direction of the trend
Moving averages are a fundamental tool in trend following strategies. These indicators calculate the average price of a currency pair over a specified period of time, smoothing out short-term fluctuations and providing a clearer view of the underlying trend. The two most commonly used moving averages are the simple moving average (SMA) and the exponential moving average (EMA).
For example, consider a swing trader analyzing the EUR/USD currency pair. They might use a combination of a 50-period EMA and a 200-period EMA on the daily chart. If the 50-period EMA crosses above the 200-period EMA, it indicates a golden cross, which suggests that an upward trend may be forming. Conversely, when the 50-period EMA crosses below the 200-period EMA, a death cross indicates a potential downward trend.
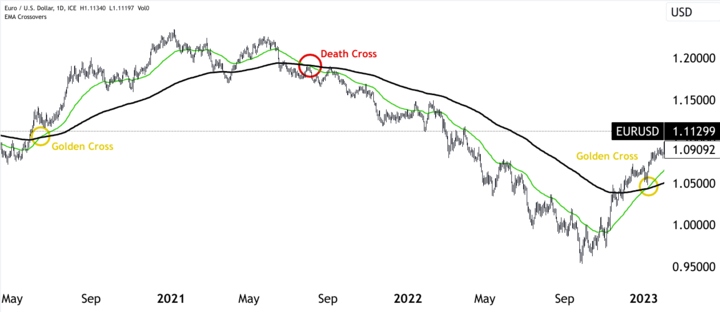
Source: tradingview.com
Trading Range Breakouts and Chart Patterns
Swing traders often look for breakouts from consolidation ranges or chart patterns as potential entry points. When a currency pair trades within a defined range, it indicates indecision in the market. A breakout occurs when the price moves beyond the boundaries of the range, indicating a potential change in trend.
For example, a swing trader might identify a consolidation period on the daily chart of the USD/JPY, with the price trading between 110.00 and 111.50. If the price breaks above 111.50, the trader could interpret this as a bullish breakout and enter a long position in anticipation of a continuation of the uptrend.
Similarly, chart patterns such as triangles, flags, and head-and-shoulders can provide entry signals for swing traders. These patterns provide clues to potential trend reversals or continuations, and traders can enter positions accordingly.
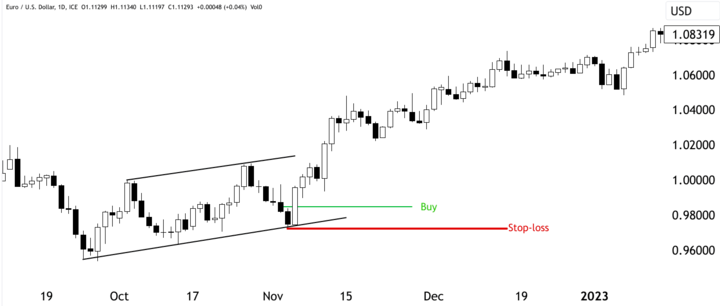
Identifying pullbacks to join uptrends
In trending markets, prices often experience short-term counter-movements called pullbacks or retracements. Swing traders can use these pullbacks to join existing uptrends at better entry points.
For example, if the EUR/USD is in a well-established uptrend with higher highs and higher lows, a swing trader might wait for a pullback to a support level before entering a long position. This allows the trader to enter the uptrend at a more favorable price, thus improving the risk-reward ratio of the trade.
Managing trades with trailing stops
Once a swing trader enters a trade, he must manage it effectively to protect profits and limit potential losses. One common method of protecting profits is the use of trailing stops. A trailing stop is a dynamic stop-loss order that adjusts as the price moves in the trader's favor.
For example, if a swing trader enters a long position on the GBP/USD at 1.4000 and sets a trailing stop of 50 pips, the stop level will move higher as the price rises. If the price rises to 1.4050, the trailing stop will adjust to 1.4000, locking in a profit of 50 pips. This way, if the price subsequently reverses, the trader will exit the trade with a profit instead of a loss.
Mean Reversion Strategies
Mean reversion traders believe that prices tend to return to their average or historical mean over time. They use overextended price movements to identify potential opportunities for price corrections.
Identifying overbought and oversold levels with the RSI
The Relative Strength Index (RSI) is a popular momentum oscillator used in mean reversion strategies to identify overbought and oversold conditions. The RSI ranges from 0 to 100 and measures the speed and change of price movements. A high RSI reading (typically above 70) indicates that the asset may be overbought, and a low RSI reading (typically below 30) indicates that the asset may be oversold.
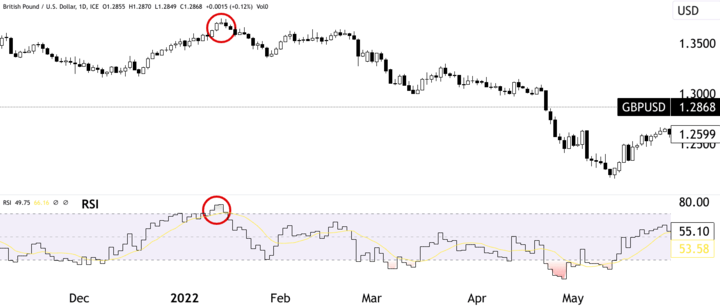
Source: tradingview.com
For example, suppose a swing trader is analyzing the GBP/USD currency pair and notices that the RSI has reached a level above 70. This indicates that the pair is potentially overbought and the trader may consider going short in anticipation of a price correction.
Eliminating price spikes with Bollinger Bands
Bollinger Bands consist of a middle moving average line, typically the 20-period SMA, and two standard deviation lines above and below the moving average. These bands dynamically expand and contract with market volatility. Mean-reversion traders use Bollinger Bands to fade price spikes that move beyond the bands, assuming that such extreme price movements are likely to revert to the moving average.
For example, consider a swing trader watching the USD/JPY currency pair. If the price of USD/JPY spikes above the upper Bollinger Band, the mean reversion trader might interpret this as an overextended move and decide to enter a short position in anticipation of the price returning to the moving average.
Trading reversals on support and resistance
Mean reversion traders often look for price reversals at significant support and resistance levels. These levels are areas where the price has historically struggled to move beyond, resulting in potential price reversals.
For example, a swing trader analyzing the EUR/USD currency pair might notice a strong resistance level at 1.2000 that the price has struggled to break above on several occasions. As the price approaches this level again, the mean reversion trader might consider entering a short position in anticipation of the price reversing lower from the resistance level.
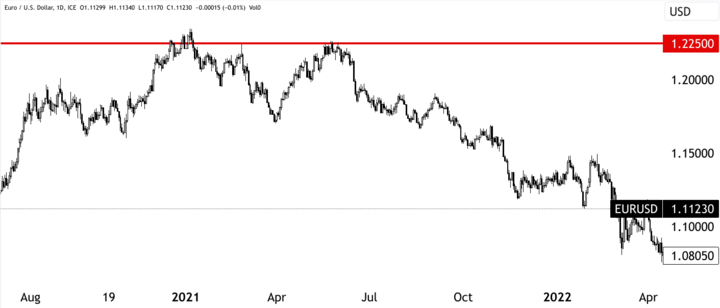
Source: tradingview.com
Similarly, as the price approaches a significant support level, such as 1.0516, the mean reversion trader might consider entering a long position in anticipation of a price reversal to the upside.
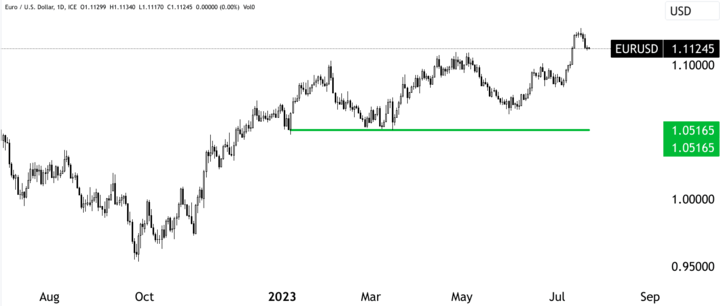
Source: tradingview.com
Exiting on validation or invalidation signals
Mean reversion strategies require careful management of trades to capitalize on potential price corrections while avoiding prolonged exposure to adverse movements. Traders often use validation or invalidation signals to determine when to exit a trade.
For example, if a mean reversion trader enters a short position on a currency pair based on an overbought RSI reading, the trader might set a profit target at the moving average or a previous support level. If the price reaches the profit target, the trade is validated and the trader exits with a profit.
Conversely, if the price moves against the trade and reaches a predetermined stop-loss level, the trade is invalidated, and the trader exits the position to limit losses.
Using Multiple Timeframes
Forex swing traders often use multiple timeframes in their analysis to gain a comprehensive view of the market and improve their entry timing.
Top-down analysis: long, medium, and short timeframes
The top-down analysis starts with the longest timeframe, usually the weekly or monthly chart, to identify the prevailing long-term trend. This allows swing traders to understand the broader market context and potential major price movements. For example, if the weekly chart of EUR/USD shows a clear uptrend with higher highs and higher lows over an extended period, this indicates a bullish bias for swing traders.
Moving down to the medium-term timeframe, such as the daily chart, swing traders can refine their analysis and identify key support and resistance levels within the established long-term trend. They can also identify potential chart patterns or trend continuation signals that could signal high-probability trade setups.
Finally, swing traders zoom in to lower timeframes, such as the 4-hour or 1-hour charts, to fine-tune their entries. This step provides more granular price information, allowing traders to find optimal entry points with tighter risk parameters. Analyzing multiple timeframes helps traders avoid trading against the prevailing higher timeframe trend and increases the likelihood of successful trades.
Improving entry timing with confluence on multiple frames
Confluence occurs when multiple technical indicators or factors align to support the same trading decision.
For example, a swing trader may observe a bullish trend on the daily chart of the GBP/USD, indicating a potential long trade. However, to improve entry timing, the trader looks for confluence with other indicators, such as a bullish crossing of moving averages on the 4-hour chart or oversold conditions on the hourly chart. When these indicators align, it strengthens the trader's conviction in the trade and provides a more robust entry point.
By combining different elements of analysis across multiple timeframes, swing traders can filter out potential false signals and focus on high probability trades with stronger market alignment.
Zooming in on lower timeframes to fine-tune entries
As mentioned earlier, lower timeframes play a crucial role in fine-tuning entries and managing trades. Once a swing trader has identified a potential trade setup on higher timeframes, he will zoom in on lower timeframes to find precise entry points and set tighter stop-loss levels.
For example, if a swing trader wants to go long on the USD/JPY based on a bullish trend (on the RSI) observed on the daily chart, he might wait for a pullback on the 4-hour chart to identify a lower risk entry point. The trader can use candlestick patterns (e.g. bullish engulfing) or support and resistance levels on the 4-hour chart to confirm the timing of his entry.
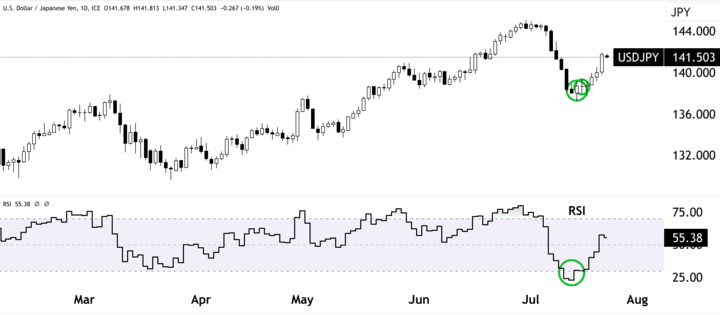
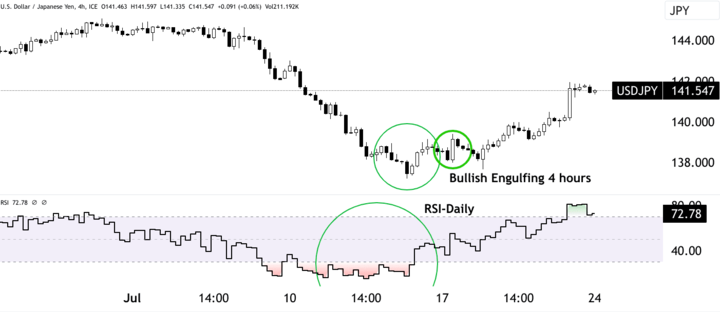
Source: tradingview.com
However, traders must be cautious when analyzing lower timeframes, as price movements on shorter intervals can be more erratic and less reliable compared to higher timeframes. Therefore, it is important to maintain a balance between analyzing higher and lower timeframes in order to make informed trading decisions.
Advanced Technical Analysis
Forex swing traders who want to enhance their trading strategies often turn to advanced technical analysis techniques.
Volume analysis to confirm price movements
Volume analysis involves studying the trading volume that accompanies price movements. Trading volume reflects the number of shares or contracts traded during a given period and provides important clues as to the strength and sustainability of a price trend.
For example, suppose a swing trader observes a currency pair such as USD/JPY experiencing a sharp uptrend with rising prices. By analyzing the volume, the trader can determine whether the price movement is supported by significant market participation. High volume during an uptrend confirms strong buying interest and lends credibility to the bullish trend. Conversely, if the price rises on low volume, it indicates weak market participation, potentially signaling a weak uptrend that may be prone to reversal.
Incorporating volume analysis into swing trading strategies can help traders confirm the validity of price movements and make more confident trading decisions.
Chart patterns such as flags and wedges to anticipate reversals
Chart patterns are formations that appear on price charts and provide valuable insight into potential trend continuations or reversals. Two common chart patterns used in forex swing trading are flags and wedges.
A flag pattern is a continuation pattern that resembles a small rectangular flag on the price chart. It occurs after a strong price move and typically represents a brief pause before the price resumes its trend. Swing traders can expect to see a bullish flag pattern in an uptrend, providing a potential opportunity to enter or add to long positions. Conversely, a bearish flag pattern in a downtrend may provide an opportunity to enter or add to short positions.
Wedges are consolidation patterns that occur when the price consolidates between two converging trend lines, forming either a rising or falling wedge. These patterns indicate potential trend reversals. Swing traders can take advantage of a falling wedge in a downtrend as it indicates easing selling pressure and a potential bullish reversal. Similarly, a rising wedge in an uptrend signals weakening buying pressure and a possible bearish reversal.
By recognizing and effectively using chart patterns, swing traders can identify potential trend continuations or reversals and time their entries and exits more accurately.
Candlestick patterns for high-probability setups
Candlestick patterns are visual representations of price movements over time. Each candlestick shows the opening, closing, high and low prices, and patterns are formed based on how these prices form shapes on the chart.
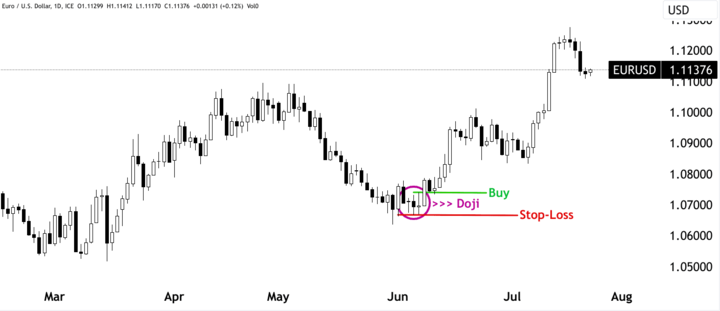
Several candlestick patterns are commonly used in Forex swing trading, such as doji, engulfing, and hammer patterns. For example, a bullish engulfing pattern occurs when a large green (bullish) candlestick completely engulfs the previous red (bearish) candlestick, indicating a potential bullish reversal. Swing traders can use this pattern as a signal to enter a long position or exit a short position.
Similarly, a doji pattern, which represents indecision in the market, can provide valuable swing trading signals. When a doji forms after a sustained uptrend, it can signal a potential trend reversal, causing swing traders to be cautious or consider taking profits on long positions.
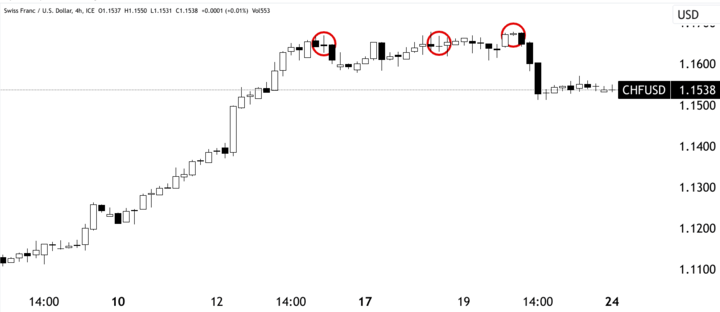
Source: tradingview.com
Candlestick patterns provide valuable insight into market sentiment and can significantly improve the accuracy of swing trading strategies.
Fundamental Analysis and Integration
Integrating fundamental analysis into Forex swing trading can greatly enhance a trader's ability to make informed decisions and capitalize on market opportunities. While technical analysis focuses on price patterns and indicators, fundamental analysis delves into the underlying economic factors that drive currency movements.
Understanding the impact of news events and data releases
News events and economic data releases can have a profound effect on the Forex market, causing significant price fluctuations. As a swing trader, it is important to understand the potential impact of these events on the currency pairs you are trading.
For example, a swing trader analyzing the EUR/USD pair may closely follow news related to the European Central Bank's (ECB) monetary policy decisions. If the ECB announces an interest rate hike, this could lead to a strengthening of the euro against the US dollar. Conversely, if the ECB hints at economic challenges and delays rate hikes, the Euro may weaken.
By staying abreast of key news events and data releases, swing traders can anticipate potential market reactions and adjust their trading strategies accordingly. Traders may decide to reduce position sizes or exit trades ahead of major news announcements to avoid increased volatility and uncertain price movements.
Using the economic calendar for trade timing
An economic calendar is an essential tool for swing traders looking to incorporate fundamental analysis into their trading strategy. Economic calendars provide a schedule of upcoming economic data releases, central bank announcements, and other important events that can influence currency prices.
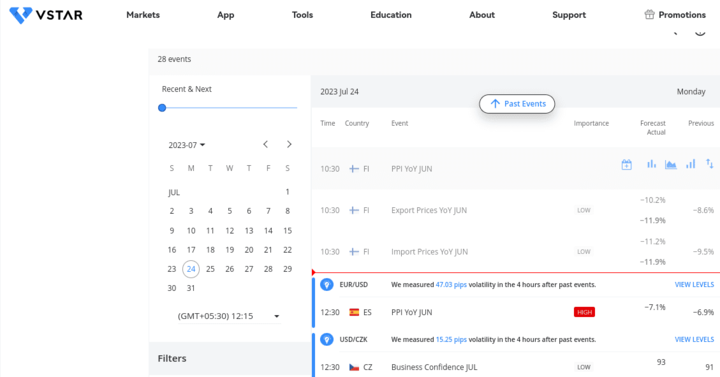
Source: vstar.com
For example, a swing trader analyzing the GBP/USD pair may consult the economic calendar to determine the release date of the UK's GDP growth data. Strong GDP growth figures may lead the market to anticipate possible interest rate hikes by the Bank of England, leading to a possible appreciation of the British Pound. Armed with this information, the trader can plan their trades around the event and ensure that they are well positioned to take advantage of any price movements that occur following the data release.
Macro analysis of growth, inflation, and monetary policy
Conducting macroeconomic analysis is critical for swing traders who want to understand the broader economic forces that influence currency movements. Macroeconomic indicators such as GDP growth, inflation rates, and central bank policy provide valuable insight into a country's economic health and the potential direction of its currency.
For example, a swing trader analyzing the USD/JPY pair may examine U.S. economic data such as unemployment rates and consumer spending to assess the strength of the U.S. economy. In addition, they might study the Bank of Japan's monetary policy statements to understand how the central bank's actions might affect the Japanese yen.
By conducting macro analysis, swing traders can develop a fundamental bias for a currency pair that supports their technical analysis findings and overall trading strategy. Combining both technical and fundamental analysis allows traders to make more informed decisions, resulting in potentially higher probability trades.
Risk Management Essentials
Risk management is a fundamental aspect of successful forex swing trading. It involves implementing strategies to protect capital, manage potential losses, and ensure a disciplined approach to trading.
Appropriate position sizing based on volatility and account size
Position sizing refers to determining the amount of capital to allocate to each trade. It is important to set appropriate position sizes based on the trader's risk tolerance and account size.
For example, if a swing trader has a $10,000 trading account and is willing to risk 2% of his capital on each trade, the maximum amount he should risk per trade is $200 (2% of $10,000). The trader then adjusts the position size based on the stop loss level to ensure that if the stop loss is hit, the loss is limited to the predetermined amount of $200.
It is also important to consider the volatility of the currency pair being traded. Highly volatile pairs may require smaller position sizes to avoid excessive exposure to market fluctuations, while less volatile pairs may allow for larger position sizes.
Using stop loss on every trade
A stop-loss order is an essential risk management tool that helps protect traders from significant losses in adverse market conditions. It is an order placed with a broker to automatically exit a trade when the price reaches a certain level.
Source: tradingview.com
For example, if a swing trader enters a long position on EUR/USD at 1.0740, he can set a stop loss at 1.0665. If the price moves against the trader and reaches 1.0665, the trade is automatically closed, limiting the potential loss to 75 pips.
Using stop losses ensures that traders do not become emotionally attached to their trades and prevents catastrophic losses that can wipe out a significant portion of their trading capital. It is important to set stop losses at logical levels based on technical analysis and risk management principles.
Maintaining a 2:1 or higher risk/reward ratio
The risk/reward ratio is an important metric in Forex swing trading. It measures the potential reward of a trade in relation to the potential risk. For example, if a trader enters a long position with a stop loss of 50 pips and a profit target of 100 pips, the risk/reward ratio is 1:2 (100 pips of potential profit minus 50 pips of potential loss).
Maintaining a risk/reward ratio of 2:1 or higher is important because it allows traders to be profitable even if they have a win rate of less than 50%. For example, if a trader has a win rate of 40% and consistently maintains a risk-reward ratio of 2:1, he can still be profitable over the long term.
A favorable risk/reward ratio is achieved by setting profit targets that are at least twice the size of the stop loss. This ensures that the potential reward justifies the risk taken on each trade and provides a buffer for potential losing trades.
Hedging correlated positions to reduce risk
Hedging is a risk management technique that involves opening offsetting positions to reduce overall risk. In Forex trading, it can be used to manage exposure to currency pairs that are highly correlated.
For example, if a trader has both a long position in GBP/USD and a long position in EUR/USD, he has exposure to the US dollar in both trades. If the US dollar experiences significant volatility or an unexpected event, both trades could be affected in the same direction.
To reduce this risk, the trader may choose to hedge one of the positions by opening a position that offsets the exposure. In this case, the trader could open a short position on USD/JPY, which is negatively correlated with GBP/USD and EUR/USD, effectively neutralizing the US dollar exposure.
Hedging can help manage risk in volatile or uncertain market conditions and provide an additional layer of protection for traders' portfolios.
Trading Psychology
Trading psychology plays a crucial role in Forex swing trading and can have a significant impact on a trader's success. Emotions can often lead to impulsive and irrational decisions that can result in costly trading mistakes.
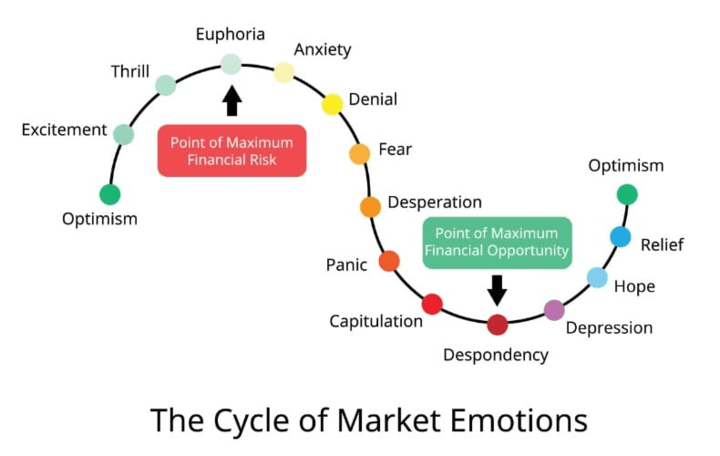
Source: ifcmarkets.com
Developing discipline, patience, and emotional control
Discipline, patience, and emotional control are fundamental traits that successful forex swing traders must cultivate. Swing trading involves holding positions for days or weeks, and during this time traders may experience market fluctuations that can trigger emotional responses.
For example, if a swing trader enters a long position in a currency pair and the price begins to move against them, fear and anxiety may cause them to close the trade early to avoid further losses. Conversely, if the trade is profitable, greed may encourage the trader to hold on to the trade longer than originally planned in hopes of making even larger profits.
To counter these emotional impulses, traders must stick to their trading plans and predefined risk management rules. This requires discipline to execute trades based on objective analysis and patience to allow the trade to unfold according to the original plan. Emotional control is essential to avoid making impulsive decisions driven by fear or greed.
Managing fear and greed: fighting the instinct to chase or bail out
Fear and greed are two dominant emotions that can significantly affect a trader's decision-making process. Fear of losing money can lead to hesitation or avoidance of potentially profitable trades, while greed can lead to chasing high-risk opportunities in the hope of quick profits.
For example, if a swing trader misses an entry point because he is afraid the trade will go against him, he may feel compelled to chase the trade once it begins to move in his favor. However, chasing trades can lead to entry at unfavorable prices and increased risk.
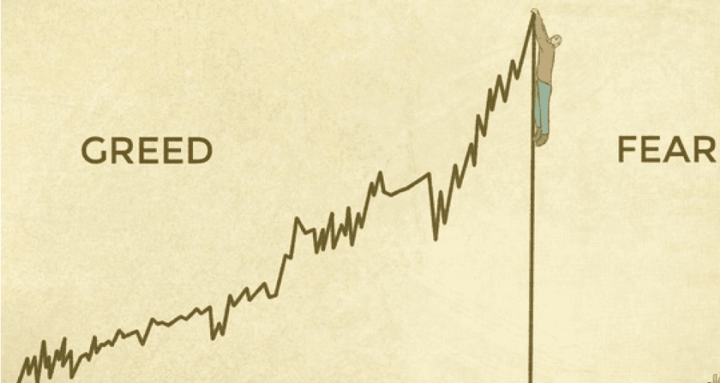
Source: icmarkets.com
Similarly, greed may lead a trader to hold on to a winning trade for too long, hoping for even more profits. However, failing to take profits at appropriate levels can result in giving back gains when the market reverses.
To manage fear and greed, traders must stick to their trading plans and avoid making emotional decisions. Having a clear set of rules for entering and exiting trades, along with predetermined profit targets and stop losses, can help mitigate the influence of fear and greed on trading decisions.
Reviewing the trading journal to identify strengths and weaknesses
Keeping a detailed trading journal is a valuable practice for forex swing traders. A trading journal helps to document each trade's rationale, entry and exit points, profit or loss, and emotional reactions during the trade.
By regularly reviewing the trading journal, traders can identify patterns and gain insight into their strengths and weaknesses. For example, a trader may find that he or she is more successful when following a trading plan and exercising discipline, but is more likely to lose money when making impulsive, emotion-driven decisions.
This self-reflection allows traders to make necessary adjustments to their trading strategies and improve their decision-making over time. It also helps to identify recurring errors or biases that may be hindering trading performance.


Conclusion
In conclusion, forex swing trading is a popular and potentially lucrative trading strategy that can be mastered with a combination of adaptability, solid analysis, and disciplined risk management.
Successful swing trading requires adaptability and solid strategies
One of the main reasons swing trading is favored by many traders is its adaptability. Swing traders can take advantage of both rising and falling markets by identifying opportunities within larger trends. This flexibility allows traders to adjust their strategies based on changing market conditions and avoid becoming overly reliant on any one approach.
In addition, successful swing traders often employ sound strategies that combine multiple technical and fundamental analysis tools. By using a combination of indicators, chart patterns and economic data, swing traders can gain a comprehensive understanding of the market and make informed decisions. This multifaceted approach helps traders validate potential trade setups and increases the likelihood of profitable trades.
Leverage technical and fundamental analysis to find opportunities
The integration of both technical and fundamental analysis is crucial for swing traders seeking a holistic view of the forex market. Technical analysis allows traders to assess historical price patterns, trends and market sentiment, while fundamental analysis provides insight into the underlying economic factors that drive currency movements.
For example, a swing trader considering going long on a currency pair might analyze the price chart of the pair using technical indicators such as moving averages and chart patterns. At the same time, they would consult an economic calendar to be aware of upcoming data releases and central bank announcements that could affect the trade.
By combining technical and fundamental analysis, swing traders can develop a more robust understanding of the market and improve the accuracy of their trading decisions.
Utilize robust risk management for long-term profitability
Perhaps the most crucial aspect of successful swing trading is robust risk management. Swing traders must carefully manage their capital, position sizes, and stop-loss orders to protect against potential losses and ensure long-term profitability.

Source: medium.com
Position sizing based on account size and volatility allows traders to avoid overexposure to the market, reducing the impact of losing trades on their overall capital. Placing stop-loss orders on every trade helps limit potential losses and prevents emotional decisions driven by fear or greed.
In addition, maintaining a favorable risk/reward ratio ensures that potential profits outweigh potential losses, even if the trader's win rate is less than 50%. This risk management technique is essential to maintaining long-term profitability.
A critical aspect of risk management is the ability to recognize and manage emotions. Developing discipline, patience, and emotional control helps traders stick to their trading plans and avoid making impulsive decisions based on fear or greed.
Finally, maintaining a trading journal allows traders to review their past trades, identify strengths and weaknesses in their trading strategies, and make necessary adjustments for improvement.