
I. Introduction
A Brief background on GBPUSD trading
The GBPUSD currency pair is one of the most heavily traded instruments in the foreign exchange market and is renowned for its liquidity and volatility. Traders are drawn to this currency pair due to its potential for significant profits, but navigating its price movements can be a challenging task. In this analysis, we will delve into five specific GBPUSD trading strategies: Trading the Breakout, Fading the Fakeout, Trading the Trend Pullback, Trading Hidden Divergence, and Reversing at Historic Levels.
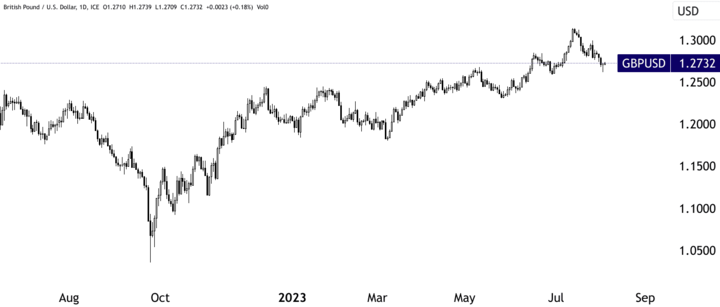
Source: tradingview.com
Overview of example trades covered
Trading the Breakout:
A breakout occurs when the GBPUSD price breaches a significant level of support or resistance. Traders using this strategy aim to capitalize on the momentum generated by the price's breakthrough, expecting a continuation of the trend.
Fading the Fakeout:
As tempting as breakouts may seem, they often prove to be false signals, leading to sharp reversals. Fading the fakeout involves taking a contrarian approach, where traders anticipate a price reversal after a false breakout.
Trading the Trend Pullback:
Trend pullbacks occur when a strong trend experiences a temporary reversal before resuming its original direction. Skilled traders seek to enter positions during these pullbacks as they offer attractive risk-reward ratios.
Trading Hidden Divergence:
Divergence is a concept in technical analysis where the price of an asset diverges from the movement of an oscillating indicator, such as the Relative Strength Index (RSI). Hidden divergence occurs when the price makes a higher high or lower low while the indicator does the opposite. In GBPUSD trading, hidden divergence signals potential trend continuation.
Reversal at the Historic Level:
Historic levels are significant price zones that have acted as strong support or resistance in the past. Traders closely monitor these levels as they can influence future price movements. When the GBPUSD approaches a historic level, traders watch for signs of a potential reversal.
II. Trading the Breakout
A breakout trading strategy is a popular approach used by forex traders to capitalize on significant price movements that occur when a currency pair breaks through key levels of support or resistance. In the context of GBPUSD trading, identifying range resistance and effectively managing the trade with a trailing stop can be essential to success.
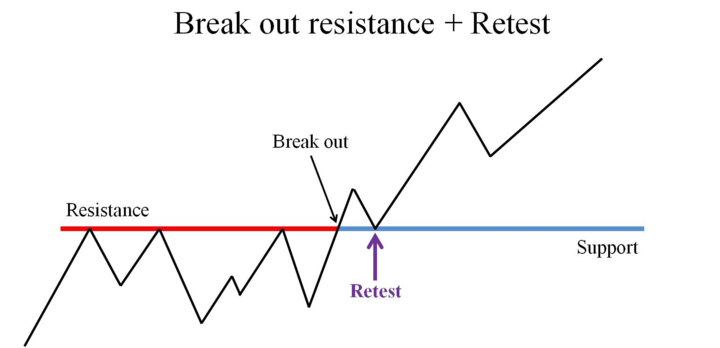
Source: howtotradeblog.com
Identifying range resistance in GBPUSD
Before implementing a breakout strategy, traders need to identify the range within which the GBPUSD has been trading. A range is formed when the currency pair moves between defined upper and lower boundaries without establishing a clear trend. Traders can use various technical analysis tools, such as horizontal support and resistance lines, to determine the range's boundaries.
For instance, suppose the GBPUSD has been trading in a range between 1.2725 and 1.2745. Traders would closely monitor these levels as potential breakout points. The upper boundary at 1.2745 acts as resistance, preventing the price from rising higher, while the lower boundary at 1.2725 serves as support, preventing the price from declining further.
Buying the breakout above the range high
Once the trader identifies the range and the resistance level, they can execute the breakout strategy. When the GBPUSD price convincingly breaches the range high (1.2745 in this example), a breakout occurs. This signifies potential bullish momentum and a shift from the previous range-bound trading.
Traders who want to capitalize on this breakout would enter a long position (buy) above the range high, ideally after confirming the breakout with a strong close above 1.2745 on the price chart. The logic behind buying the breakout is that the price has demonstrated enough strength to surpass the previous resistance level, indicating a potential continuation of the upward trend.
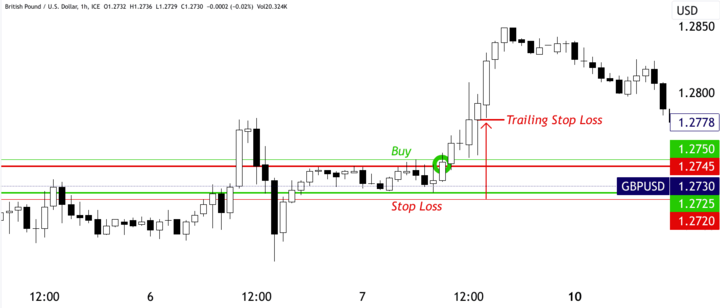
Source: tradingview.com
Managing trades with trailing stops
While buying the breakout can be rewarding, it also involves risks, as some breakouts can be false signals or lead to short-lived price spikes. Therefore, it is crucial to manage the trade effectively, and one common method is by using a trailing stop.
A trailing stop is a dynamic stop-loss order that adjusts with price movement. As the GBPUSD price advances in the anticipated direction, the trailing stop automatically moves the stop-loss level in the same direction. This allows traders to lock in profits and protect their gains if the price reverses.
For example, if a trader bought the GBPUSD at 1.2750 (above the breakout point) and set a trailing stop of 50 pips, the initial stop-loss would be placed at 1.2720 (1.2750 minus 30 pips). As the price rises, the trailing stop will adjust accordingly. If the price reaches 1.2830, the trailing stop would move up to 1.2780 (1.2750 + 30 pips).
The trailing stop's advantage is that it allows traders to stay in the trade as long as the price maintains its upward momentum while also safeguarding against significant losses if the price unexpectedly reverses.
III. Fading the Fakeout
Fading the fakeout is a counter-trend trading strategy that involves taking a contrarian approach when a currency pair, such as GBPUSD, experiences a false breakout. Traders employing this strategy seek to capitalize on the market's overreaction to a breakout that fails to sustain itself, leading to a quick reversal.
False breakout above the key level in GBPUSD
False breakouts occur when the price of a currency pair breaches a significant level of support or resistance, creating the appearance of a potential trend continuation, only to swiftly reverse back within the previous range. Traders need to exercise caution and avoid being lured into taking positions by such false signals.
To identify false breakouts in the GBPUSD, traders must conduct a thorough analysis of the price action, market sentiment, and key technical indicators. For example, if the GBPUSD has been consolidating within a range between 1.2075 and 1.1930 and the price suddenly breaks down above 1.1930 but fails to maintain its downward momentum and retreats above stop loss level, it could be a false breakout.
Buying/Selling the return into range
Once traders recognize a false breakout, they initiate positions in the opposite direction of the apparent trend. In the case of the GBPUSD, if the price fails to sustain the break down below 1.1930 and retreats back into the range, traders would consider buying (going long) the currency pair.
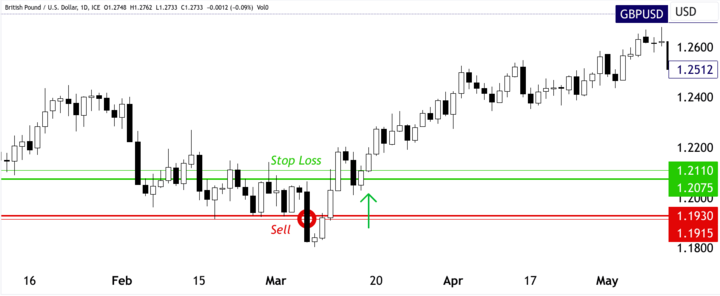
Source: tradingview.com
The rationale behind buying/selling the return into range is based on the expectation that the market has overreacted to the initial breakout and that the price will likely revert to its previous range-bound conditions. Traders might enter long positions near the lower boundary of the range, around 1.1930, with a target to profit from the upward move back toward the upper boundary, around 1.2075.
Taking quick profits on reversals
Fading the fakeout involves taking quick profits, as the objective is to benefit from the market's rapid reversal. Traders should set realistic profit targets and be prepared to close their positions swiftly once the price begins to move in the anticipated direction. This approach ensures that profits are locked in before the price potentially stabilizes or retraces.
As with any trading strategy, risk management is crucial. Traders must also determine an appropriate stop-loss level to limit potential losses if the price does not reverse as expected and continues in the false breakout direction. Additionally, it is essential to remain vigilant for signs of a true breakout, as misinterpreting a true breakout as a false one can lead to missed opportunities.
IV. Trading the Trend Pullback
The trend pullback trading strategy is a powerful technique used by forex traders to capitalize on established trends while mitigating the risk of entering the top or bottom of the market.
GBPUSD is establishing a trend
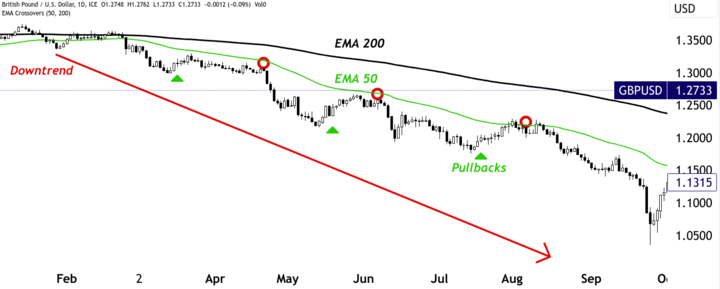
The first step in the trend pullback strategy is identifying the presence of an uptrend or downtrend in the GBPUSD currency pair. For instance, a downtrend is characterized by a series of lower highs and lower lows on the price chart, indicating that the sellers are in control and the overall direction of the market is downward.
To establish a downtrend, traders often use technical analysis tools such as trendlines and moving averages. For example, if the GBPUSD has been forming lower highs and lower lows over a significant period and a trendline drawn along these highs shows a clear downward slope, it suggests a prevailing downtrend.
Source: tradingview.com
Selling pullbacks to the moving average
Once the downtrend is confirmed, traders employing the trend pullback strategy seek to enter the market during temporary retracements against the overall trend. These retracements, or pullbacks, often occur when the price experiences a brief bounce upward before resuming its downtrend.
To identify potential selling opportunities, traders use moving averages, such as the 50-day or 200-day moving average. A pullback to the moving average indicates temporary relief for the bulls and a possible area of resistance for the currency pair. If the GBPUSD pulls back to the moving average and shows signs of price stabilization, traders might consider entering short positions (selling) in anticipation of the downtrend's continuation.
Riding the downtrend for an extended move
The primary goal of the trend pullback strategy is to ride the downtrend for an extended period, maximizing profits as the price continues its downward trajectory. Traders must exercise patience and discipline during this phase, allowing the trend to play out and avoiding the temptation to exit prematurely.
To manage the trade effectively, traders may use technical indicators like the Average True Range (ATR) to set reasonable profit targets and stop-loss levels. Profit targets can be placed at strategic levels of support or previous lows, where the price may encounter potential obstacles or reversals. A trailing stop-loss can also be employed to protect profits while giving the trade room to breathe if the trend continues in the desired direction.
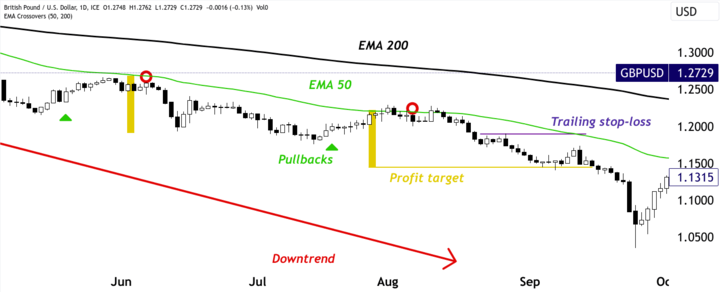
Example:
Suppose the GBPUSD has been trending lower, and the 50-day moving average (green line) serves as a dynamic resistance level during pullbacks. The price pulls back to the 50-day moving average at 1.2200, indicating a potential selling opportunity. A trader enters a short position at 1.2200, expecting the downtrend to resume. The trader sets a profit target at 1.1450, a key support level, and a trailing stop-loss at 1.1900, allowing for some potential retracement while safeguarding profits.
Source: tradingview.com
V. Trading Hidden Divergence
Hidden divergence is a powerful forex trading strategy that allows traders to spot potential trend continuations amid price retracements
The GBPUSD price makes a higher high
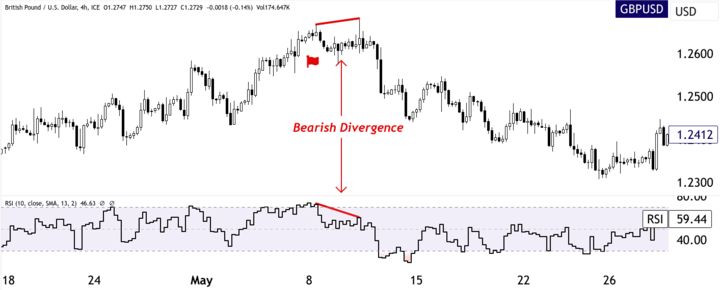
Hidden divergence occurs when the price of an asset, in this case, GBPUSD, forms a higher high or lower low, but the momentum indicator, such as the Relative Strength Index (RSI) or Moving Average Convergence Divergence (MACD), shows the opposite pattern. This indicates a potential continuation of the existing trend, despite the price retracement.
To identify hidden divergence, traders need to analyze both the price chart and the selected momentum indicator. For instance, in a downtrend, if the GBPUSD price forms a higher high while the momentum indicator records a lower high, it suggests a hidden bullish divergence. Conversely, in an uptrend, if the price establishes a lower low while the momentum indicator records a higher low, it indicates a hidden bearish divergence.
The Momentum indicator shows a lower high
To effectively execute the hidden divergence strategy, traders often use momentum indicators to confirm the lower high in the context of an established downtrend. The RSI and MACD are two common indicators used for this purpose.
Source: tradingview.com
For example, if the GBP/USD has initiated a downtrend and the price retraces, forming a higher high at 1.2680, traders would observe the momentum indicator for confirmation. If the RSI or MACD shows a lower high at the same time, it validates the presence of a hidden bearish divergence.
Trading the divergence with a short trade
Once the hidden divergence is identified and confirmed, traders can consider executing short trades to capitalize on the potential continuation of the downtrend. The strategy involves selling the GBP USD currency pair, anticipating a downward move.
Traders may choose to enter short positions at the market price, or they might wait for additional confirmation signals, such as bearish candlestick patterns or price action at key resistance levels. Risk management is crucial, and traders should place stop-loss orders above the recent high to limit potential losses if the trade does not play out as expected.
VI. Reversal at the Historic Levels
Reversal at historic levels is a forex trading strategy that involves identifying significant historical support or resistance levels in a currency pair, such as GBP/USD, and looking for reversal signals to enter positions at potential turning points.
GBPUSD reaches major historic support
To effectively implement the reversal at historic levels strategy, traders must first identify major historic support levels on the GBP USD price chart. Historic support levels are areas where the price has consistently found buying interest in the past, preventing it from falling further. These levels often act as psychological barriers and influence market sentiment.
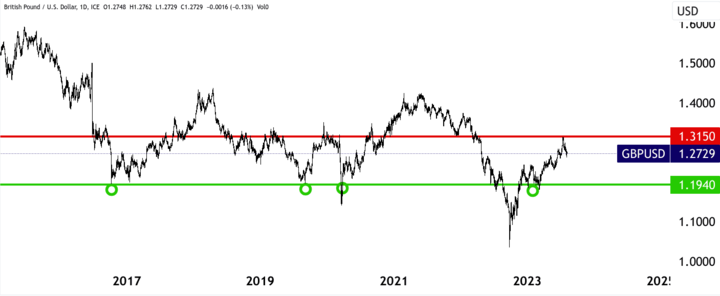
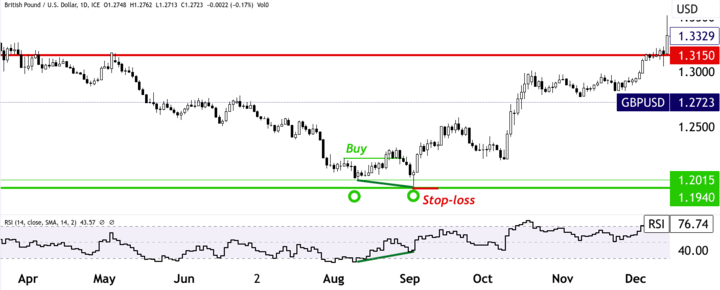
Traders can use various technical analysis tools, such as horizontal support and resistance lines, Fibonacci retracement levels, and pivot points, to pinpoint historic support levels. For example, if the GBPUSD has repeatedly bounced off the 1.1940 level over several years, it is considered a major historic support level.
Source: tradingview.com
Structure and momentum shift signals reversal
Once a major historic support level is identified, traders focus on the structure and momentum shift of the GBPUSD price action to determine potential reversal signals. A reversal at a historic level is more likely to occur if the price shows signs of exhaustion and a shift in momentum.
Traders look for specific price patterns, candlestick formations, and momentum indicators to validate the potential reversal. For example, a bullish reversal pattern like a double bottom or a bullish engulfing candlestick pattern near the historic support level strengthens the signal. Additionally, momentum indicators like the RSI or Stochastic Oscillator turning upwards from oversold territory can confirm the shift in momentum.


Going long at key support for swing trading
Once the trader identifies a potential reversal setup, they can execute long positions (go long) at the key historic support level, anticipating a price bounce and trend reversal. The objective of this strategy is to catch the initial stages of a potential uptrend, known as a swing trade, where traders aim to capture substantial price movements over a few days to weeks.
Risk management is crucial when executing long positions at key support levels. Traders should place stop-loss orders below the historic support level to limit potential losses if the price breaks down instead of rebounding. Profit targets can be set at previous resistance levels or areas of potential significant resistance where the price may encounter obstacles during the reversal.
Example:
Suppose the GBPUSD has reached a major historic support level at 1.1940 and the price action shows signs of a bullish reversal, forming a double-bottom pattern at 1.2015. The RSI also exhibits a bullish divergence, indicating a potential shift in momentum. A trader identifies this setup and enters a long position at 1.2210, just above the historic support level, with a stop-loss at 1.1955 to manage risk. The trader sets a profit target at 1.3150, a previous resistance level.
Source: tradingview.com
VII. Conclusion
In this comprehensive analysis of various forex trading strategies for GBPUSD, we explored five distinct approaches: Trading the Breakout, Fading the Fakeout, Trading the Trend Pullback, Trading Hidden Divergence, and reversing at the historic level. Each strategy comes with its own unique set of advantages and challenges, providing traders with diverse tools to navigate the dynamic forex market.
Summarizing key concepts demonstrated
The first strategy, Trading the Breakout, involves capitalizing on significant price movements after a currency pair breaches key levels of support or resistance. Fading the Fakeout: The second strategy focuses on taking a contrarian approach during false breakouts and riding the subsequent price reversals.
Trading the Trend Pullback, the third strategy aims to enter positions during temporary retracements within an established trend. Trading Hidden Divergence, the fourth strategy, leverages divergences between price and momentum indicators to identify potential trend continuations.
Finally, Reversal at the Historic Level, the fifth strategy, revolves around identifying major historical support or resistance levels and executing positions at potential turning points.
Importance of combining different setups
While each strategy has its merits, no single approach guarantees success in the forex market. Market conditions are ever-changing, and no strategy works flawlessly in all situations. Traders need to be flexible and willing to adapt their tactics based on prevailing market dynamics.
Combining different setups and technical indicators can provide a more comprehensive view of the market, increasing the probability of profitable trades. For instance, a trader may use multiple timeframes, oscillators, trendlines, and candlestick patterns to complement their analysis and generate more robust trading signals.
Need for discipline in trade management
Regardless of the strategy employed, discipline in trade management is paramount. Trading involves emotions, and emotions can cloud judgment and lead to impulsive decisions. Effective trade management includes setting clear entry and exit points, adhering to risk management principles, and staying objective amidst market fluctuations.

Source: earn2trade.com
Traders should always have a trading plan in place, outlining their strategy, risk tolerance, and profit targets. They must follow their plan rigorously and avoid chasing trades, revenge trading, or overexposing their capital. Staying disciplined and sticking to a well-thought-out plan can help traders stay on track and manage risk effectively.