Price action trading is a popular and effective trading strategy that traders across the world widely use. It is a trading methodology that involves analyzing and interpreting the market based on price movement alone, without using any indicators or other technical analysis tools.
The basic premise of price action trading is that the price reflects all the information that is available in the market, and therefore, studying the price patterns and chart formations can provide valuable insights into the market's direction.
Using a price action trading strategy is crucial for you while you are up to unlock profit potential.
One of the most important benefits of using a price action trading strategy is that it helps you to develop a disciplined and patient approach to trading. Price action traders are trained to wait for the right opportunity to enter the market and to avoid impulsive trades based on emotions or market noise. By doing so, they can minimize their risk exposure and maximize their profits.
To unlock the profit potential of price action trading, you must master advanced techniques such as chart pattern analysis, candlestick patterns, and trend analysis. Also, you must develop a deep understanding of market psychology, as price action trading is heavily influenced by human behavior and emotions.
Basic Principles of Price Action Trading
If you're looking to take your trading game to the next level, then advanced price action trading techniques may be just what you need.
Price action trading is a popular approach that involves analyzing the movement of prices on a chart to make informed trading decisions. The basic principles of price action trading involve trend recognition, support and resistance levels, candlestick patterns, and price structure.
A. Trend recognition
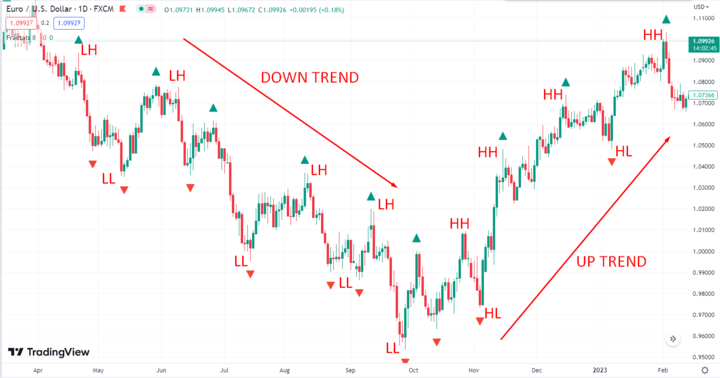
First, trend recognition is crucial. In an uptrend, you want to identify higher highs and higher lows, while in a downtrend, you want to identify lower lows and lower highs.
By doing so, you can determine the market's overall direction and potentially make profitable trades. The ideal approach is to wait for an up trend and look for long trades only. Similarly, on a downtrend, any short opportunity could provide a higher success rate.
B. Support and resistance levels
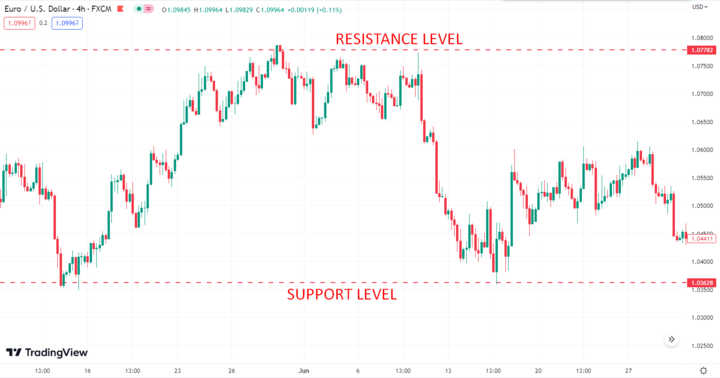
Another key principle is identifying support and resistance levels on a chart. These levels represent areas where the price has historically had difficulty breaking through or bouncing back.
You can determine potential entry and exit points for your trades using these levels. These levels represent traders' emotions and the price is likely to repeat the behavior once it touches these zones.
C. Candlestick patterns
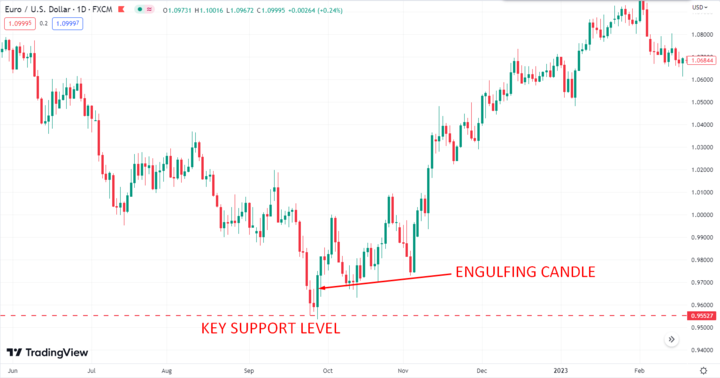
Candlestick patterns are another important aspect of price action trading. You can identify potential trade opportunities by understanding the meaning of different candlestick patterns.
For example, a bullish engulfing pattern may indicate a potential reversal from a downtrend to an uptrend, while a bearish harami pattern may signal the opposite.
D. Price structure
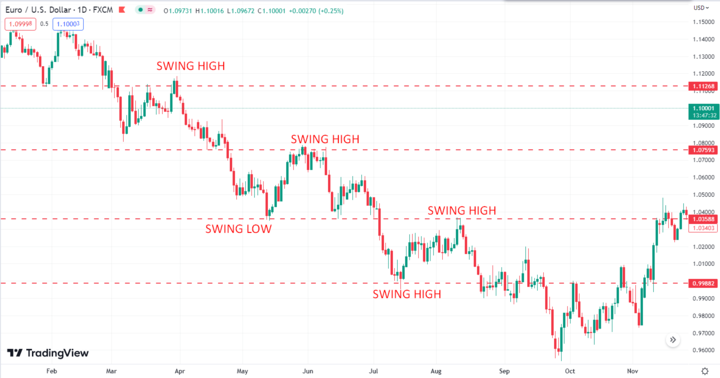
Price structure can also be used to identify trends and potential reversals. This involves understanding basic terminology such as swing highs and lows, as well as support and resistance zones.
By analyzing the structure of price movements, you can gain insights into the underlying market sentiment and make informed trading decisions.
Choosing the right time frame
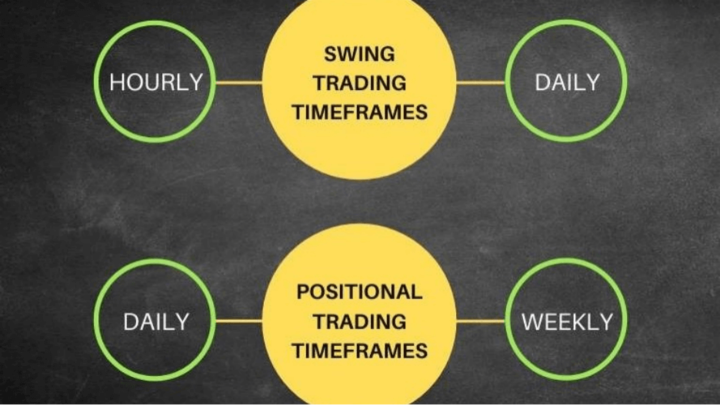
One of the most important decisions you need to make is choosing the right time frame. Understanding the different timeframes is critical to selecting the most appropriate one for your strategy.
However, most professional traders prefer to trade on higher time frames, like - H1, H4, D1, or W1. Investors usually use the higher timeframe to seek market direction and use lower time frames to open or close positions.
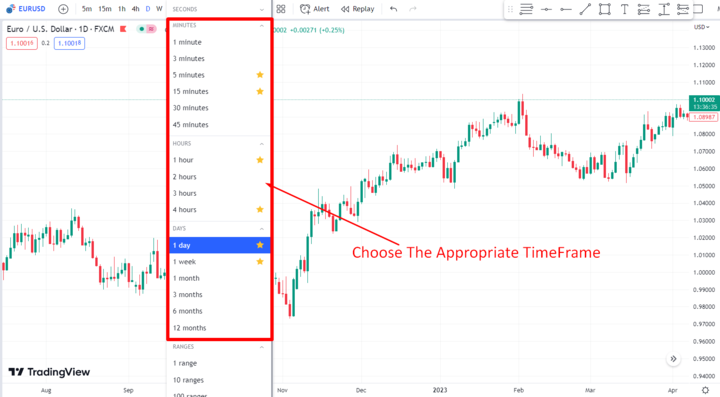
A. Understanding the different timeframes
First, let's understand the different timeframes. There are short-term timeframes, such as 1-minute, 5-minute, and 15-minute charts, which are used for short-term trades. There are also longer timeframes, such as daily, weekly, and monthly charts, which are used for long-term trades.

For short-term trades, it's essential to use shorter timeframes to identify trends and patterns that may occur quickly. These charts are ideal for day traders who are looking to take advantage of short-term price movements in the market.
On the other hand, it's best to use longer timeframes for long-term trades as they provide a broader view of the market and help identify long-term trends.
B. How to select the most appropriate timeframe for the strategy
To select the most appropriate timeframe for your strategy, you need to analyze the market environment and understand the current trend. Determine whether the market is in an uptrend, downtrend, or sideways trend.
This will help you choose the most appropriate time frame that suits your trading style.
Moreover, you should also consider your risk tolerance and trading style when selecting a timeframe. If you are a conservative trader, you may prefer longer timeframes as they provide more stable trends and patterns.
If you are a more aggressive trader, shorter timeframes may be suitable for you as they offer more opportunities for quick profits.
Entry Strategies
We'll cover some of the most effective entry strategies that can help you improve your trading results.
A. Breakout trading
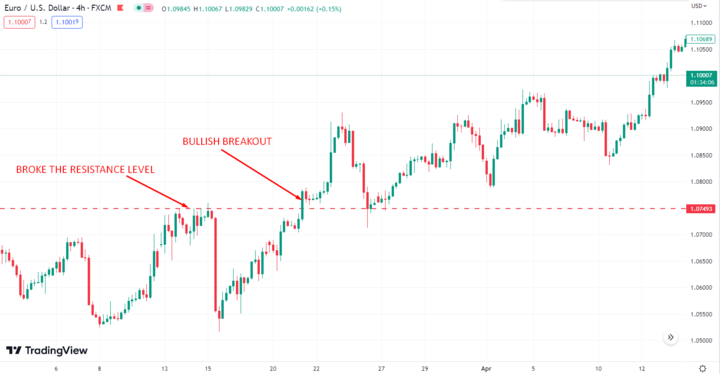
A key concept in price action trading is identifying key support and resistance levels. These are price levels where the market has historically struggled to move beyond or has found support. One effective entry strategy is breakout trading, which involves entering a trade when the price breaks through a key level of support or resistance. This can be a powerful signal that the market is ready to move in the direction of the breakout.
B. Pullback trading
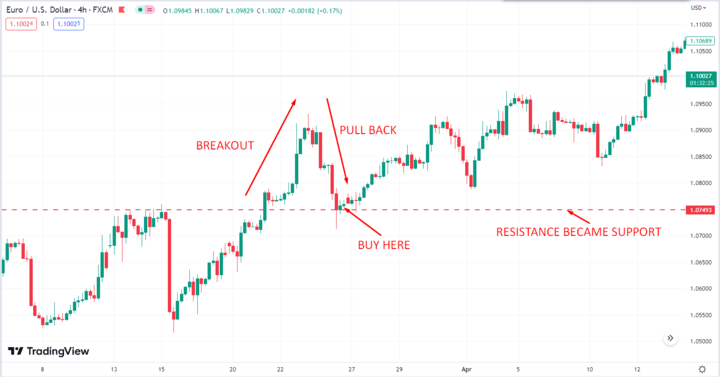
Another entry strategy is pullback trading, which involves waiting for the price to pull back to a key level of support or resistance before entering a trade.
This approach can help you get a better entry price and reduce risk by entering the trade when the market shows signs of support or resistance at a key level.
C. Reversal trading
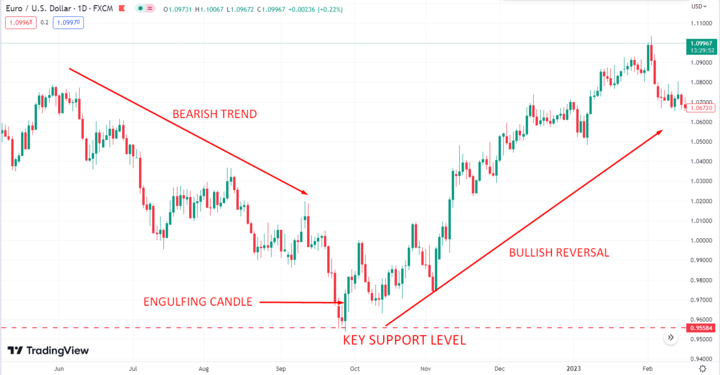
Reversal trading is another powerful entry strategy. This approach involves looking for key candlestick patterns that indicate a potential reversal in the market. Once a reversal has been confirmed, you can enter a trade in the opposite direction of the previous trend.
D. Trading with multiple timeframes
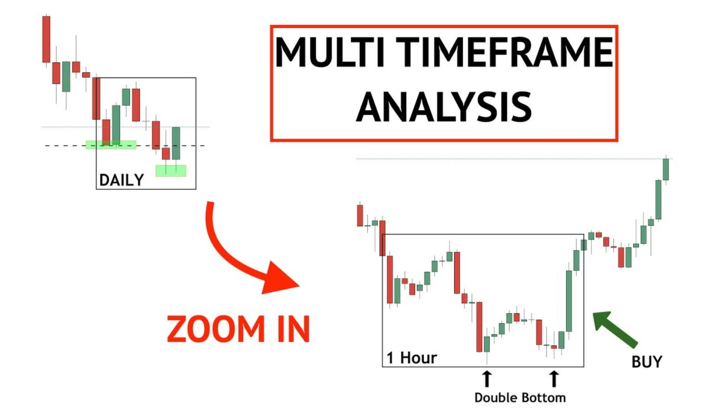
Trading with multiple timeframes can also be an effective way to improve your trading results. By using longer timeframes to identify the overall trend and shorter timeframes to enter and exit trades with more precision, you can gain a more complete picture of the market and make more informed trading decisions.
Risk Management Strategies

In terms of success in trading, you need to be able to manage risk effectively. This involves implementing risk management strategies. By doing so, you can limit potential losses and increase profitability. Some key risk management strategies can help you unlock your profit potential.
A. Stop loss placement
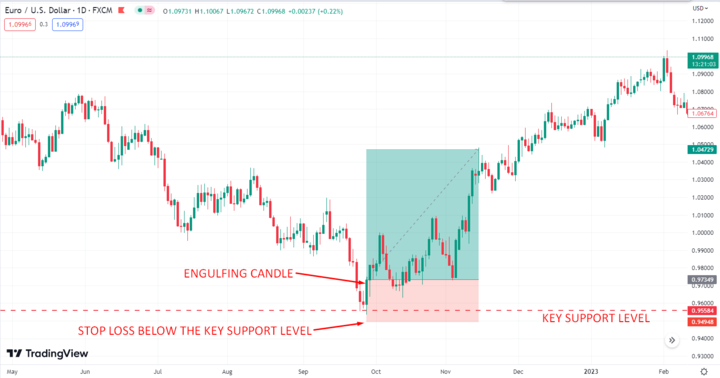
One of the most important risk management strategies in trading is stop loss placement. This involves placing stop losses to limit potential losses and using a trailing stop to lock in profits. Doing so can minimize your risk exposure and protect your capital. Determining the appropriate placement of stop losses is essential based on your risk tolerance and market conditions.
B. Position sizing
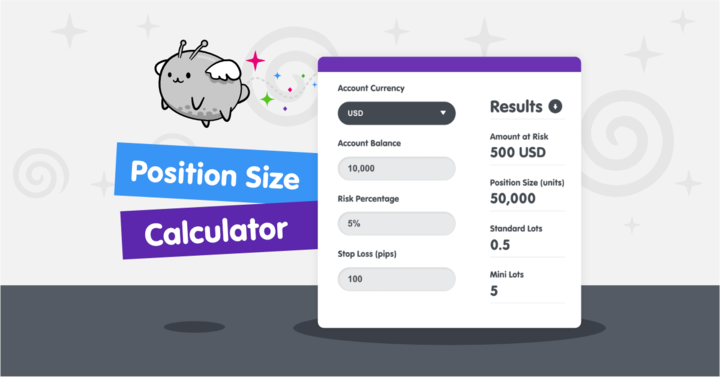
Another critical aspect of risk management is position sizing. This involves determining the appropriate position size based on your risk tolerance and adjusting the position size based on market conditions. Position sizing is a crucial element of risk management as it helps to ensure that you are not overexposed to any particular market.
C. Reward-to-risk ratio
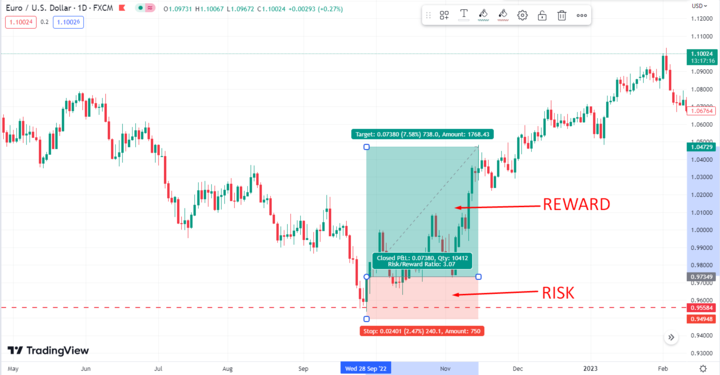
Using a favorable reward-to-risk ratio is a powerful technique to increase your overall profitability. You can generate significant returns by targeting trades with a high reward-to-risk ratio while minimizing your risk exposure. It's important to adjust the reward-to-risk ratio based on market conditions to ensure you are not taking unnecessary risks.
D. Managing winning and losing trades
Managing winning and losing trades is an essential aspect of risk management. You need to know when to take profits and when to cut losses to ensure that you are not holding onto losing trades for too long.
Managing emotions and avoiding impulsive decisions can be challenging, but avoiding unnecessary losses is necessary.
Advanced Price Action Trading Strategies
To unlock your profit potential in trading, it's important to use advanced price action trading techniques. These strategies can help you identify trends, potential areas of support and resistance, and entry and exit points for trades.
The four advanced price action trading strategies: trading with moving averages, Fibonacci retracements, trendlines, and chart patterns.
A. Trading with moving averages
One popular trading strategy is to use moving averages to identify trends and determine entry and exit points. Moving averages are calculated by taking the average price of a security over a certain period of time. Traders often use the 50-day and 200-day moving averages to identify long-term trends. When the price is above the moving average, it's considered an uptrend; when it's below, it's a downtrend.
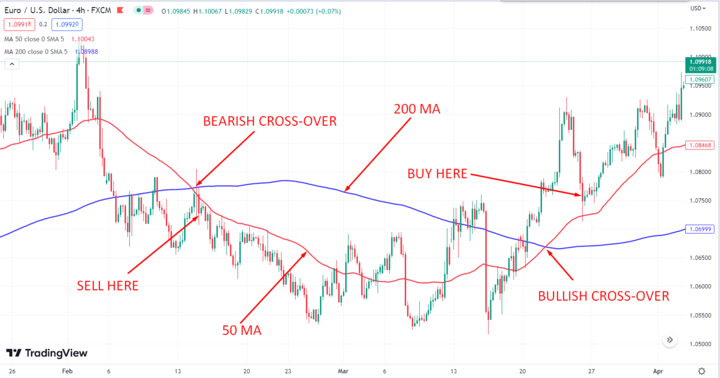
By looking for crossovers, you can use moving averages to determine entry and exit points. When the shorter-term moving average crosses above the longer-term moving average, it's a buy signal; when it crosses below, it's a sell signal. You can also use moving averages as dynamic support and resistance levels.
B. Trading with Fibonacci retracements
Another strategy is to use Fibonacci retracements to identify potential areas of support and resistance. Fibonacci retracements are calculated by taking the high and low points of a trend and dividing the vertical distance by the key Fibonacci ratios of 23.6%, 38.2%, 50%, 61.8%, and 100%.
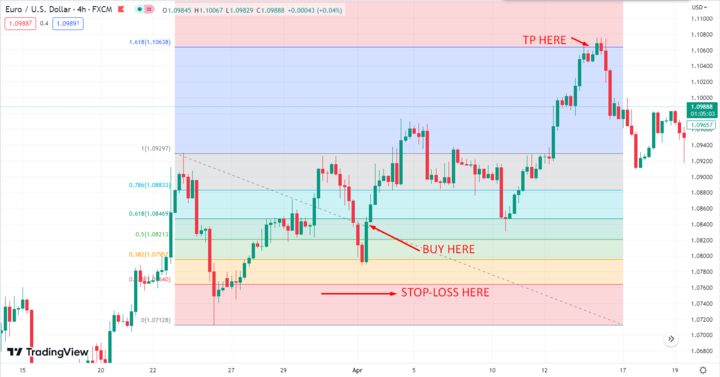
Traders often use Fibonacci retracements to identify key levels of support and resistance. When the price retraces to one of these levels, it's a potential buying or selling opportunity. You can also use Fibonacci retracements to determine entry and exit points by looking for price action at these levels.
C. Trading with trendlines
Trendlines are another popular trading tool that can help you identify key support and resistance levels. You can draw trendlines by connecting two or more swing highs or lows. When the price is above the trendline, it's considered an uptrend; when it's below, it's a downtrend.
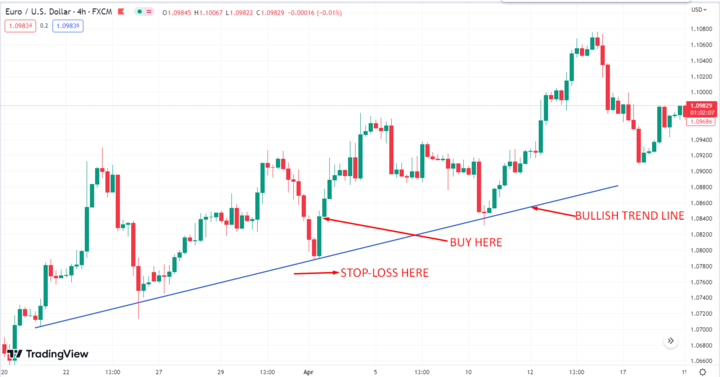
By looking for price action at these levels, you can use trendlines to determine entry and exit points. For example, if the price breaks above a downtrend line, it's a potential buy signal; if it breaks below an uptrend line, it's a potential sell signal.
D. Trading with chart patterns
Chart patterns are formations that can help you identify potential trade opportunities. There are many different chart patterns, including triangles, head and shoulders, and double tops and bottoms. These patterns can indicate trend reversals or continuation.
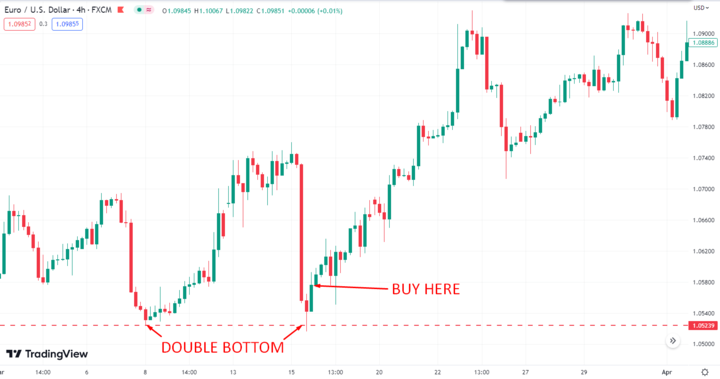
You can use these patterns to determine potential entry and exit points by looking for price action at key levels. For example, if a stock is forming a head and shoulders pattern, you may want to wait for the price to break below the neckline before taking a short position.
Backtesting and Optimization
These techniques' key aspects are backtesting and optimisation, which can help you fine-tune your trading strategy for better performance.
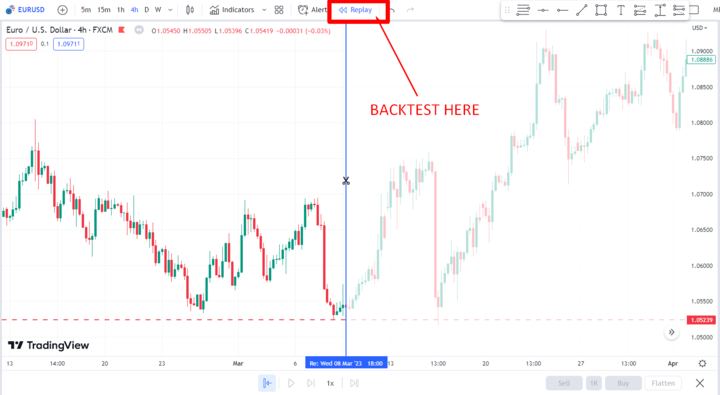
A. The importance of backtesting

Backtesting is the process of testing a trading strategy using historical market data to see how it would have performed. By analyzing past market data, you can gain valuable insights into your trading strategy's performance under different market conditions. This can help you identify areas for improvement and adjust your strategy for better performance in the future.
To perform a basic backtest, you must choose a trading strategy and a set of rules for entering and exiting trades. Then, you'll need to manually review historical market data and apply your trading strategy to see how it would have performed over time. While this method can be time-consuming and tedious, it can give you a good idea of how your strategy would have performed in the past.
B. How to backtest a Price Action Trading Strategy
When it comes to backtesting a Price Action Trading strategy, there are a few key parameters to consider. These include the time frame, the currency pair, and the specific Price Action Trading strategy you'll be testing. Once you've identified these parameters, you can use backtesting software to analyze past market data and see how your strategy would have performed.
C. Basic optimization strategies

In addition to backtesting, optimization strategies can also help you improve your trading performance. To optimize your trading strategy, you'll need to identify areas where your strategy can be improved based on your backtesting results.
This might include adjusting your entry and exit rules or fine-tuning your risk management strategy. You can create a more effective trading strategy by making these adjustments based on your backtesting results.
Conclusion
Advanced price action trading techniques can unlock significant profit potential for traders who are willing to put in the time and effort to master them. By understanding key concepts such as market structure, order flow, and price action patterns, traders can develop effective and efficient strategies. Backtesting and optimization are essential tools for improving these strategies, allowing traders to identify and adjust to improve their performance.


Finally, continuous learning and improvement are critical to long-term success in price action trading. By studying the techniques and strategies of successful traders such as Nial Fuller and Chris Capre, traders can gain valuable insights and inspiration to enhance their own trading skills.