


- Henry Hub spot price increased modestly by 3 cents to $1.66/MMBtu, indicating short-term uptick.
- International LNG futures prices rose, suggesting rising global demand, but lower compared to last year, indicating potential market volatility.
- Supply fell by 1.9%, driven by decreased production and imports, with a notable decline in consumption.
- Higher-than-average natural gas stocks suggest a comfortable supply situation, potentially limiting significant price spikes in the short term.
Based on EIA weekly data, the analysis focuses on recent price trends, from the Henry Hub spot price to regional spot prices, the subtle shifts that shape short-term gas market outlooks. It delves into international futures prices, tracing the ripples of global demand fluctuations and their implications on domestic pricing strategies. Derive insights from the dynamics of natural gas plant liquids (NGPL) prices and crude oil markets.
Price Trends
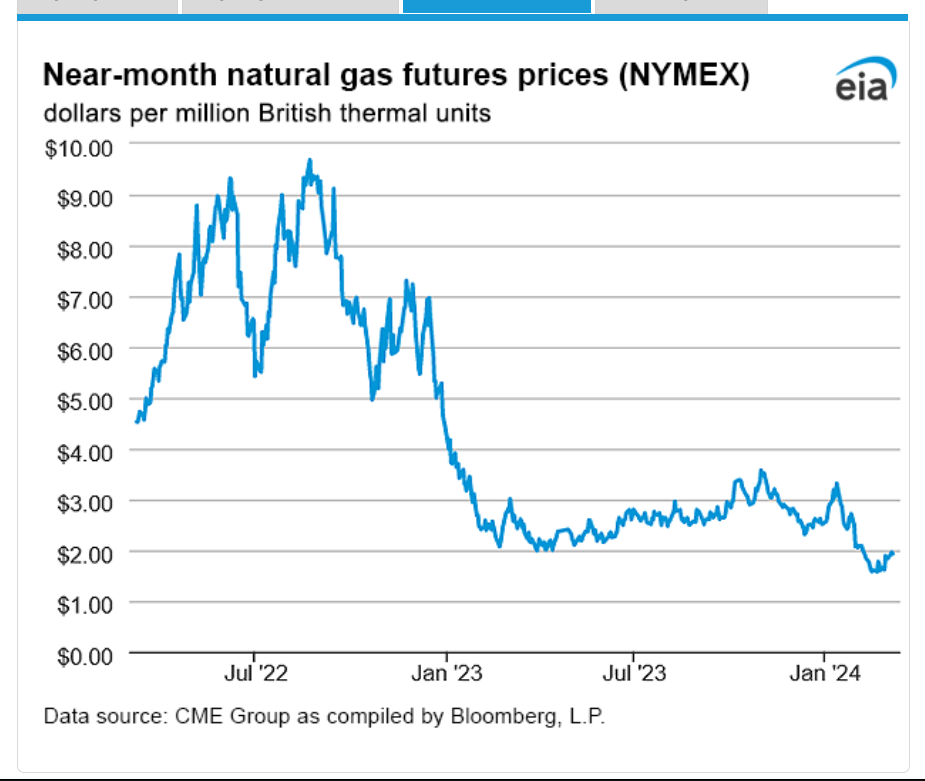
- The Henry Hub spot price increased by 3 cents from $1.63 to $1.66/MMBtu, indicating a modest uptick in short-term pricing.
- Henry Hub futures prices for April 2024 NYMEX contract saw a more pronounced increase, rising by 4.4 cents to $1.929/MMBtu, reflecting optimism in future pricing.
- The 12-month strip averaging April 2024 through March 2025 futures contracts climbed by 1.2 cents to $2.829/MMBtu, suggesting a more stable long-term outlook.
- Regional spot prices exhibited variability, with some areas experiencing decreases and others increases. For instance, Algonquin Citygate saw a decrease of 51 cents, while PG&E Citygate rose by 81 cents.
- The Waha Hub price in West Texas plummeted to $0.21/MMBtu due to maintenance activities on pipelines, indicating localized disruptions in supply.
- Prices on the West Coast rose, driven by lower temperatures, highlighting the influence of weather patterns on demand and pricing dynamics.
Source: eia.gov
International Futures Prices
Liquefied natural gas (LNG) futures prices in East Asia and the Netherlands increased during the reported week. Weekly average front-month futures prices for LNG cargoes in East Asia rose by 10 cents to $8.36/MMBtu, while natural gas futures for delivery at the Title Transfer Facility (TTF) in the Netherlands rose by 74 cents to $8.38/MMBtu. Compared to the same week last year, there's a notable decrease in prices, particularly in East Asia and TTF, suggesting potential volatility in international markets and potential impact on domestic pricing.
Natural Gas Plant Liquids (NGPL) Prices
Ethane prices rose by 2%, contributing to the natural gas plant liquids composite price at Mont Belvieu, Texas. However, the overall composite price fell by 7 cents/MMBtu, averaging $7.46/MMBtu for the week ending March 6. Propane prices fell by 3%, while Brent crude oil prices rose by 2%, affecting the propane discount to crude oil. This indicates a complex interplay between natural gas liquids and crude oil markets, which could influence investor sentiment in natural gas CFDs.
Supply and Demand Dynamics
- Total supply of natural gas fell by 1.9% (2.0 Bcf/d) compared with the previous report week. This decline was driven by decreases in both dry natural gas production and net imports from Canada.
- Dry natural gas production decreased by 1.2% (1.2 Bcf/d) to average 101.9 Bcf/d, with notable declines in production observed in the Appalachia, South Texas, and Mid-Continent regions.
- Demand for natural gas decreased across residential, commercial, and industrial sectors, except for natural gas exports to Mexico, which increased by 8.6% (0.5 Bcf/d).
- Natural gas deliveries to LNG export terminals decreased, partly due to ongoing repairs at Freeport LNG, suggesting potential constraints on export capacity.
Liquefied Natural Gas (LNG)
Average natural gas deliveries to U.S. LNG export terminals fell by 3.1% (0.4 Bcf/d) week over week, indicating a potential decrease in export demand. Ongoing repairs at Freeport LNG in Freeport, Texas, following the January 2024 winter storm have reduced sendout capacity from the facility, contributing to lower deliveries to LNG terminals.
Rig Count:
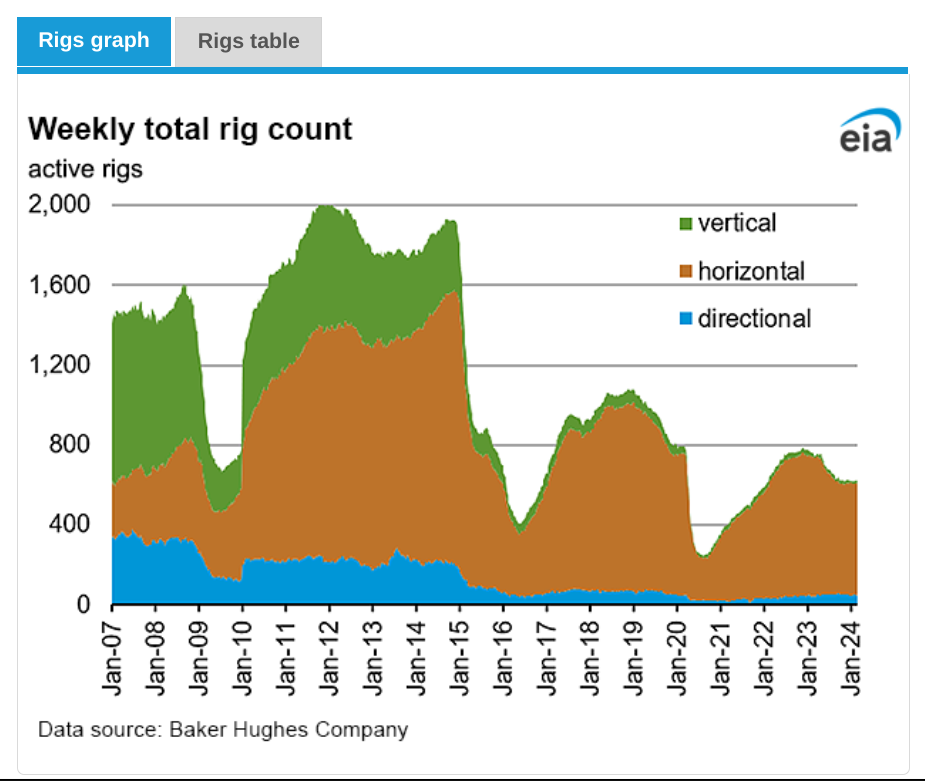
- The natural gas rig count decreased slightly by 1 rig to 119 rigs for the week ending February 27, according to Baker Hughes data. This decline was driven by decreases in the Haynesville region, partially offset by an increase in the Marcellus region.
- In contrast, the oil-directed rig count increased by 3 rigs to 506 rigs, indicating potential shifts in drilling activity towards oil-producing regions.
- The total rig count, including miscellaneous rigs, increased marginally to 629 rigs, suggesting overall stability in drilling activity across both oil and natural gas regions.
Source: eia.gov
Storage:
Net withdrawals from storage totaled 40 Bcf for the week ending March 1, significantly lower than the five-year (2019–2023) average net withdrawals of 93 Bcf and last year's net withdrawals of 72 Bcf during the same week. Working natural gas stocks totaled 2,334 Bcf, which is 551 Bcf (31%) more than the five-year average and 280 Bcf (14%) more than last year at this time. The average rate of withdrawals from storage is 20% lower than the five-year average so far in the withdrawal season (November through March), indicating ample supply and potentially limiting upward price pressure.
Implications on Price of CFDs on Natural Gas
Short-Term Outlook:
The increase in Henry Hub spot and futures prices suggests short-term bullish sentiment. Factors such as regional demand fluctuations, supply disruptions at Waha Hub, and rising prices on the West Coast due to lower temperatures contribute to this outlook.
International Market Influence:
The rise in LNG futures prices in East Asia and the Netherlands indicates increasing global demand for natural gas, which could positively impact domestic prices if exports rise. However, the significant decrease in prices compared to the same week last year suggests potential volatility in international markets, which could influence domestic pricing trends unpredictably.
Supply-Demand Balance:
Decreased production and imports alongside lower consumption levels may provide support for prices in the short term. However, the overall decline in consumption, especially in the residential and commercial sectors, could exert downward pressure on prices. Investors should closely monitor shifts in production levels, consumption patterns, and export trends to gauge future price movements accurately.
Storage Dynamics:
Higher-than-average working natural gas stocks suggest a comfortable supply situation, which could mitigate immediate concerns of supply shortages and limit significant price spikes in the short term.
Global Factors:
Monitoring international LNG trade dynamics and geopolitical developments is crucial for understanding future price movements. Global factors such as geopolitical tensions, trade agreements, and energy policies can significantly influence natural gas prices and CFDs.
Natural Gas Prices Technical Take
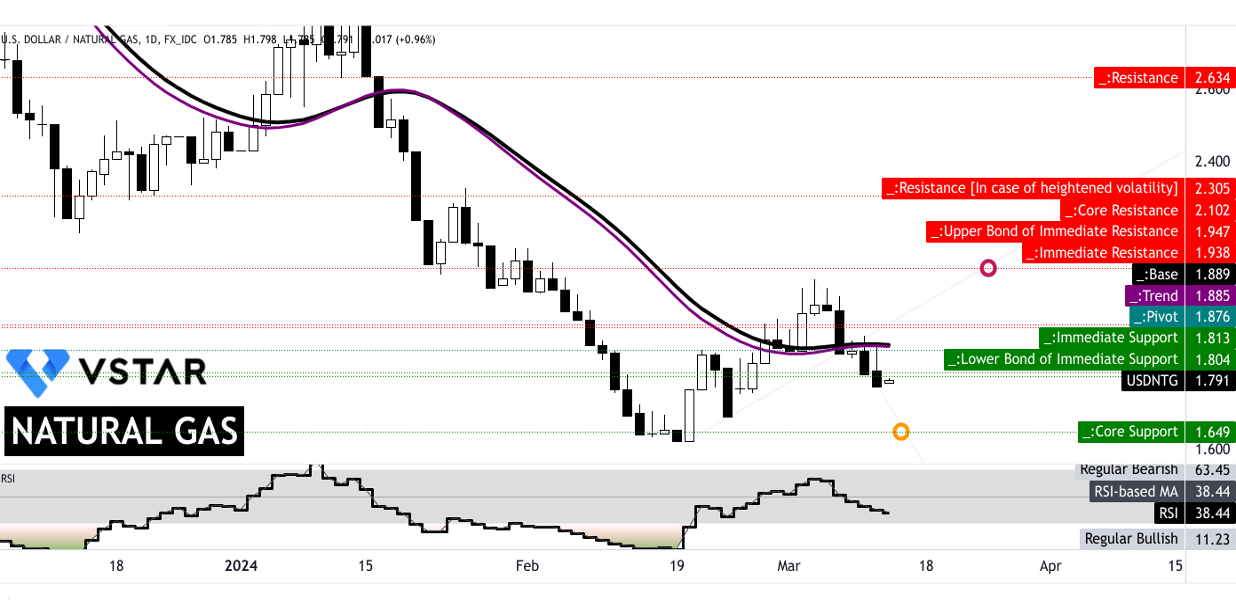
The prices of natural gas CFD may hit $1.649 based on the current momentum, as there is a prevailing downtrend that can be observed through the trend line (purple line). At $1.649, there is core support for the current swing; this level is derived through Fibonacci retracement. Looking at the relative strength index (at 38), there is further room for downside moves.
On the upside, the natural gas price is experiencing three major resistance levels at $1.804, $1.876, and $1.947. This zone is the current consolidation price channel, where $1.876 is the pivot.
However, there are equal possibilities of upside price moves in the coming days (considering RSI). These possible price moves have to be aggressive, as the price has to break the entire price channel and the trend line. On this course, the price may hit $2.102 by the end of the month.
Source: tradingview.com
In conclusion, the EIA data points towards a short-term bullish trend in natural gas CFDs. Henry Hub spot and futures prices indicate modest increases, supported by supply decreases and rising international demand. However, regional disparities and supply disruptions introduce volatility. Decreased consumption and ample storage temper immediate concerns about scarcity. Yet, global factors like geopolitical tensions loom. The technical analysis suggests potential downtrends but acknowledges major resistance levels. Upside moves are plausible, contingent on breaking resistance levels. Here, the projected price targets are $1.649 (downside, to be hit this week) and $2.102 (upside, to be hit by month-end) for natural gas CFDs.


