


From "Digital Bank" to "Platform Financial Infrastructure": SoFi's Second Growth Curve Enters the Realization Phase
I. Company Profile: What Kind of Company is SoFi?
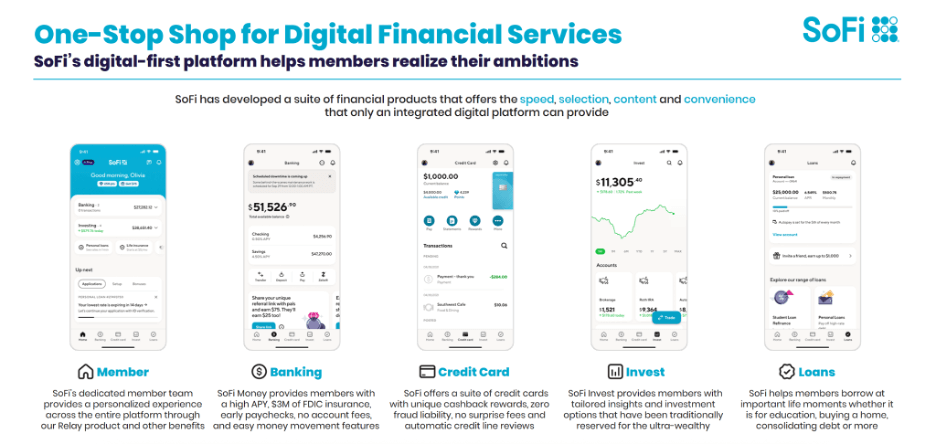
Founded in 2011, SoFi Technologies initially entered the financial market through student loans and has since expanded into personal loans, mortgages, credit cards, investments, payments, and technology platforms. Since obtaining its banking license in 2022, SoFi has evolved from a typical fintech app into a one-stop digital financial ecosystem centered on its own banking system, technology platform, and multi-product synergy.
SoFi’s strategic positioning is a comprehensive platform that enhances customer Lifetime Value (LTV) through the Financial Services Productivity Loop (FSPL):
- Attracting users with high-yield savings, payments, and basic accounts.
- Achieving cross-selling through loans, investments, and credit cards.
- Feeding back user data, risk control, and technical capabilities to the platform business to form a virtuous cycle.
II. Q3 2025: Fundamentals Enter the "Certainty Strengthening" Phase
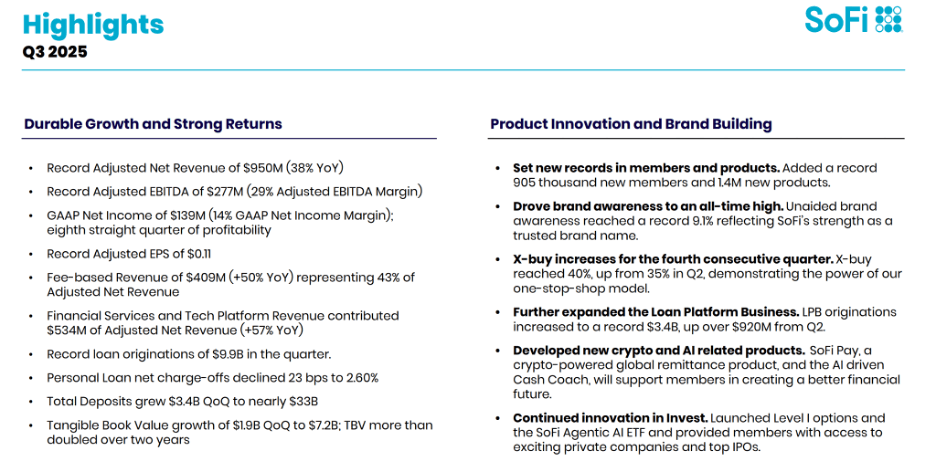
According to the Q3 2025 investor report, SoFi’s financial performance shows simultaneous improvement in earnings quality alongside rapid growth.
Core Financial Data (Q3 2025):
- Adjusted Net Revenue: $950 million (+38% YoY)
- Adjusted EBITDA: $277 million, with a 29% margin
- GAAP Net Income: $139 million, marking 8 consecutive quarters of profitability
- Adjusted EPS: $0.11
- Fee-based Revenue: $409 million (+50% YoY), accounting for 43% of net revenue
- Financial Services + Tech Platform Revenue: $534 million (+57% YoY)
This data indicates that SoFi has moved beyond "growth at all costs" and has officially entered a phase of profit-driven growth.
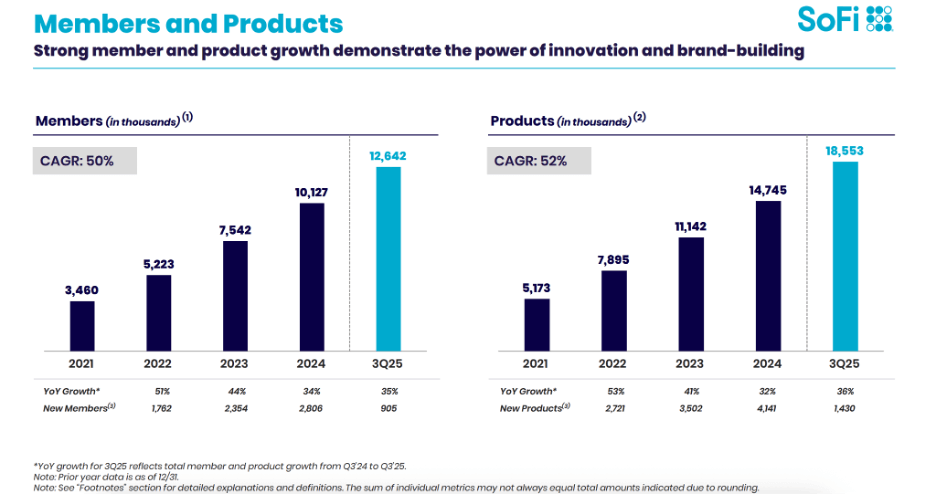
III. Users and Products: The Underlying Flywheel of a Platform Company
SoFi’s growth stems from the continuous amplification of "Users × Products × Cross-buying":
- Members: 12.64 million (+35% YoY)
- New Members in Q3: 905,000 (a record high)
- Total Products: 18.55 million (+36% YoY)
- Cross-buy Rate: 40%, increasing for four consecutive quarters
This validates the effectiveness of the FSPL model: More users lead to deeper product engagement, higher revenue per user, lower acquisition costs, and stronger reinvestment capabilities.
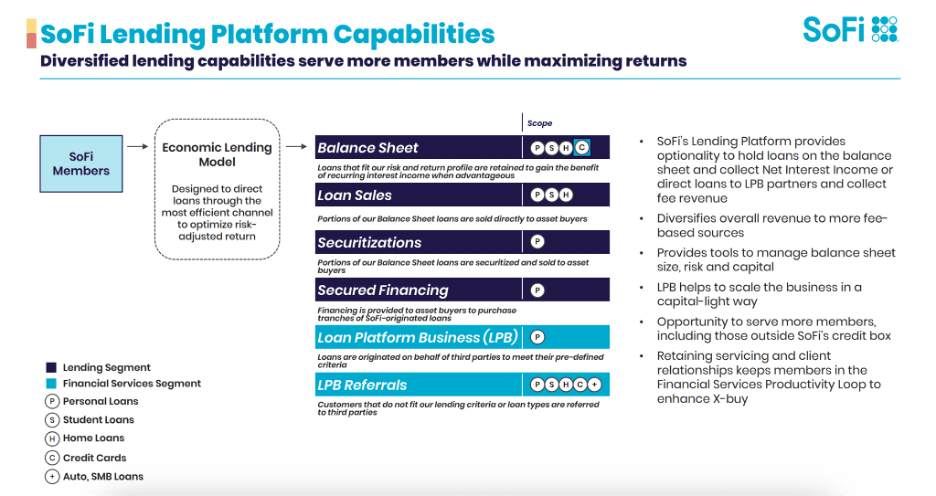
IV. Structural Inflection Point: Loan Platform Business (LPB) as the Core Engine
LPB is the key variable in this research report. Its significance lies in:
- SoFi does not hold the loans itself; it provides underwriting, pricing, and risk management for third-party institutions.
- It earns stable platform service fees rather than Net Interest Margin (NIM) or gain-on-sale.
- It is a capital-light, risk-outsourced, high-margin business model.
Q3 LPB Core Data:
- LPB Originations: $3.4 billion (up $920 million QoQ)
- Total Loan Originations: $9.9 billion (record high)
- Annualized Run-rate: Approximately $13 billion
- Annualized Revenue: Approximately $660 million
This upgrades LPB from a supplementary income source to SoFi's second growth curve, significantly reducing sensitivity to interest rate cycles.
V. Qualitative Change in Revenue Structure:
From Lending-Driven to Fee-Driven
Q3 data shows an irreversible shift in SoFi's revenue structure:
- Fee-based revenue increased to 43%.
- Financial Services + Tech Platform revenue accounts for 56%.
- Financial Services segment revenue grew 76% YoY.
- Non-interest income increased by 157% YoY.
As of Q3 2025, deposits reached nearly $33 billion, with approximately 90% serving as deposit funding. In credit, personal loan net charge-offs dropped to 2.60%, and the average borrower FICO score reached 745, indicating stable asset quality. The CET1 capital ratio stands at 20%, well above regulatory requirements.

VI. Forward Guidance and Valuation FrameworkFY2025 guidance shows accelerating growth:
Annual Adjusted Net Revenue: ~$3.54 billion
Adjusted EBITDA: ~$1.035 billion
Adjusted EPS: ~$0.37
Financial Services Revenue Growth: 60–65%
Given the 40%+ EPS growth expected for FY2026–2027, the current 45–50x forward P/E reflects anticipation of platform-based growth rather than just market sentiment.
VII. Technical Aspect: Consolidation is Not Failure, but Awaiting Confirmation
SoFi's stock has faced resistance in the $30–$31 range since August–September 2025. This phase appears to be a period of digesting valuation while waiting for fundamentals to catch up:
- The stock rose over 80% in 2025 and 500%+ over three years, necessitating a cooling period.
- A market shift from Growth to Value occurred during this time.
- Fundamentals remain strong, even as the stock price pace has slowed.
Strong buying support near $25 suggests that long-term capital has not exited.

VIII. Conclusion: SoFi Enters its "Second Growth Cycle"
While 2022–2024 was a period of survival and validation, Q3 2025 marks the beginning of a phase characterized by platform capability realization, revenue structure upgrades, and accelerated profit release.
With the scaling of LPB and rising fee-based revenue, SoFi is evolving from an interest-rate-sensitive fintech stock into a platform company with financial infrastructure attributes.
Investment Rating: Buy
Core Judgment: The growth logic is being consistently validated by data, not just supported by narrative.


