Introduction
The U.S. government deficit soared and the House of Representatives in Congress passed a budget amid turmoil and a near government shutdown. Following the passage of the budget, the supply of U.S. bonds continued to increase, creating a supply/demand imbalance, and the long-end U.S. bond market sold off, with yields repeatedly hitting new records and term premiums rising. Expectations of a recession increased and expectations of a rate hike continued to decline.
U.S. government nearly shuts down as budget overruns, deficits soar
September 30, due to the House of Representatives in Congress on the size of the budget, continue to help Ukraine against Russia, the U.S.-Mexico border immigration control and social welfare programs to help poor Americans and other issues are still divided, President Joe Biden has not been able to sign the budget bill, the federal government is facing closure.
October 2, in the U.S. government "shutdown" before the last minute, the Democratic and Republican parties finally reached an agreement to avoid this risk.
However, in the dominant U.S. House of Representatives of the Republican Party, but there are differences. At the time of writing, the U.S. House of Representatives held a vote on Tuesday, October 3 to remove House Speaker Kevin McCarthy from office for the first time in history.
Hardline conservative Republicans, led by the Freedom Caucus, were unhappy with Speaker McCarthy's performance. On the one hand, they cite the fact that Speaker McCarthy compromised too much in his negotiations with President Biden and broke his promise to dramatically cut government spending when he ran for Speaker earlier this year. When McCarthy was first elected Speaker, he promised to hold government spending to $1.47 trillion, but in the subsequent debt ceiling negotiations, he reached an agreement with the President for $1.65 trillion.
On the other hand, government shutdowns are often used by Congress to negotiate with the President. Many have repeatedly urged the Speaker to use the debt ceiling as a bargaining chip to force spending cuts and reforms, but he ultimately struck a deal to raise the debt ceiling without restrictions.
Historically, most U.S. government shutdowns have occurred because of budget disagreements, policy disagreements, the debt ceiling, and other disagreements.
The most common reason is the failure of Congress to pass the federal government's annual appropriations bill or a temporary appropriations bill on time.On December 22, 2018, the U.S. government partially shut down due to the failure of Congress to reach an agreement on a budget bill and the debt ceiling.The shutdown lasted until January 25, 2019, for a total of over a month.
The main source of disagreement between the House and Senate of this Congress on government budget spending is the size of the budget for the next 12 months, which has increased the government deficit by $578 billion, or 61%, compared to the same period last year (August 2021-October 2022). In the end, one of the main sources of disagreement, the budget for aid to Ukraine, was cut before it could be passed.
U.S. Bond Supply Expands as Budget Deficits Rise
The level of deficits is usually measured on an annual basis and is called the annual deficit. The government's annual deficit is the amount by which the government's expenditures exceed tax revenues in a given fiscal year (a positive amount is a surplus, a negative amount is a deficit).
U.S. government expenditures are primarily fiscal expenditures, which are expenditures made by the U.S. government to meet various government functions and government programs. These expenditures include, but are not limited to, defense spending, social security, health care, education, infrastructure development, social welfare, law enforcement, foreign affairs, scientific research, and more. Fiscal expenditures are a major component of the deficit because they require the government to raise enough money to pay for them.
The U.S. government's revenues are primarily tax revenues. Tax revenues are taxes and fees that the government collects from individuals, families, businesses, and other entities. These include personal income taxes, corporate income taxes, excise taxes, property taxes, social security taxes, and more. Tax revenues are one of the main sources of funding for the government and they are used to cover government expenditures and reduce deficits.
The U.S. government budget surpluses and deficits, stem from the difference between the government's expenditures and revenues, and if the government's expenditures exceed tax revenues, the government needs to borrow to cover the budget deficit.
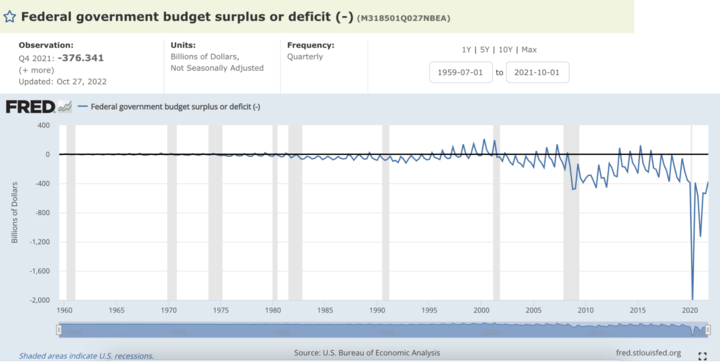
Chart: Historical Trend of U.S. Government Budget Surplus/Deficit
According to the historical chart of the U.S. government budget deficit, government surpluses are not a common occurrence. The last time the U.S. government ran a budget surplus was in the late 1990s and early 2000s. Since then, however, the U.S. government has run deficits in consecutive years, largely due to the global financial crisis and other factors. While government surpluses tend to be realized over a long period of time and require policy efforts to maintain, government deficits are relatively common.
The U.S. federal government has faced serious fiscal challenges since the outbreak of the New Crown epidemic, with deficits and debt rising sharply, even surpassing the historic highs seen since the end of World War II.
According to estimates by the Congressional Budget Office (CBO) and the Office of Budget and Management (OMB), the federal budget deficit is projected to remain in the range of -5% to -6% for the next 10 years or so, which is significantly higher than the average for the period between 2015 and 2019 (-3.5%).
Government borrowing is typically done through the issuance of bonds, such as Treasury securities. Government borrowing is a major source of deficits, and budget deficits are a major cause of the growth of the national debt, the size of which is a reflection of the size of the deficit.
For example, if the U.S. government shuts down, the debt ceiling is another more common reason, if the government will not be able to rely on the issuance of debt to raise enough money to cover its expenditures, this could lead to a fiscal crisis, which could lead to a government shutdown. Since 1976, the U.S. government has experienced 21 temporary government shutdowns due to funding shortfalls, 10 of which occurred after 1980, forcing government employees to take unpaid leave.
Since the end of World War II, Congress has adjusted the debt limit 102 times, according to congressional offices. In recent years, the two parties have become increasingly acrimonious, and debt ceiling negotiations have led to market turmoil, government shutdowns, and other disruptions.
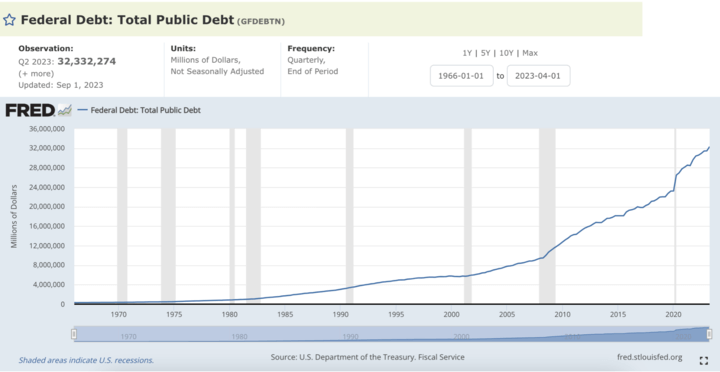
Chart: Trend in total U.S. debt issuance
The size of the budget deficit and the national debt are closely related to debt sustainability. As deficits continue to rise, so does the national debt, which can lead to unsustainable debt levels.
Increased interest burden on government debt due to rising interest rates and high inflation
Governments typically look at the ratio of government debt to gross domestic product (GDP) to assess debt sustainability. If the debt-to-GDP ratio is too high, it can raise concerns about the country's economic stability. In June this year, the U.S. debt was raised again as it reached the $31 trillion ceiling, and to date, the U.S. national debt has exceeded the $32 trillion level, and the debt-to-GDP ratio has reached 119 percent. This is the reason why this Congress was slow to pass the President's deficit-increasing budget, although it was compromised in the end.
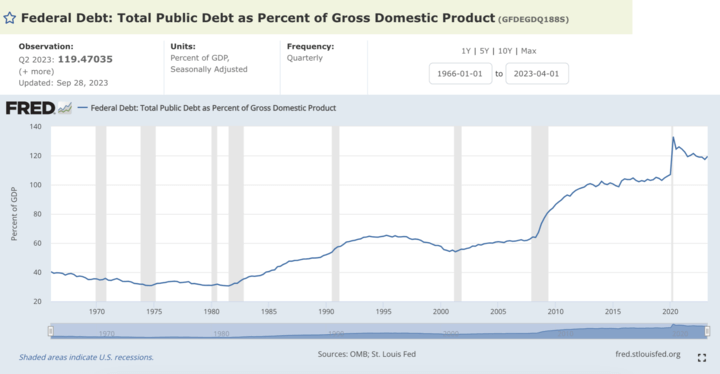
Chart: U.S. Government Debt as a Percentage of GDP
The national debt typically has a variety of different maturities, with the government paying interest and repaying the principal on the maturity date. Over the long term, years of government deficits have resulted in the accumulation of national debt, which will require future interest payments on the debt and repayment of the debt's principal. The U.S. national debt is an accumulation of borrowed money and the associated interest owed by investors who purchase these securities.
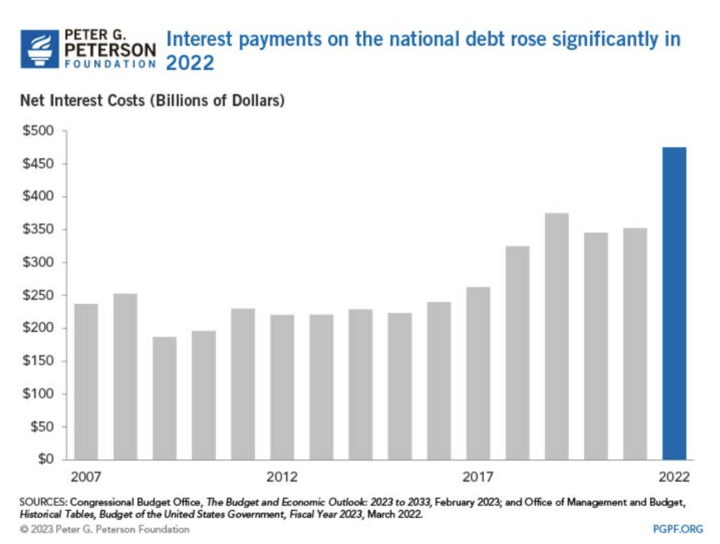
Figure: Interest Payments on the National Debt Soar in 2022
In the near term, the government will have to deal with debt service pressures, including the "rollover" of the debt stock and deficit refinancing. Combined with high inflation and interest rates, interest payments are projected to triple from nearly $475 billion in fiscal year 2022 to a staggering $1.4 trillion by 2032.
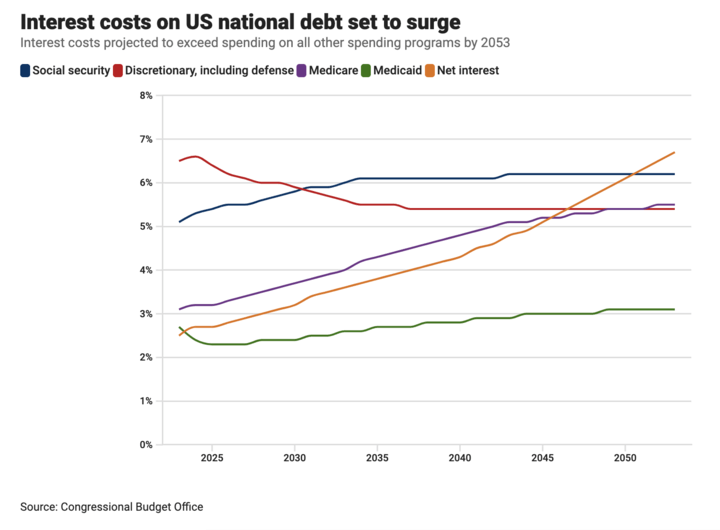
Chart: Trend in U.S. Government Interest Expenditures on the National Debt Projected to Surpass Spending in Other Areas by 2053
Interest payments are projected to rise to $5.4 trillion by 2053, accounting for 35% of federal revenues and exceeding U.S. government spending on Social Security, Medicaid, Medicare, and defense.
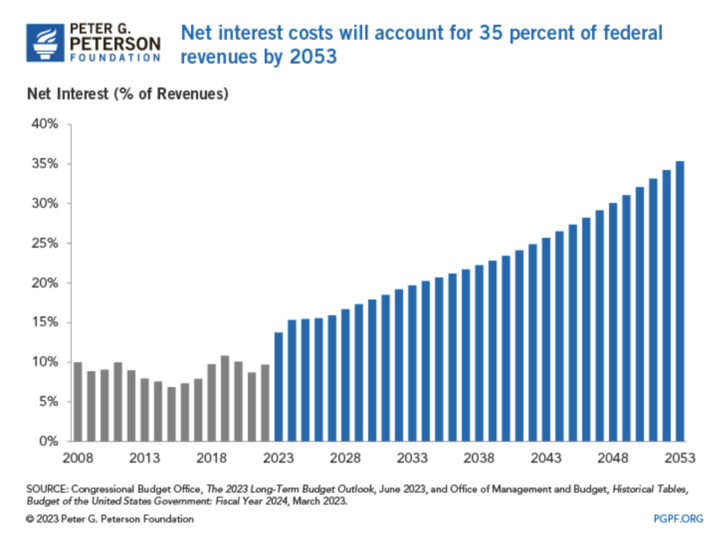
Chart: Interest Payments on the National Debt Projected to Consume 35 Percent of Federal Revenues by 2035
As a share of the economy, total interest on the national debt will reach a record 3.2 percent of GDP by 2030. By 2053, it will more than double to 6.7 percent.
For years, the U.S. has been able to borrow cheaply as interest rates have remained historically low. But as the federal funds rate rises, so do short-term Treasury rates, making it more expensive for the government to borrow.
Thus, large deficits and rising Treasury rates also have a dampening effect on rate hike expectations. Given the impact of rate hikes on the deficit, the market believes that the Fed should think twice about these economic consequences. After all, every time interest rates on the national debt rise, there is tremendous pressure on the government's budget.
U.S. bonds sold off, term premiums rise to bring the suspension of interest rate hike expectations
To sum up, the federal government in order to maintain normal financial spending and the issuance of Treasury bonds to borrow, but due to the U.S. Treasury bond issuance has been huge over the GDP, and deficits have increased year after year, coupled with the author's last article had analyzed, the economic development of next year is expected to be lowered by the Federal Reserve, the high interest rates continue to long time is expected to float, and ultimately threatened the U.S. bond expected yields. And high interest rates caused by interest payments will become an important expenditure item makes fiscal policy space compression, monetary policy can not dance alone, the future of economic and financial vulnerability increases, investors believe that the risk of holding long-term bonds is greater than the return.
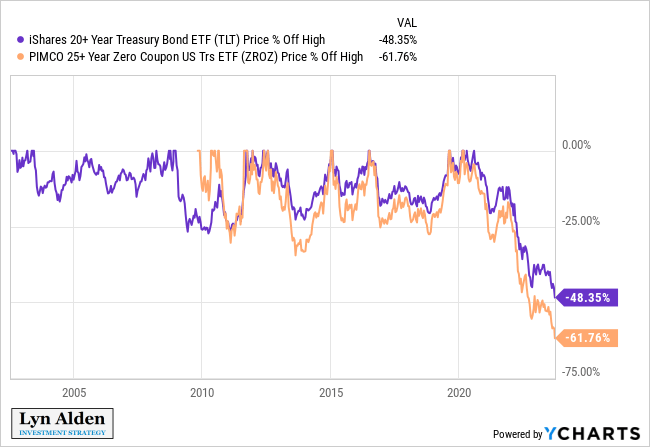
Chart: Long-term U.S. bond ETF prices on the verge of a cut
Source: Twitter@Lynalden
Therefore, the "global asset pricing anchor" of US bond began to be sold off, shaking the stock market, currency markets, commodities, and other types of markets. US bond yields surged at the same time, the US stock market continued to pull back, and the US dollar index is climbing to a new high, safe-haven assets gold back in the eyes of investors, short-term bottom.
I have analyzed the possibility of the U.S. recession and the bottom of the winning rate in July this year, you can check through the link.
Wall Street's shorts are turning, Is there still a chance for a bottom?
An inverted Treasury yield curve is considered one of the indicators of a recession, and in the July article we could see that the data was still heavily inverted at that time. More recently, however, the term premium on U.S. bonds has risen and turned positive for the first time in over two years.
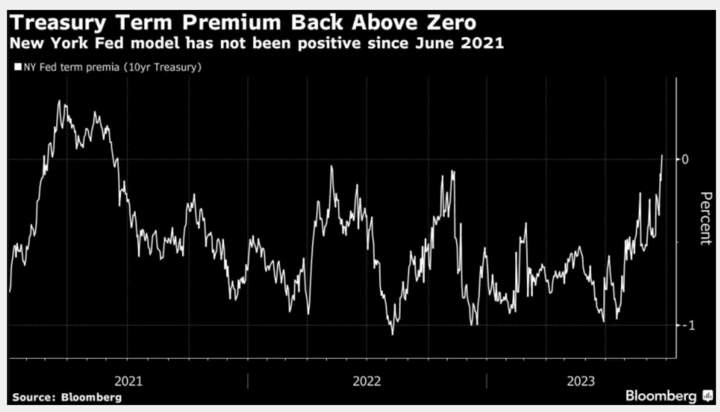
Chart: US Treasury term premium turns positive
The yield curve is a graph that shows the level of interest rates on US Treasuries of different maturities. Normally, the interest rate on long-term bonds should be higher than the interest rate on short-term bonds because investors typically demand higher yields for holding longer maturities to compensate for risk and time value. An inversion occurs when the interest rate on short-term bonds on the yield curve is higher than the interest rate on long-term bonds, which is known as an inverted curve.
The term premium is the difference between long-term bond rates and short-term bond rates. When the term premium rises, the interest rate on long-term bonds rises relative to the interest rate on short-term bonds, which helps to maintain a normal yield curve. However, if the term premium falls or becomes negative, the interest rate on long-term bonds may be lower than the interest rate on short-term bonds, which can lead to an inverted yield curve.
The term premium is mainly related to risk appetite. In general, the term premium should be positive because investors usually expect to be compensated for the risks associated with holding long-term bonds. However, investors may accept a negative term premium if the potential benefits of long-term bonds outweigh the risks.
Economic and inflation cycles also affect the term premium. For example, negative term premiums have been a dominant theme since 2015. As inflation has fallen, investors prefer lower long-term yields. For example, in 2020, when inflation and growth were low, the term premium had fallen to its lowest level this century.
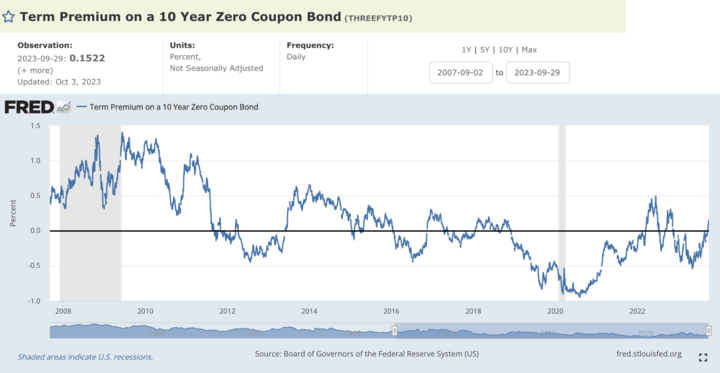
Chart: 10 Year Zero Coupon Bond Term Premium Trend
Term premiums are also related to supply and demand for Treasuries, such as the Fed's expansion of bond purchases since 2016 as part of its monetary easing policy, which has also suppressed term premiums. And analysts believe that the recent movements in term premiums are largely related to supply and demand.
Since the latest rate hike, the Fed has started to taper and sell debt, coupled with rising recession expectations, short-term U.S. bonds have been sold off, causing the yield curve to remain inverted. And due to the huge deficit, the amount of U.S. debt continues to grow, leading to a further imbalance between supply and demand.


According to data analysis, the recent sell-off in the bond market was mainly concentrated in longer-term bonds, and the rise in short-term U.S. bond yields was smaller, which helped to narrow the size of the inverted yield curve and increase the term premium.
Now, rising term premiums may signal that some market logic is changing. Rising term premiums lead to a rise in term rates, which indirectly implements a rate hike. It also provides a rationale for the Fed to pause in raising rates.
An inverted yield curve is often seen as a signal of a potential recession, as it may indicate that the market expects lower economic growth in the future. A rise in the term premium, on the other hand, usually indicates an increase in market demand for longer-term bonds and may reflect investor concerns about inflation or future economic uncertainty. Thus, a rise in the term premium during an inverted curve may indicate market concerns about a recession.