


EURUSD
Fundamental perspective
The EUR/USD pair has been fluctuating around the 1.0700 level due to various factors, primarily influenced by macroeconomic data from both the United States and Europe. The recent weakening of the US Dollar can be attributed to discouraging US economic indicators, indicating sluggish growth and persistent inflation pressures. This sentiment is expected to persist leading up to the Federal Reserve's monetary policy decision, with market participants anticipating a continuation of the Fed's hawkish stance.
Recent US economic data, marked by a contraction in the manufacturing sector and modest GDP growth, has evoked concerns about the nation's economic vitality. Despite marginal improvements in durable goods orders, Federal Reserve officials remain steadfast in their conviction that there is scant room for interest rate reductions in light of prevailing economic conditions.
Conversely, Europe has witnessed a modest boost in the Euro's fortunes, fueled by local data signaling service sector advancements. Nonetheless, hints from European Central Bank officials suggesting a potential rate cut in June underscore a tempered outlook for the eurozone's inflationary trajectory.
As the financial landscape unfolds, all eyes are trained on the forthcoming Federal Reserve decision and key US employment metrics, notably the Nonfarm Payrolls report. Simultaneously, attention is attuned to pivotal economic releases from Germany and the Eurozone, encompassing retail sales, GDP projections, and inflationary gauges, all poised to exert palpable influence on the trajectory of the EUR/USD pair in the immediate future.
EURUSD Forecast Technical perspective
The weekly candle of EURUSD ended as a hammer with a small green body and wicks on both sides declaring indecision. Sellers may still possess the asset price, so the next candle can be red.
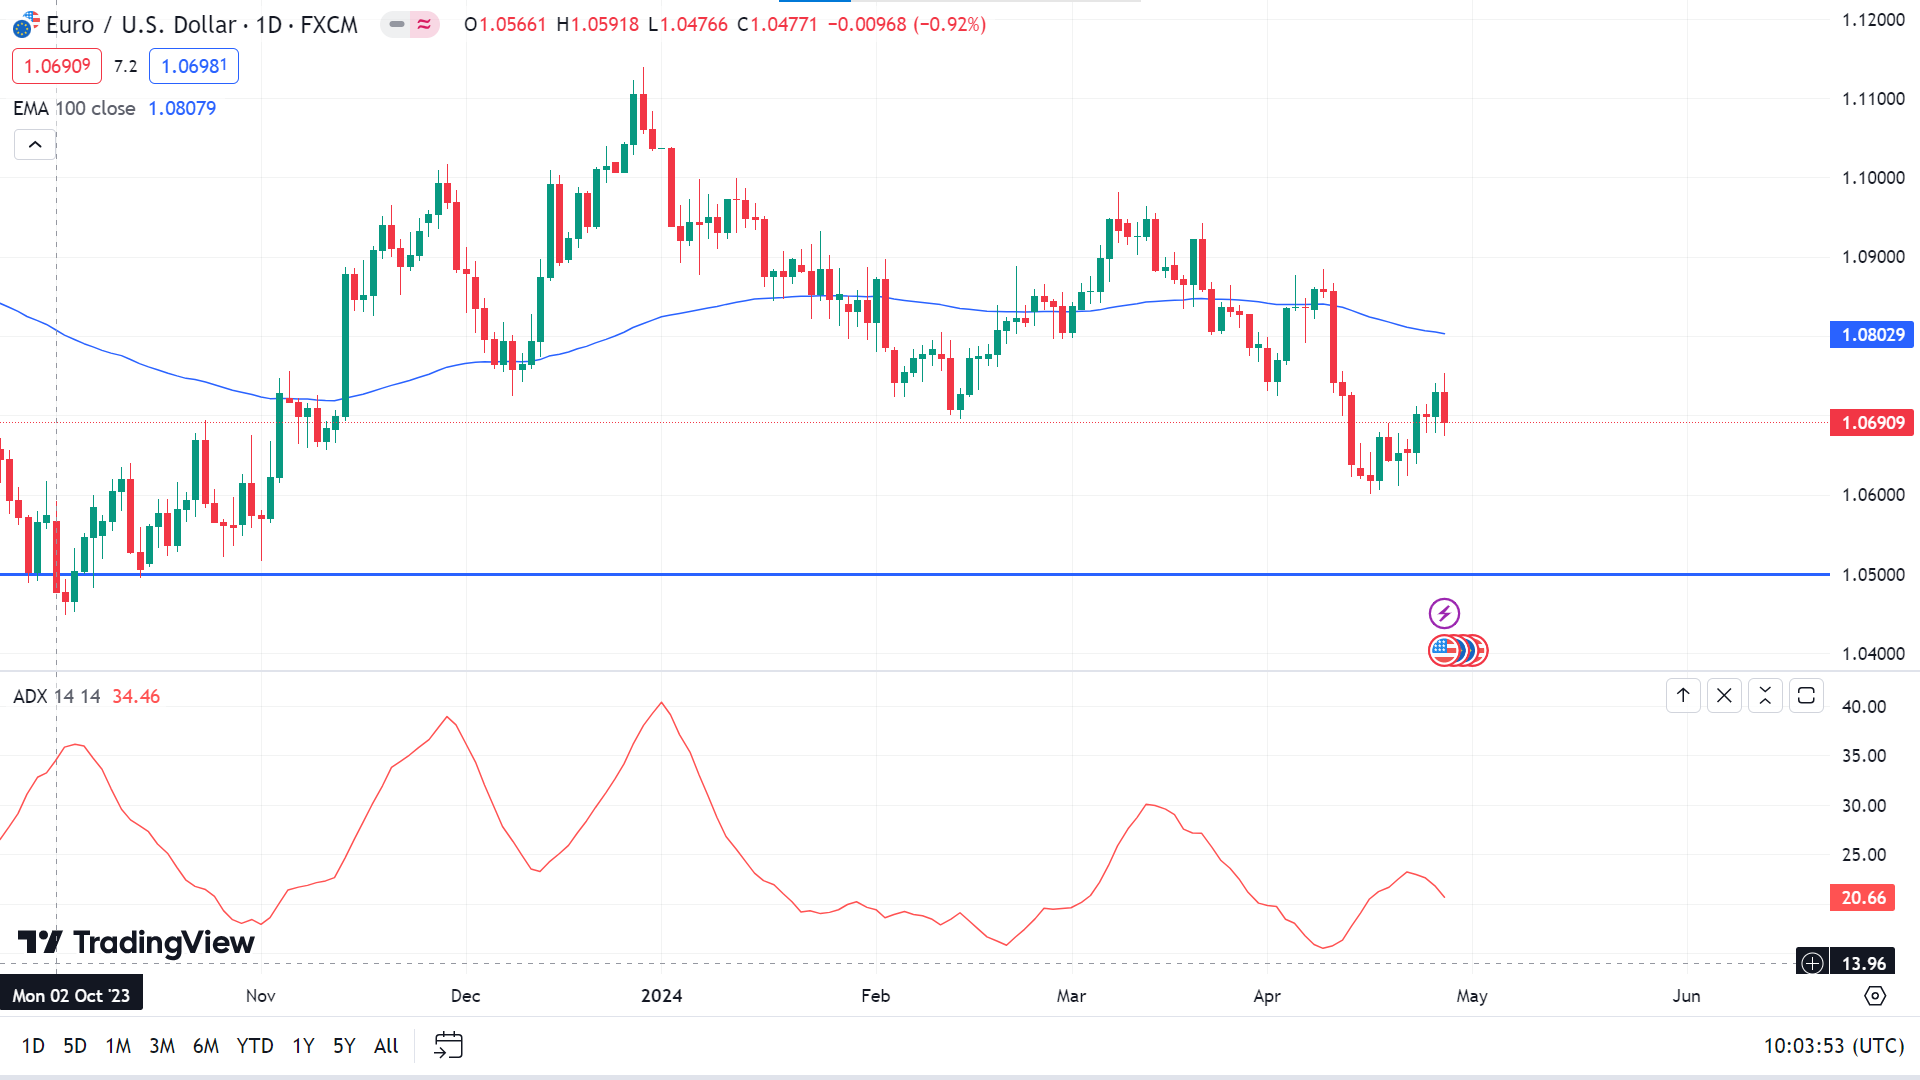
In the daily chart, the price remains below the EMA 100 line, indicating that it may reach the recent support level near 1.0500 following the next demand level near 1.0250.
On the other hand, the ADX indicator reading suggests bears may lose power here, and the price may reach the current resistance level near 1.0885. Any close above this level can trigger the price to reach the next resistance near 1.0980.
GBPJPY
Fundamental Perspective
The GBPJPY pair reached a historic peak of 196.00, marking its fourth consecutive trading session of gains following the Bank of Japan's (BoJ) interest rate decision. BoJ maintained interest rates within the 0%-0.01% range, affirming its commitment to policy normalization and readiness to adjust monetary easing if inflation accelerates.
Despite BoJ's anticipation of rising inflation in the coming years, its economic outlook projects subdued growth, leading to investor skepticism. Tokyo's April Consumer Price Index (CPI) figures, falling short of forecasts, cast uncertainty over Japan's inflation trajectory, which persists above the 2% target. The subdued CPI growth raises apprehensions.
Meanwhile, robust Services PMI data indicates the Pound Sterling's resilience in the UK, heightening concerns about sustained inflationary pressures. If the Services PMI surge is sustained, it might impede the desired steadiness of price pressures towards the 2% target, fostering fear that the UK may keep interest rates higher for longer.
GBPJPY Forecast Technical Perspective
The weekly solid green candle of GBPJPY shows significant buyer domination on the asset price; no wonder the next candle can be another solid green candle if the bull pressure is sustained.

The price just broke above the historical resistance of 196.00 and is now hovering above it. In the daily chart, many technical indicators, including the EMA 21, EMA 50, EMA 100, and EMA 200 line, MACD, and ADX, declare extreme bull pressure on the asset price. So, the price can reach the next psychological resistance level, nearly 200.00. If it remains above 200.00, it may head to the next resistance level near 214.89.
On the other hand, the RSI indicator shows the price is overbought, and the Stochastic indicator indicates that selling pressure can occur at this level. So, the price can reach the primary support level near 196.00, following the next support level of 193.53.
NASDAQ 100 (NAS100)
Fundamental Perspective
U.S. equity index futures have edged higher today but remain relatively unchanged after the release of the latest core PCE price index, regarded as the Federal Reserve's favored inflation gauge.
In March, the core PCE index met expectations month-over-month, while the year-over-year figure exceeded Reuters' forecast. Similarly, the headline PCE price index aligned with monthly basis estimates but surpassed expectations year-over-year.
March's personal income growth aligned with expectations, while adjusted consumption outpaced initial projections.
According to the CME's FedWatch Tool, market sentiment regarding the upcoming Apr 30-May 1 Federal Reserve meeting has remained unchanged. With probabilities resting around 97%, the FOMC will likely maintain current interest rates. There is only a marginal 3% chance of a 25 basis points rate cut.
Looking ahead into 2024, the FedWatch Tool is inclined towards one rate cut, potentially occurring in September.
Technical Perspective
The weekly Nasdaq 100 candle finished green within the previous red candle range, delivering a bullish harami pattern, indicating the next candle can be another green one.

Many technical indicators, including the Stochastic RSI, EMA 100, and EMA 200, indicate buy pressure on the asset price. So, the price can reach the next resistance near 18464.70. Any breakout above that level can trigger the price toward 19,000.00.
Meanwhile, the price remains near 17,750.00, a good former support level with MACD and ADX suggesting sell pressure on the asset price. So, the price can reach the recent support level of nearly 16,973.94. Any close below that level could trigger the price to the next support level near 16,450.00.
S&P 500 (SPX500)
Fundamental Perspective
Last Friday saw a significant surge in the S&P 500 as investors shrugged off worries about persistent inflation and celebrated robust earnings from tech giants such as Microsoft Corp. and Alphabet Inc. Alphabet's shares (GOOGL) soared by 10.2%, pushing its market capitalisation above $2 trillion for the first time, as reported by Dow Jones Market Data.
Despite fresh inflationary signals in March, with the personal consumption expenditures price index indicating core inflation holding steady at 2.8% annually, investor sentiment remained resilient.
The S&P 500 surged by 1% on Friday, the Nasdaq Composite surged by 2%, and the Dow Jones Industrial Average increased by 0.4%. This week, the S&P 500 registered its most significant weekly gain since early November, erasing April's losses by 2.9%.
Investors are now closely monitoring the Federal Reserve's upcoming decision on interest rates following its two-day policy meeting ending on May 1, with expectations leaning towards potential rate cuts later in the year, particularly in September.
Technical Perspective
The weekly candle of the S&P 500 index finished as a solid green candle, recovering approximately 50% of its loss from the three consecutive losing weeks. It indicates buyers are in play, so it is no wonder the next candle can be another green one.

The most popular EMA indicators, including the EMA 21, EMA 50, EMA 100, and EMA 200 lines, indicate that the buyers control the asset price. Thus, the price can reach the current resistance level of 5263.95 or above.
However, the MACD, ADX, and Stochastic suggest sellers are also in play, and the price can reach the current support level near 4953.56, followed by the next support level near 4792.41.
Bitcoin (BTCUSD)
Fundamental Perspective
Cryptocurrencies, renowned for their inherent volatility, experienced an unusual calmness on Friday as market observers pondered the potential repercussions of the Japanese yen's steep decline to a 34-year low against the U.S. dollar.
Bitcoin (BTC) maintained its recent oscillations, trading within a narrow band of around $64,000, marking a marginal 0.9% decline over the preceding 24 hours. The broader CoinDesk 20 Index (CD20) exhibited a slightly steeper downturn, with notable dips observed in smart contracts network tokens.
Throughout the day, the Japanese yen (JPY) experienced a significant 1.3% depreciation against the U.S. dollar, reaching its lowest level since 1990. This decline followed the Bank of Japan's (BOJ) decision to maintain interest rates near zero without expressing significant concern about the yen's weakening, juxtaposed with the continued robust growth and persistent inflationary pressures in the U.S. economy.
While the yen's devaluation has not yet impacted cryptocurrency markets, analyst Noelle Acheson, author of the Crypto Is Macro Now report, suggests that potential intervention from the BOJ to bolster the currency could alter this scenario, potentially leading to a weaker greenback that might theoretically uplift cryptocurrency prices. Additionally, Lekker's Thompson notes the possibility of U.S. policymakers injecting liquidity into the markets, which could offer support for risk assets like cryptocurrencies.
Bitcoin Price Prediction Technical Perspective
The BTCUSD chart shows the weekly candle finished red as the fourth bearish candle in a row, declaring seller domination on the asset price. No wonder the next weekly candle can be another red one.

On the daily chart, the most popular EMA lines, including EMA 21, EMA 50, EMA 100, and EMA 200, suggest the price has sell pressure and can reach the primary support near $59,870.00. A breakout below this level can trigger the price to reach the following support level of nearly $52,860.00.
Meanwhile, The ADX and CCI indicator readings are neutral, whereas the Stochastic RSI suggests buying. So, the price can regain the resistance of $71,000.00, following the ATH level near $73,794.00.
Ethereum (ETHUSD)
Fundamental Perspective
The diminishing sell-side liquidity apparent across various cryptocurrency exchanges signals a scarcity of sellers willing to trade their assets. This scenario sets the stage for a potential price surge in response to even modest increases in demand.
Despite this imbalance, market makers possess the expertise to address the situation by leveraging their understanding of market dynamics. However, it's important to acknowledge that price rallies are not guaranteed, even under these conditions.
Despite short-term uncertainties, traders maintain an optimistic outlook, anticipating a resurgence in Ethereum's price trajectory. The impending launch of spot Ethereum exchange-traded funds (ETFs) in Hong Kong is poised to serve as a significant catalyst, mirroring the impact of similar products on Bitcoin prices. Moreover, developments in Ethereum's ecosystem, including adopting Layer 2 scaling solutions, contribute to optimism regarding its long-term prospects and sustained growth.
Ethereum Price Prediction Technical Perspective
The weekly ETHUSD candle closed green after a dragonfly doji candle, declaring bullish pressure on the asset price. So, the next candle can be another green one.

Many technical indicators on the daily chart, including EMA 21, EMA 100, EMA 200, Stochastic, and ADX, suggest opening a buy position here. So the price may reach $3550.00, following the ATH near $4095.40.
However, MACD and EMA 50 suggest opening a sell position here, so it is no wonder the price may decline toward the current support level of nearly $2951.30. Any break below that level can trigger the price to reach the next support near $2700.00.
Nvidia Stock (NVDA)
Fundamental Perspective
Nvidia (NVDA) has experienced a notable surge since October 2022, ascending from $108 per share to a pinnacle of $974 by early March 2024. However, a recent downturn has caused the stock price to retract by approximately 18% from its peak.
On April 22, Nikkei reported SoftBank's (SFTBY) ambitious plan to invest 150 billion yen ($960 million) by 2025 to bolster its computing capabilities, specifically focusing on advanced generative artificial intelligence. Nvidia is positioned to supply the necessary graphics processing units (GPUs) for this endeavor.
In another development, on April 15, Evercore ISI initiated coverage of Nvidia with an “Outperform” rating and a $1,160 price target. The firm contends that investors underestimate the significance of Nvidia's integrated chip, hardware, and software ecosystem, asserting that computing epochs are typically dominated by a single vertically integrated company, yielding substantial returns.
Nvidia's latest earnings report, released on Feb. 21, showcased a remarkable 265.3% year-over-year revenue increase to $22.1 billion in Q4, surpassing consensus estimates by $1.55 billion. Additionally, Nvidia's earnings per share of $5.16 exceeded expectations by approximately 10%, reflecting a 28% increase from the previous quarter.
Nvidia Stock Forecast Technical Perspective
NVDA's weekly chart finished solid green and recovered mostly from the previous week's loss, indicating a strong possibility that the next candle will be another green one.
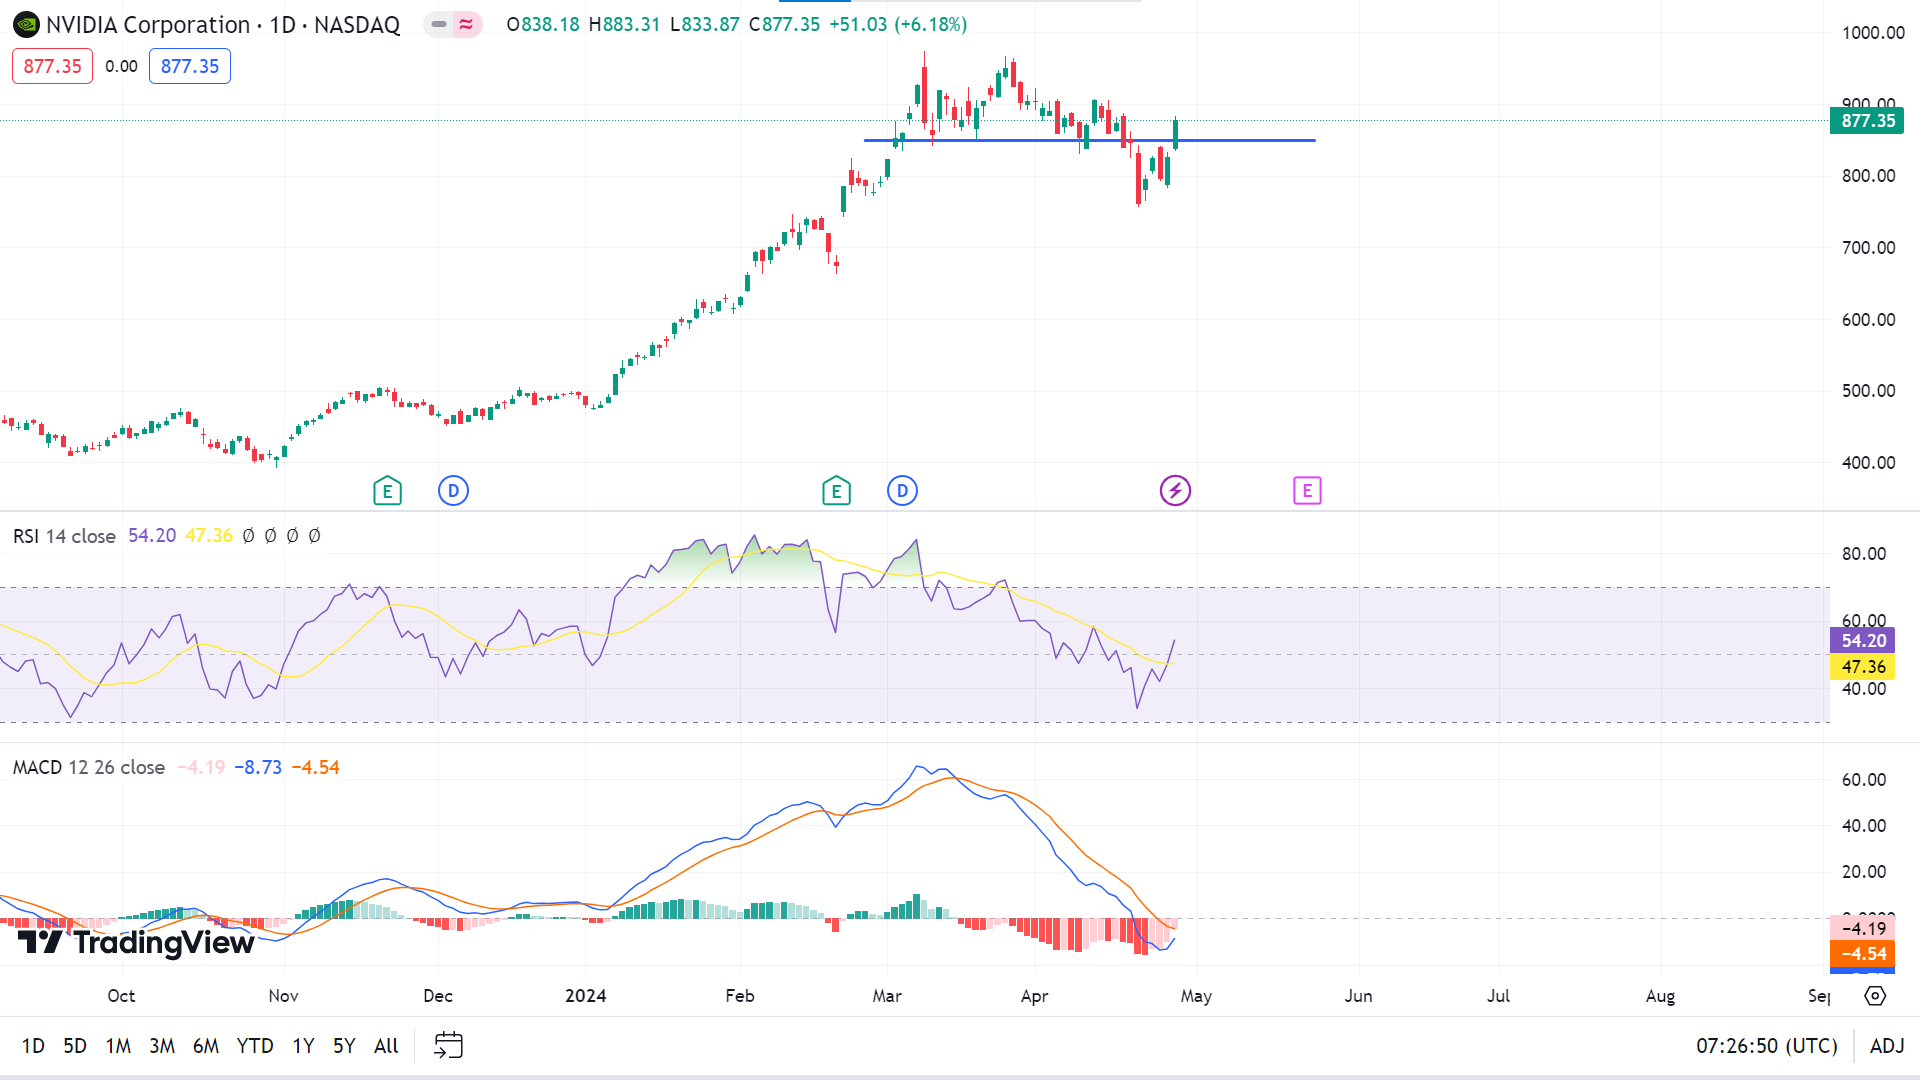
On the daily chart, many technical indicators, including EMA 21, EMA 50, EMA 100, EMA 200, RSI, ADX, and CCI, suggest opening a buy position. So, the price may head toward the ATH at around $974.00 or above in the upcoming days.
However, the stochastic RSI indicator indicates an overbought, so it is no wonder the price can decline toward the current support level near $785.61, following the next support of $680.49.
Tesla Stock (TSLA)
Fundamental Perspective
Tesla reported a notable 9% decrease in first-quarter revenue on Tuesday, marking its most significant decline since 2012 and falling short of analysts' expectations. This dip reflects the ongoing impact of price reductions in the electric vehicle market. Despite this news, Tesla's stock surged in after-hours trading following CEO Elon Musk's announcement to investors that production of new affordable EV models could commence earlier than anticipated.
Revenue decreased from $23.33 billion to $25.17 billion in the fourth quarter compared to the previous year. Net income also saw a substantial 55% decline to $1.13 billion, or 34 cents per share, down from $2.51 billion, or 73 cents per share, in the corresponding period last year.
This decline in sales surpassed the downturn experienced in 2020, attributed to production disruptions during the Covid-19 pandemic. Specifically, Tesla's automotive revenue plummeted 13% year-over-year to $17.38 billion in the first three months of 2024.
Tesla Stock Forecast Technical Perspective
The weekly TSLA candle closed in solid green, declaring bullish pressure on the asset price and maybe the next candle will be another green one.
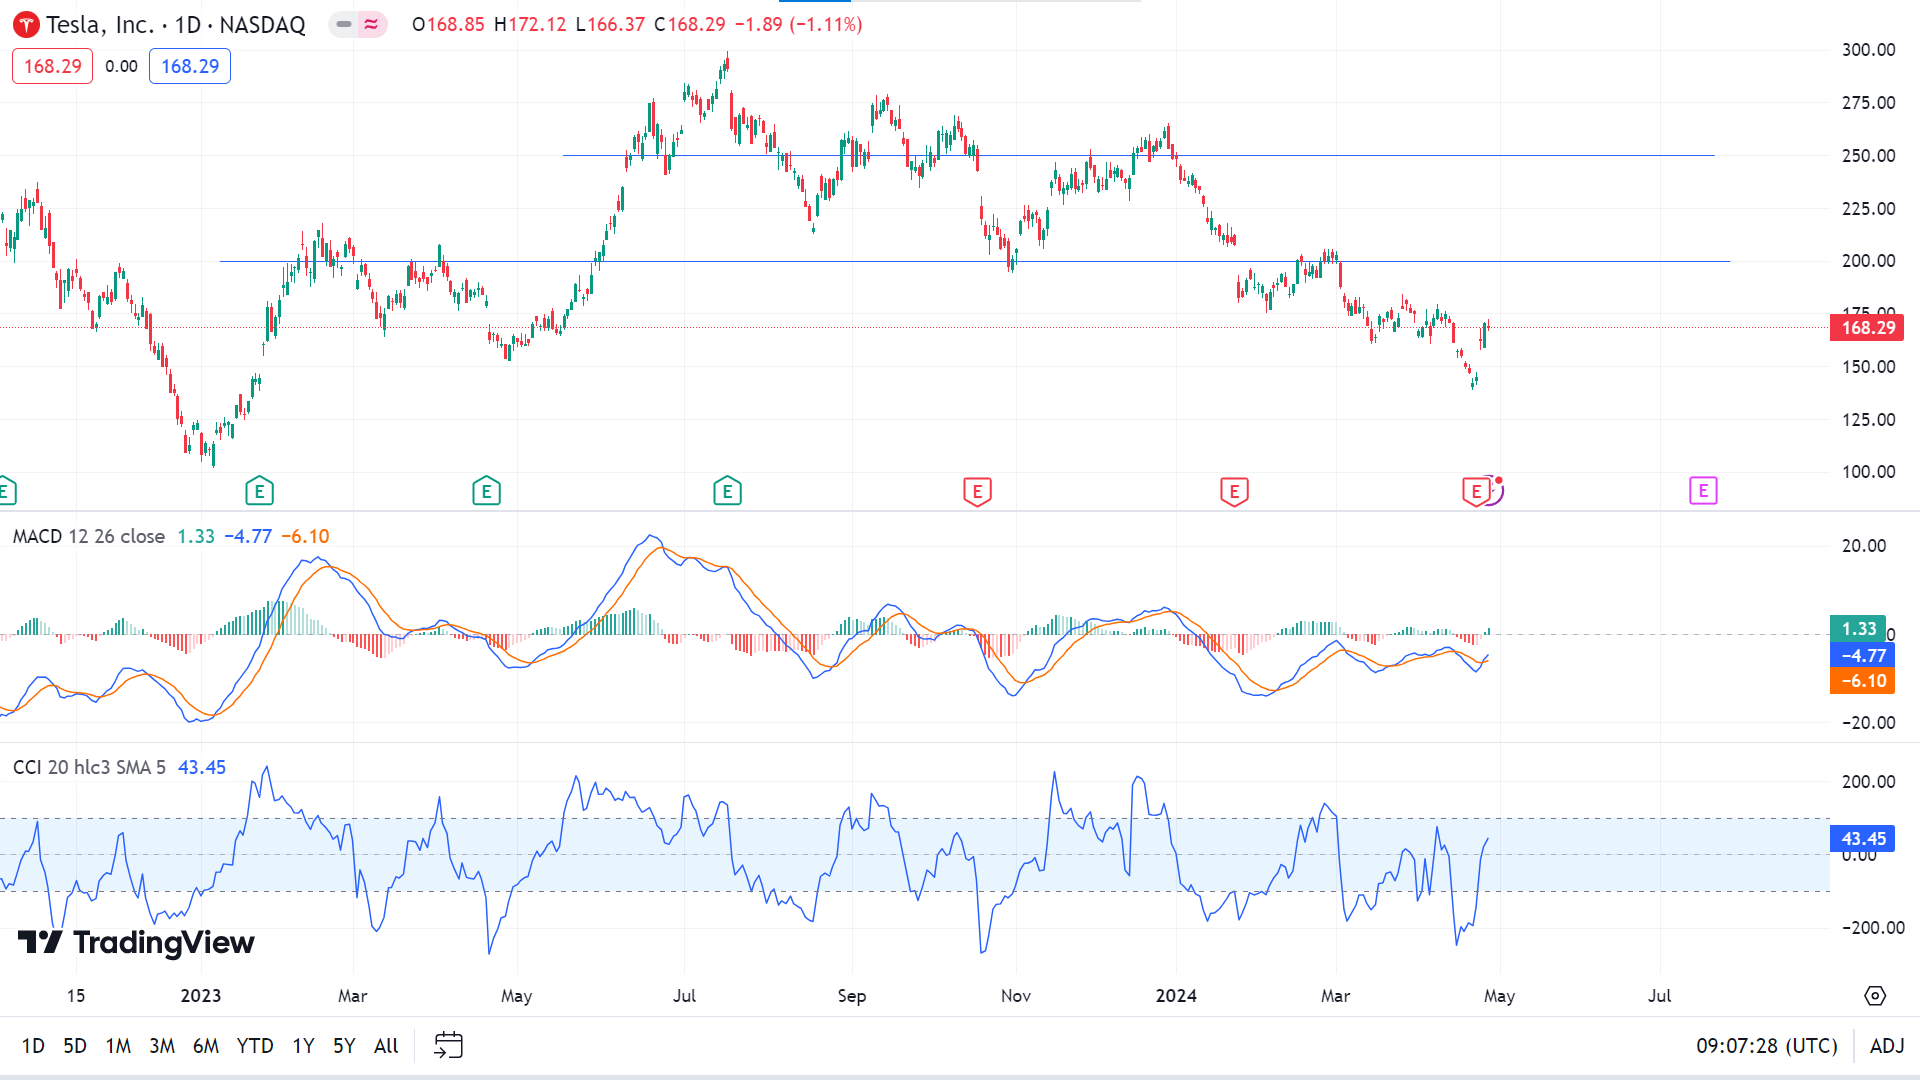
Many technical indicators on the daily chart, including EMA 21, EMA 50, EMA 200, RSI, MACD, ADX, etc., suggest bullish pressure on the asset price. The primary resistance is near $200.00; if that level is sustained, the price can reach $250.00 in the upcoming days.
However, the CCI indicator declares a neutral condition on the asset price, the price can drop again to the current support near $138.30, following the next support near $106.23.
Gold (XAUUSD)
Fundamental Perspective
Following the diminishing risk of a wider conflict between Israel and Iran, gold's volatility has significantly subsided, prompting a resurgence in risk appetite. As confidence returns, assets like the S&P 500 and high-beta currencies such as the Australian dollar and British pound have rebounded, eroding gold's status as a safe haven.
In the upcoming week, market focus will shift to the US Treasury's announcement regarding its funding needs and bond issuance preferences. This decision could sway both shorter and longer-dated yields, potentially influencing gold prices.
Moreover, gold may soon confront the sobering reality of an extended period of elevated Fed funds rates following Friday's release of inflation data. Despite acknowledging inflationary pressures, the Federal Reserve stands ready to respond, hinting at the prospect of further rate hikes.
While geopolitical tensions previously shielded gold from the impact of a strengthening dollar and rising yields, recent de-escalations suggest that gold bulls may encounter waning momentum in the absence of additional catalysts. Although finding support at $2320, gold's upside potential may be constrained in the absence of significant drivers.
Gold Price Prediction Technical Perspective
The last weekly candle of XAUUSD closed with a red body covering the previous bullish candle, declaring that the sellers may be gaining over buyers. However, the long wick on the downside declared that the buyers were still in the game. The next candle can be either red or green depending on many other correlated factors.
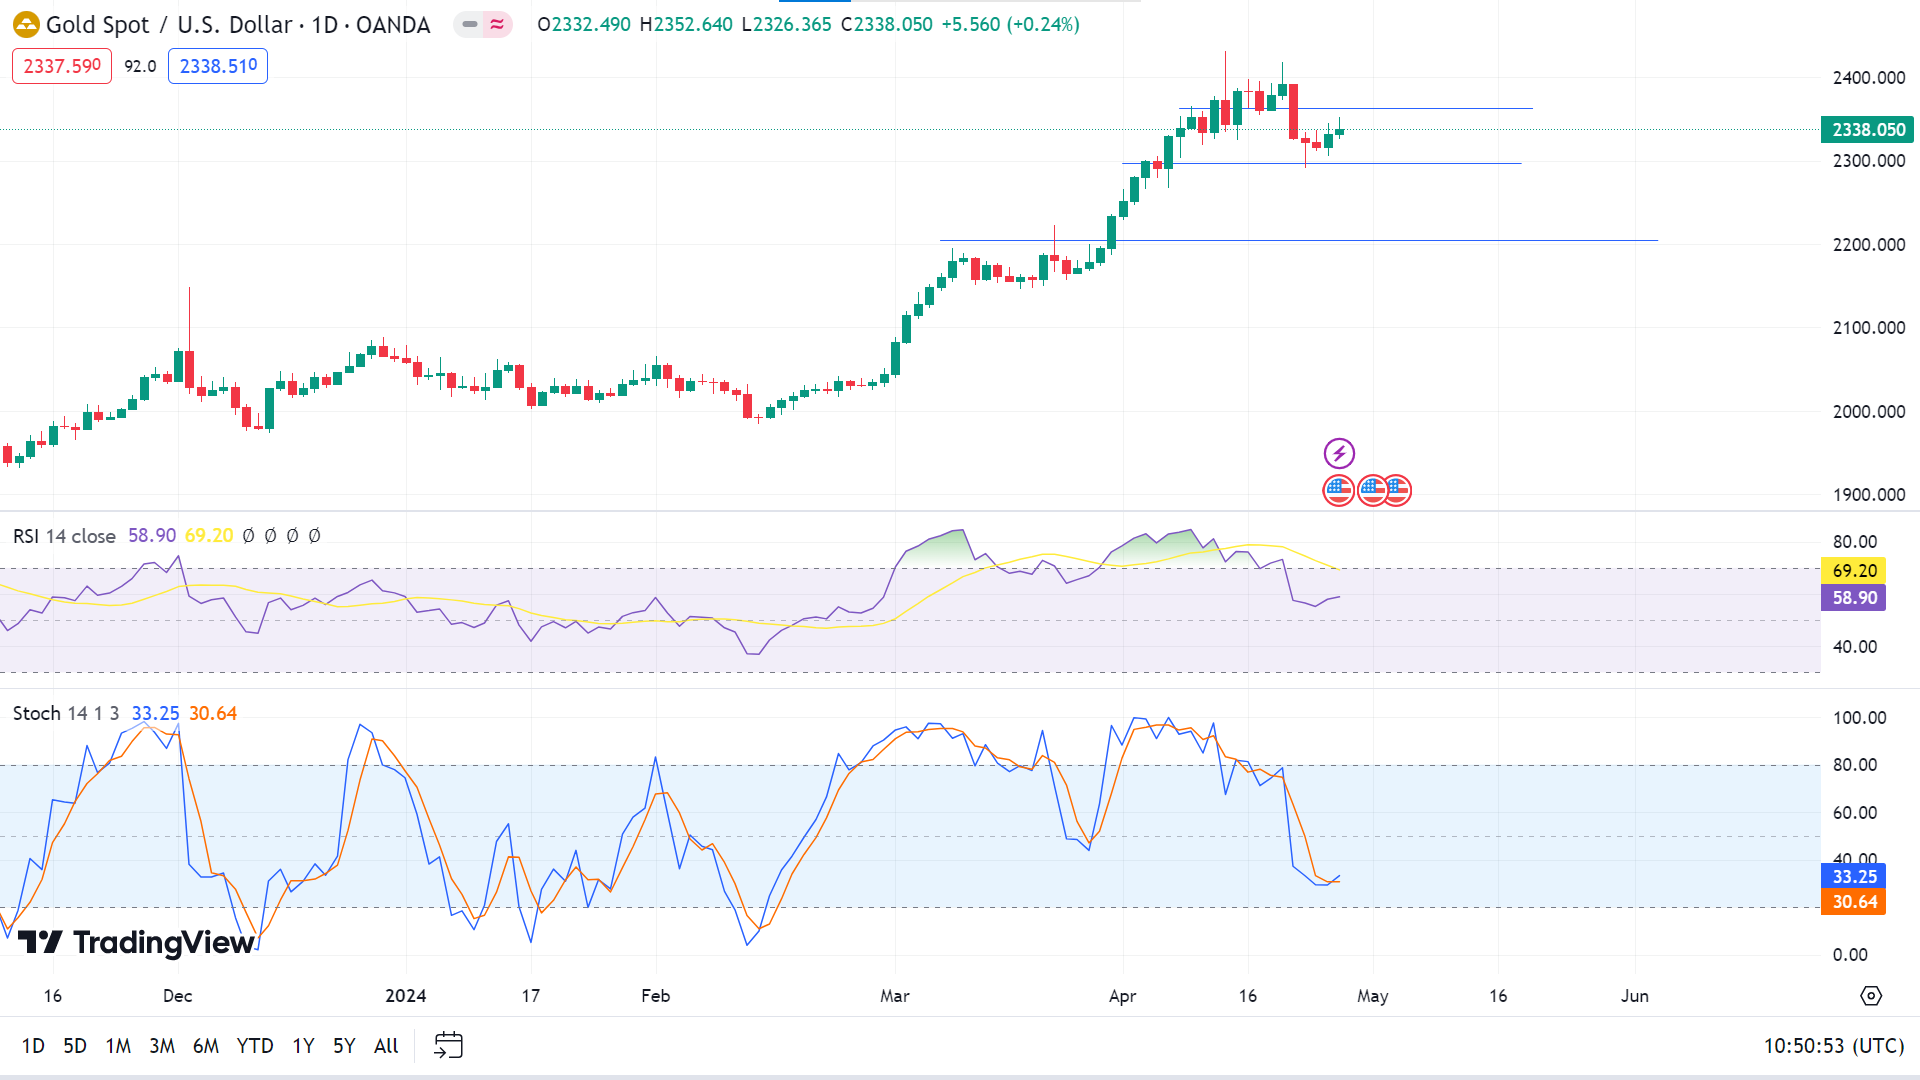
Many technical indicators, such as RSI, MACD, EMA 100, EMA 200, etc., suggest that buy pressure is active on the asset price, which may boost the price to reach the primary resistance of $2363.51. Any successful breakout above can trigger the price to reach the next resistance level near $2417.92.
Meanwhile, Stochastic (9,6) still suggests opening a sell position, which suggests the price may bounce toward the primary support near $2297.72. A break below can trigger the price to reach the next support near $2205.11.
WTI Crude Oil (USOUSD)
Fundamental Perspective
On last Friday, West Texas Intermediate (WTI) crude oil hovered around $83.40 per barrel, marking a slight 0.10% dip.
In contrast, US consumer prices displayed resilience, with the Personal Consumption Expenditures (QoQ) Price Index for Q1 surging at a robust 3.7% annual rate, exceeding both market forecasts and the previous reading.
Comments from US Treasury Secretary Janet Yellen, hinting at a potential upward revision of US GDP growth for Q1 and assuring the normalization of inflation, supported WTI oil prices. However, oil prices remained bolstered by looming supply risks stemming from the Middle East conflict, particularly heightened tensions surrounding potential Israeli intervention in Rafah, Gaza. Escalations, including intensified airstrikes and plans for a full-scale assault despite warnings, have raised concerns about oil supply disruptions in the region.
Oil Prices Forecast Technical Perspective
The weekly candle of Crude oil finished delivering a solid green candle recovering from the previous two consecutive losing weeks, which signals the next candle might be another green one.
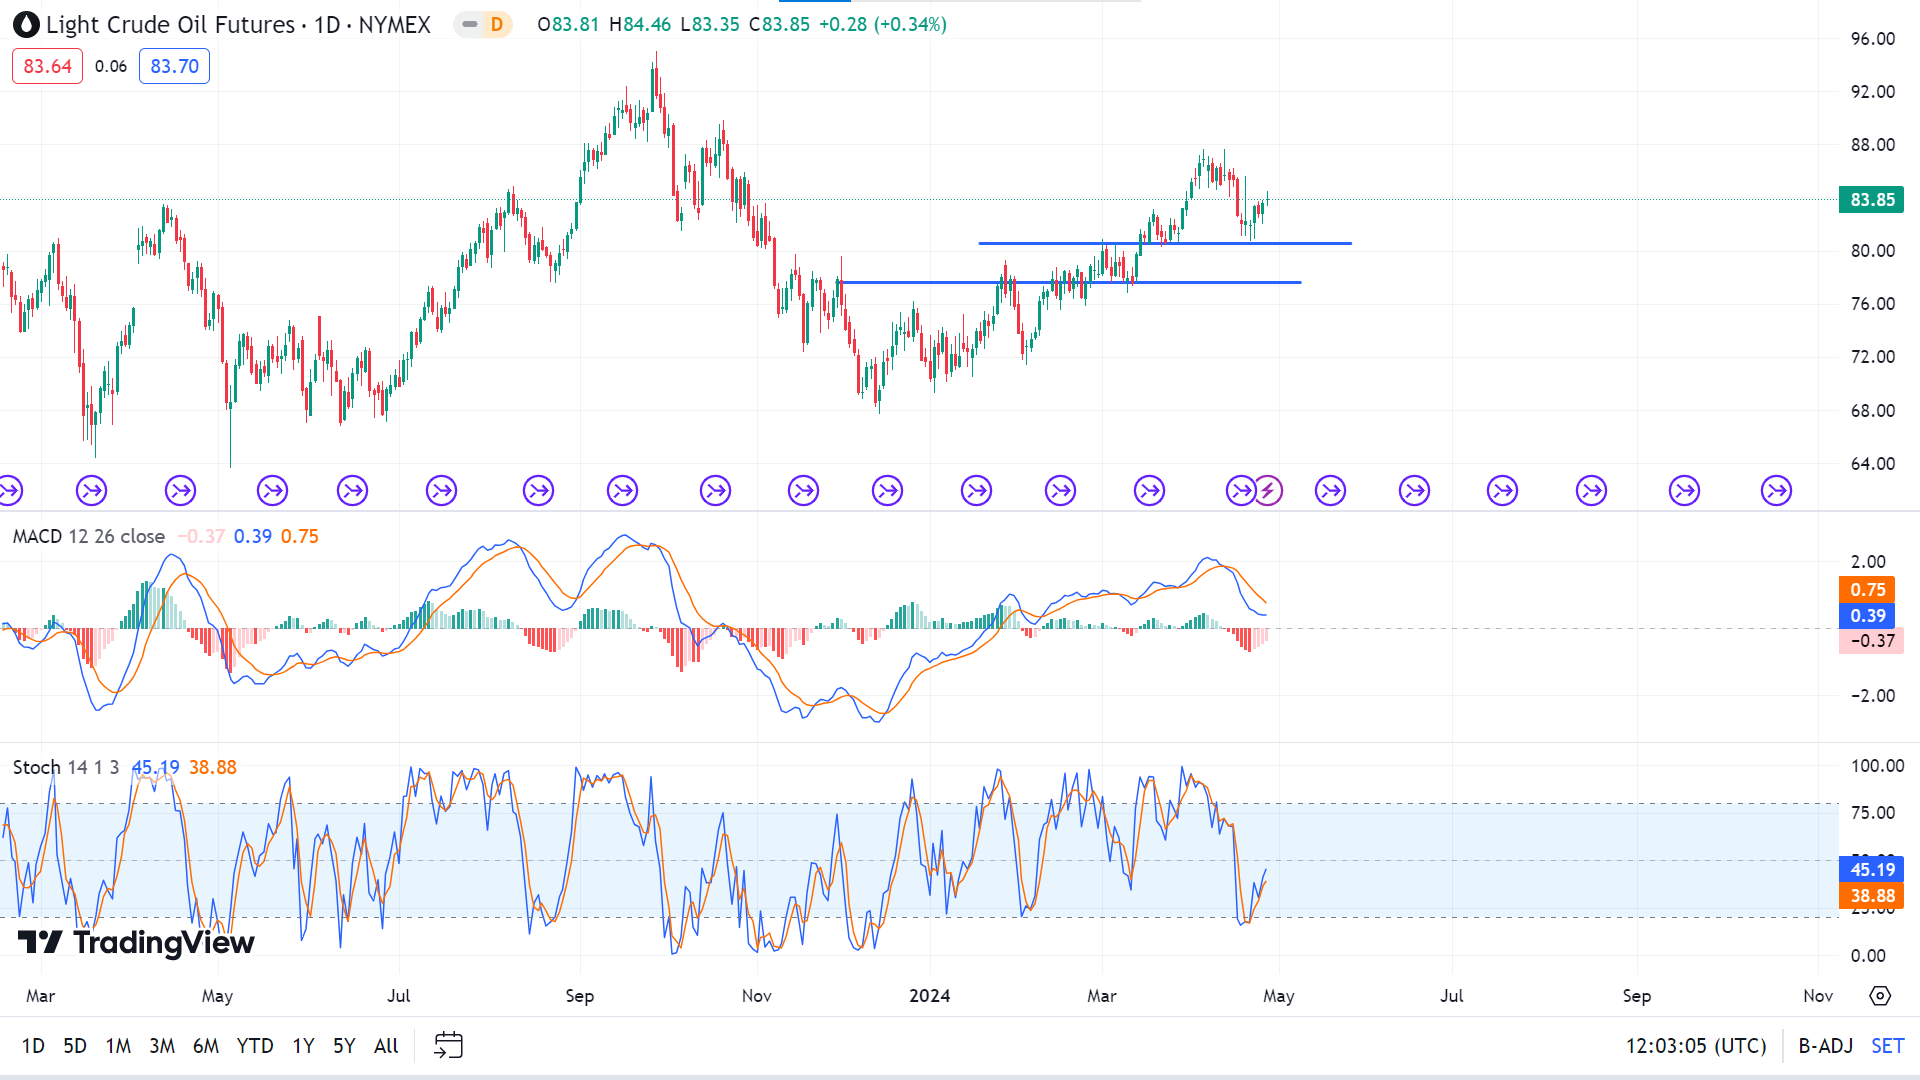
Most popular EMA indicators, including EMA 21, EMA 50, EMA 100, and EMA 200, alongside MACD, are suggesting opening buy positions on the daily chart, indicating the price can reach the primary resistance near $86.40 in the upcoming days, following the next resistance near $92.20.
Meanwhile, the RSI indicator reading remains neutral, and the Stochastic indicator reading remains in sell territory, suggesting that the price can reach the primary support of $80.60, and a break below can trigger the price toward $77.60.


