


EURUSD
Fundamental Perspective
The European Central Bank (ECB) reaffirmed its commitment to combating inflation while maintaining the interest rate unchanged. Also, the bank suggests that it might be prudent to reduce borrowing costs in the near future. The ECB emphasized that reversing interest rates is premature in light of persistent price pressures.
Christine Lagarde warned that trade disruptions resulting from Houthi group attacks on shipping in the Red Sea could cause additional energy and freight cost inflation, affecting the economic perspective.
In the US, the faster-than-anticipated growth rate in the fourth quarter GDP report suggested that the Federal Reserve is not inclined to expedite interest rate reductions. The annualized growth rate of 3.3% in the Advance GDP estimate exceeded the consensus forecast of 2%.
For the week ending January 20th, initial claims for state unemployment benefits increased by 25K to a seasonally adjusted 214K. The substantial surge in demand indicates that the labor market will become more constrained in January, after the holiday season.
Technical Perspective
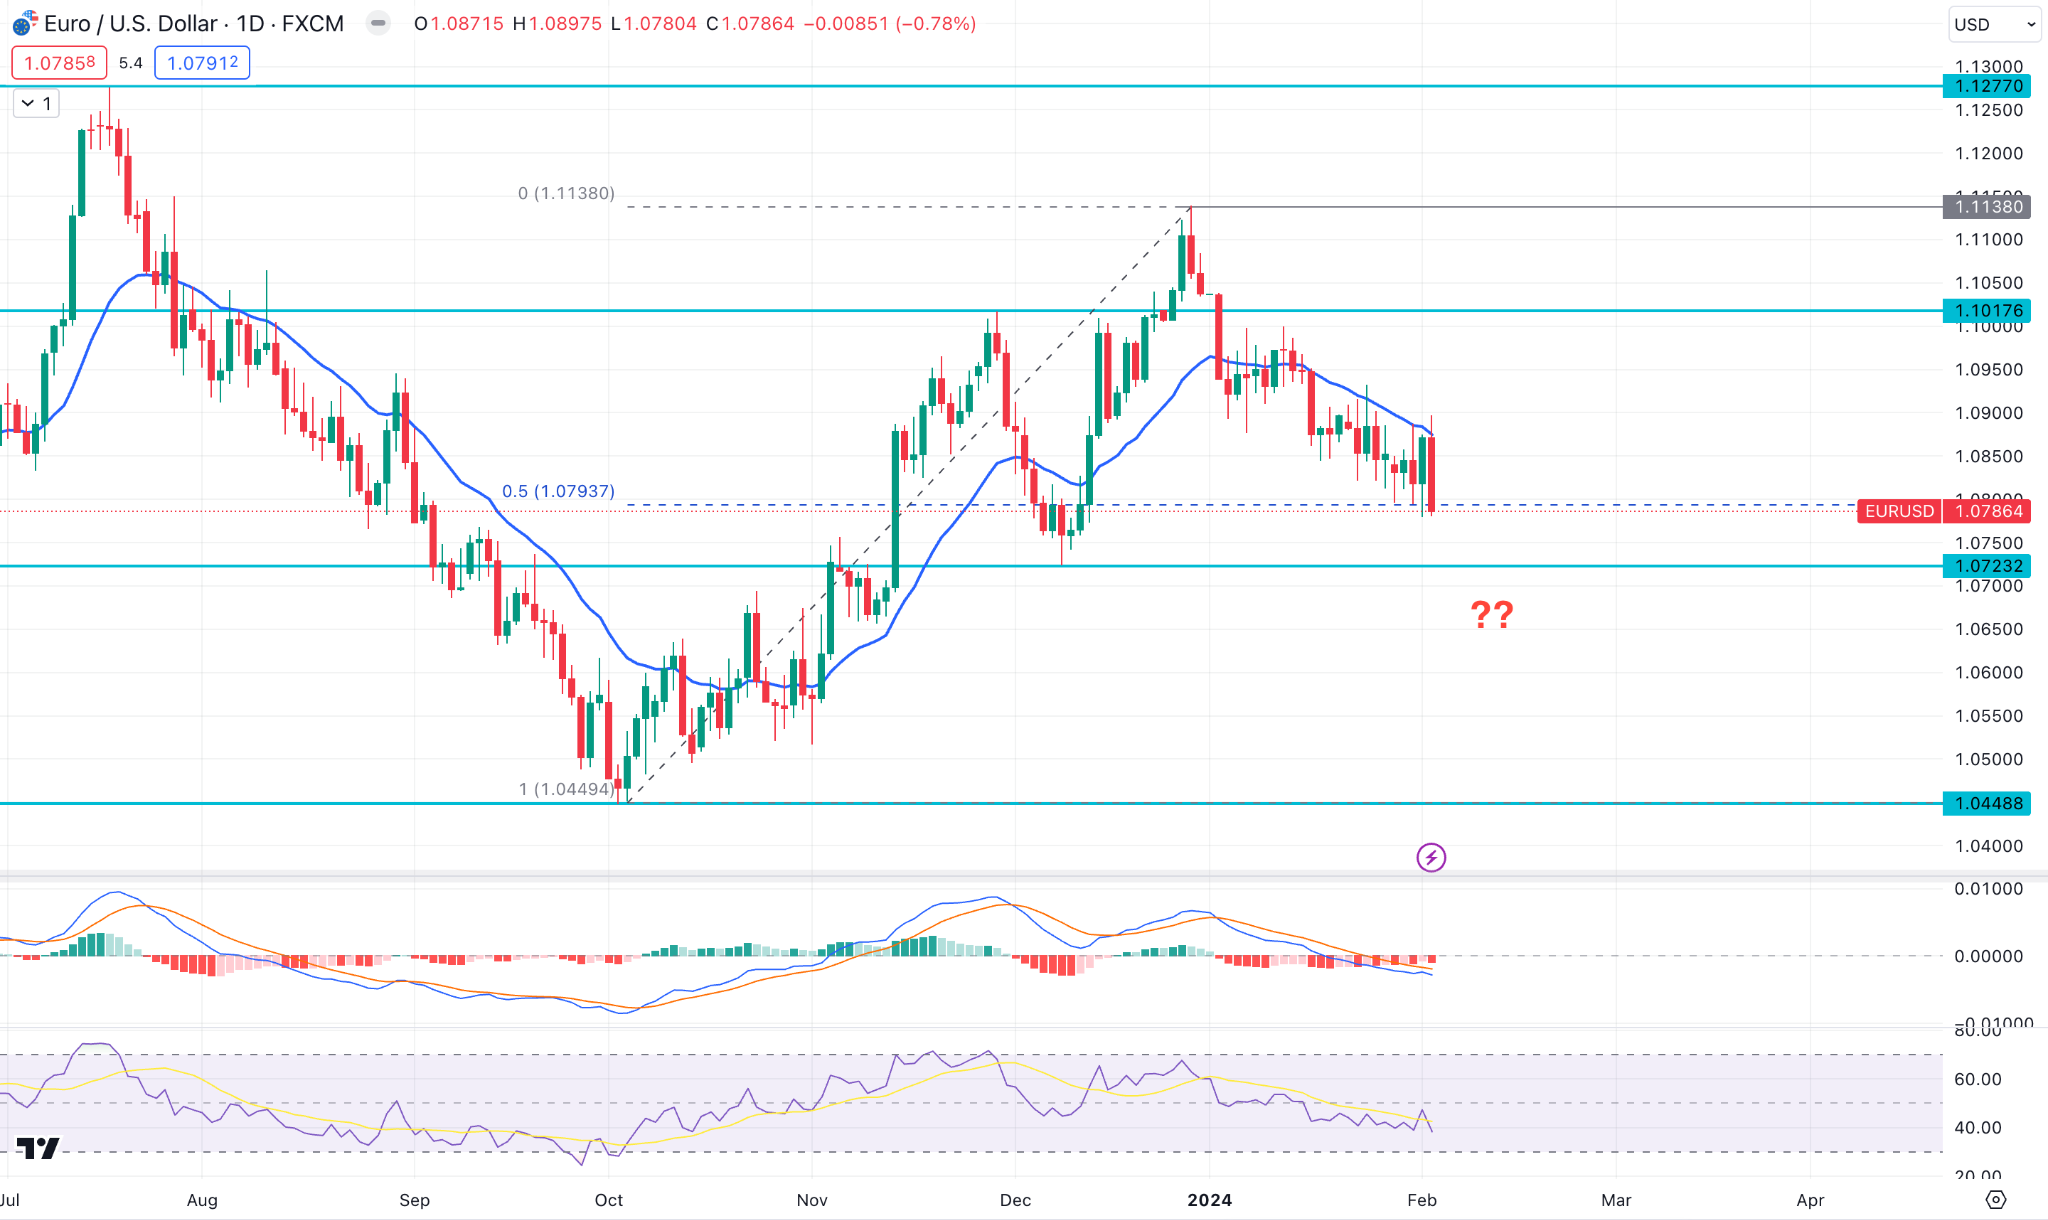
EURUSD weekly price, a bearish close was seen with a new low formation below the 20-week SMA.
In the daily chart, the price still trades above the 50% Fibonacci Retracement level from the current swing. However, a bearish continuation is visible from the dynamic 20-day EMA resistance, while the current MACD Histogram remains bearish below the neutral line.
Based on this outlook, the primary aim in this pair is to test the 1.0723 support level from where a bullish presume might come. However, an immediate upward pressure with a stable market above the 1.0900 level could increase the price above the 1.1000 level.
GBPJPY
As expected, the Bank of Japan (BOJ) maintained its ultra-easy monetary policy with a policy rate of -0.1%. The central bank alluded to the potential termination of negative interest rates shortly.
BOJ Governor Kazuo Ueda stated, "It is a positive development that the probability of reaching the inflation objective of 2%."
In the UK, the Bank of England (BoE) issued its initial monetary policy statement for 2024, maintaining the anticipated policy rate at 5.25%. The accompanying guidance issued by the BoE conveyed inconclusive signals, potentially setting a tone that was less accommodating in nature than initially expected.
The BoE omitted any reference to possible future increases in interest rates. Governor Bailey emphasized the unpredictability surrounding the policy rate hold's duration. Nevertheless, the revised inflation forecasts from the central bank exhibited a tendency towards a more pessimistic position.
During this week's meeting, the stance of BoE policy makers was polarized. One member opted for reduced interest rates, while six maintained the status quo. In light of these circumstances, a rate cut is possible by the BoE during its monetary policy announcement in June.
Technical Perspective
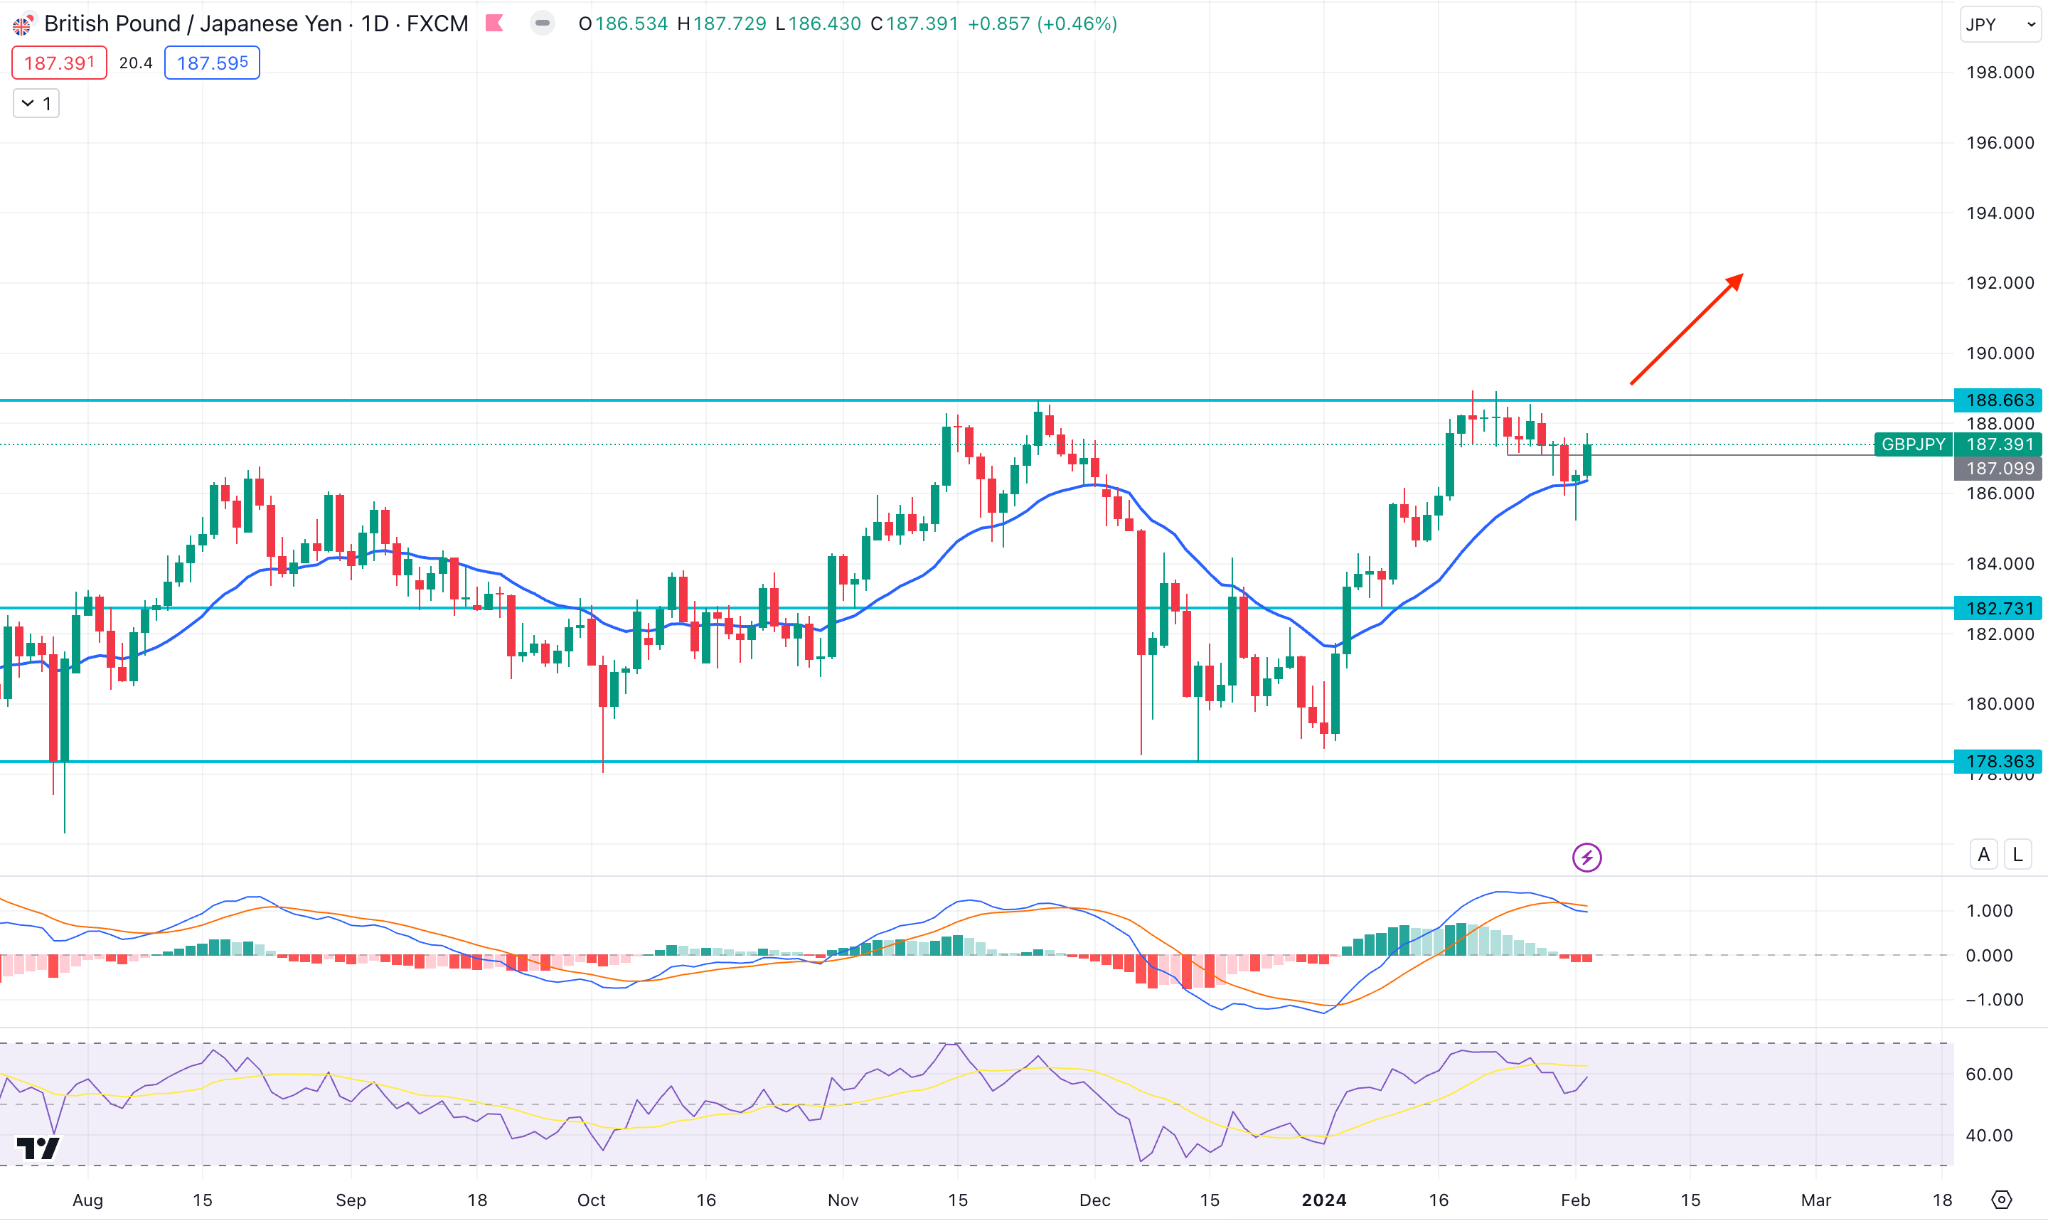
The latest weekly candle closed with an inside bar followed by the long-term bullish trend.
The daily price shows a similar outlook, where the current price trades bullish from the 20-day Exponential Moving Average. A bullish rebound is visible from the 14-day RSI, while the MACD Histogram remains stable below the neutral line.
Based on this outlook, a bullish daily candle above the 188.66 resistance level could increase the price toward the 190.00 area. However, a deeper correction is possible, where the recent price could reach the 184.00 level.
Nasdaq 100 (NAS100)
Fundamental Perspective
Last Friday's employment report occupies a prominent position in the US economy. Nonfarm payrolls increased by 353K in January, almost double the consensus estimate. However, the substantial rise in average hourly wages and strong hiring patterns indicate that the probability of a rate cut in March is rapidly diminishing.
The Federal Open Market Committee (FOMC) decided to sustain its existing monetary policy position by maintaining the rate at 5.25%-5.50% area. Moreover, the Committee's post-meeting statement omitted its implicit inclination to restrict policy further.
Technical Perspective
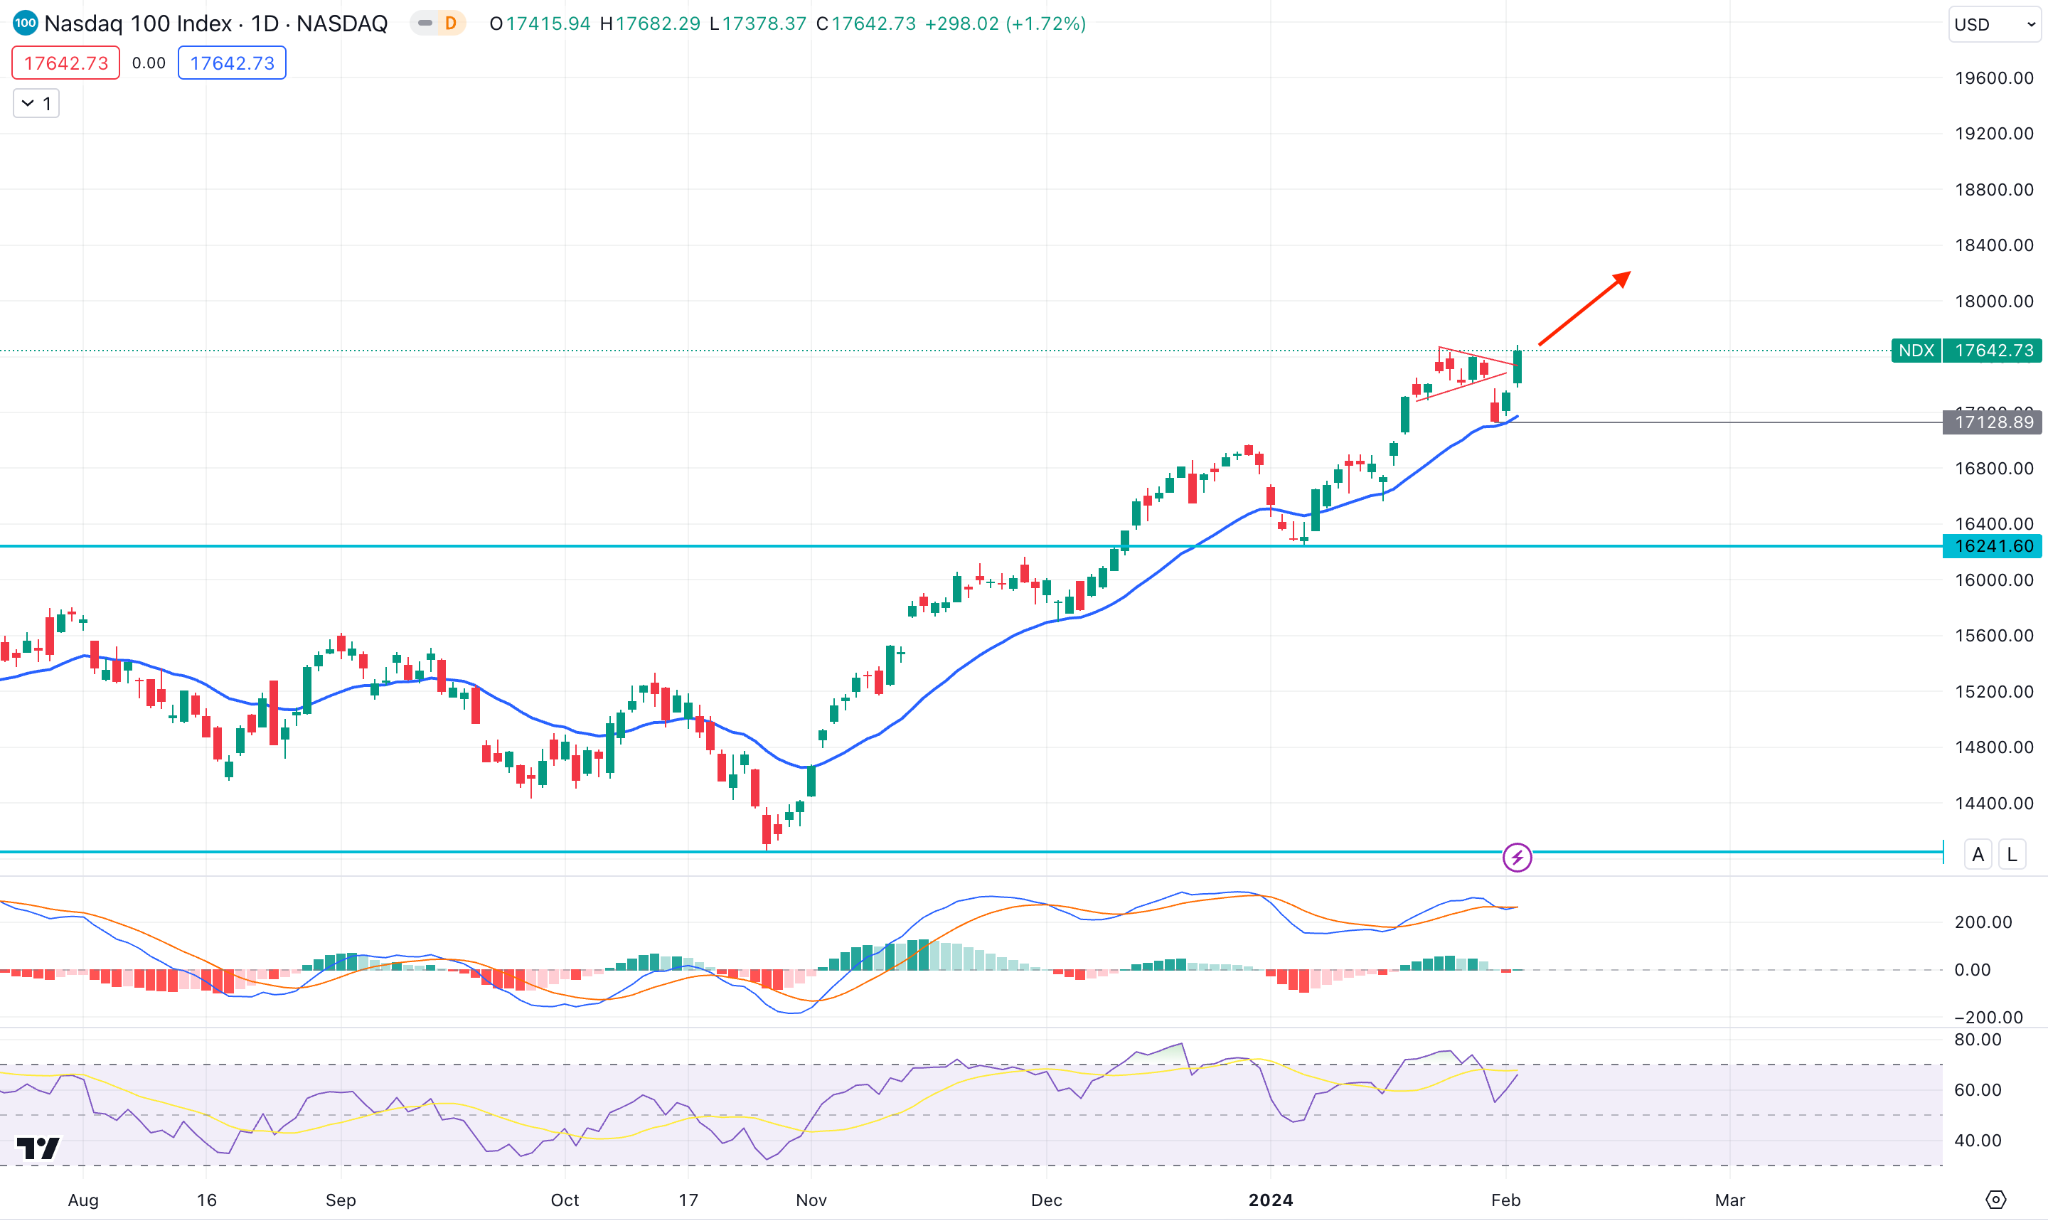
The latest weekly candle closed bullish after an inside bar, which indicates a continuation of a long-term bullish trend.
The daily chart shows the recent sell-side liquidity sweep from the bullish pennant low and an immediate rebound, indicating a stable market momentum.
Moreover, a bullish rebound is visible from the RSI, which rebounded from the 50.00 line, while the MACD Histogram remained corrective. Based on this outlook, a bullish trend trading might make a new all-time high in this instrument. However, a downside momentum might come after forming an exhaustion with a daily candle below the 20 DMA.
S&P500 (SPX500)
Fundamental Perspective
The S&P 500 index reached a record high of 4,958.61 points on February 2, representing an increase of 1.1 percent.
The S&P 500's buying pressure was fueled by gains in IT sectors, reflecting the market's continued exposure to the AI-driven technology boom in 2024. Tech companies accounted for roughly 70% of the gains in the S&P 500 in 2023.
In a year in which the S&P 500 index gained approximately 26%, the IT sector's weighting increased by 57.8 percent. The underperformance of approximately 75% of S&P 500 constituents in 2023 emphasized the IT industry's hegemony.
Presently, the weighting of IT sector stocks in the S&P 500 index is approximately 27 percent, the greatest of any industry. This weighting has increased steadily over time. Seven technology-related companies comprise approximately 38 percent of the S&P 500 index's total market capitalization of $41.128 trillion, comprising the top ten companies.
Technical Perspective
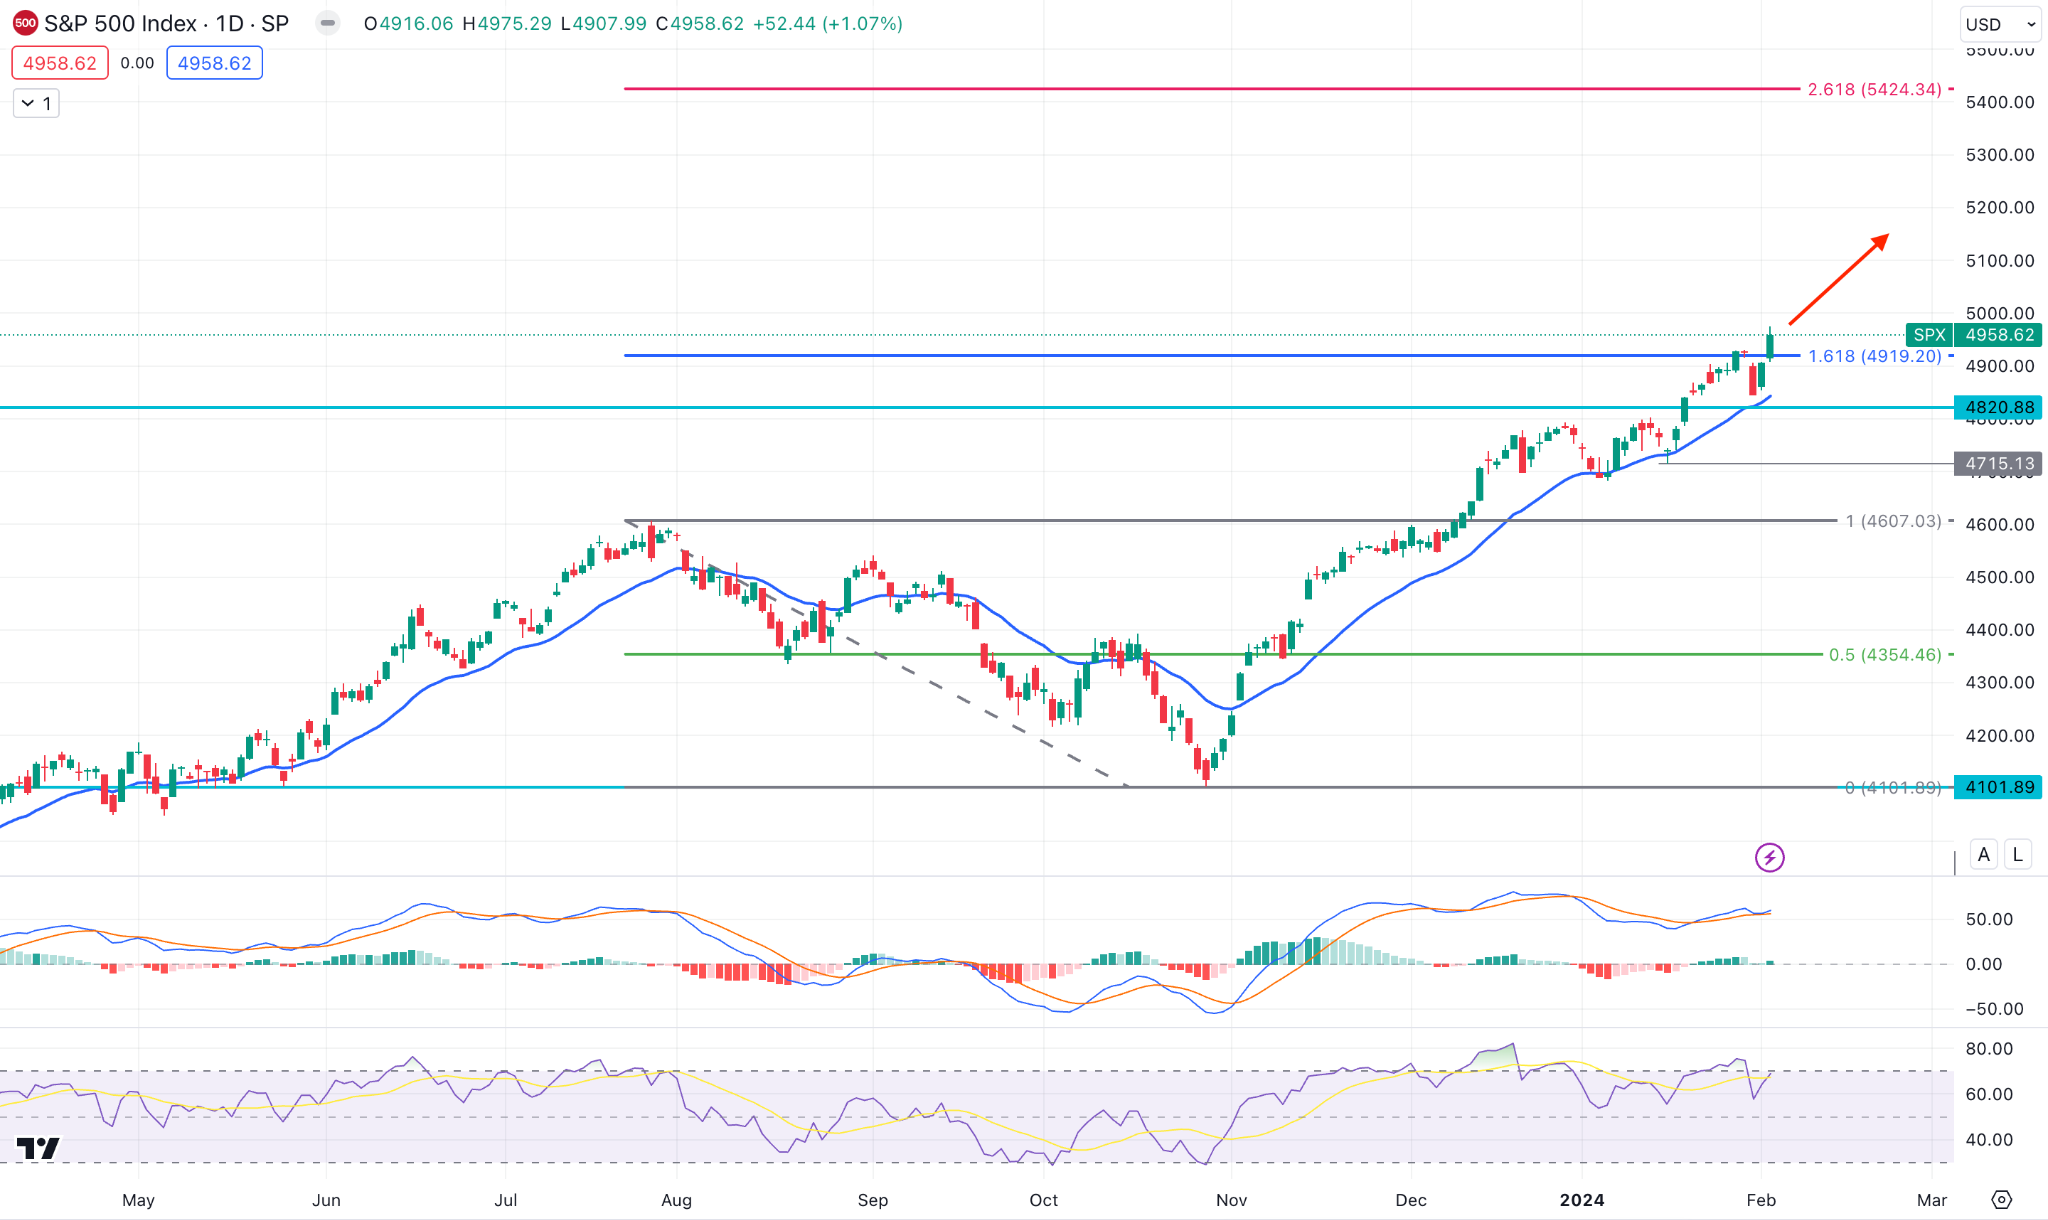
In the weekly chart, a new bullish candle is visible at the all-time high level, which suggests a trend continuation signal.
In the daily chart, the price reached the 161.8% Fibonacci Extension level and made a daily close above it. Moreover, the 14-period RSI rebounded at the 70.00 line, with a green MACD Histogram in play.
Based on this outlook, an upward continuation could take the price toward the 5424.35 resistance level, and the 261.8% Fibonacci Extension level from the existing swing. However, downside recovery is possible, where a daily candle below the 4830.88 level could extend the correction in the coming days.
Hang Seng Index (HK50)
Fundamental Perspective
The Hang Seng index decreased on Friday, with a weekly decline of 2.62% as traders grew pessimistic after reports that Hong Kong was preparing to implement a domestic security law.
Many analysts issued warnings regarding the potential for the proposed legislation to cause substantial unpredictability within the city's business community. Renewed apprehensions regarding proposed US legislation that could impede the access of Chinese biotechnology firms to the American market contributed to a substantial 21.4% decline in Wuxi Biologics.
The 2.5% decline in Lenovo Group Ltd.'s revenue can be attributed to difficulties in the semiconductor industry, escalating tensions between China and the United States. Meituan (-1.4%), J&T Global Express Ltd. (-15.2%), Miniso Group (-4.0%), Innovent Biologics (-3.5%), and AIA Group (-2.7%) were among the other notable decliners.
Technical Perspective
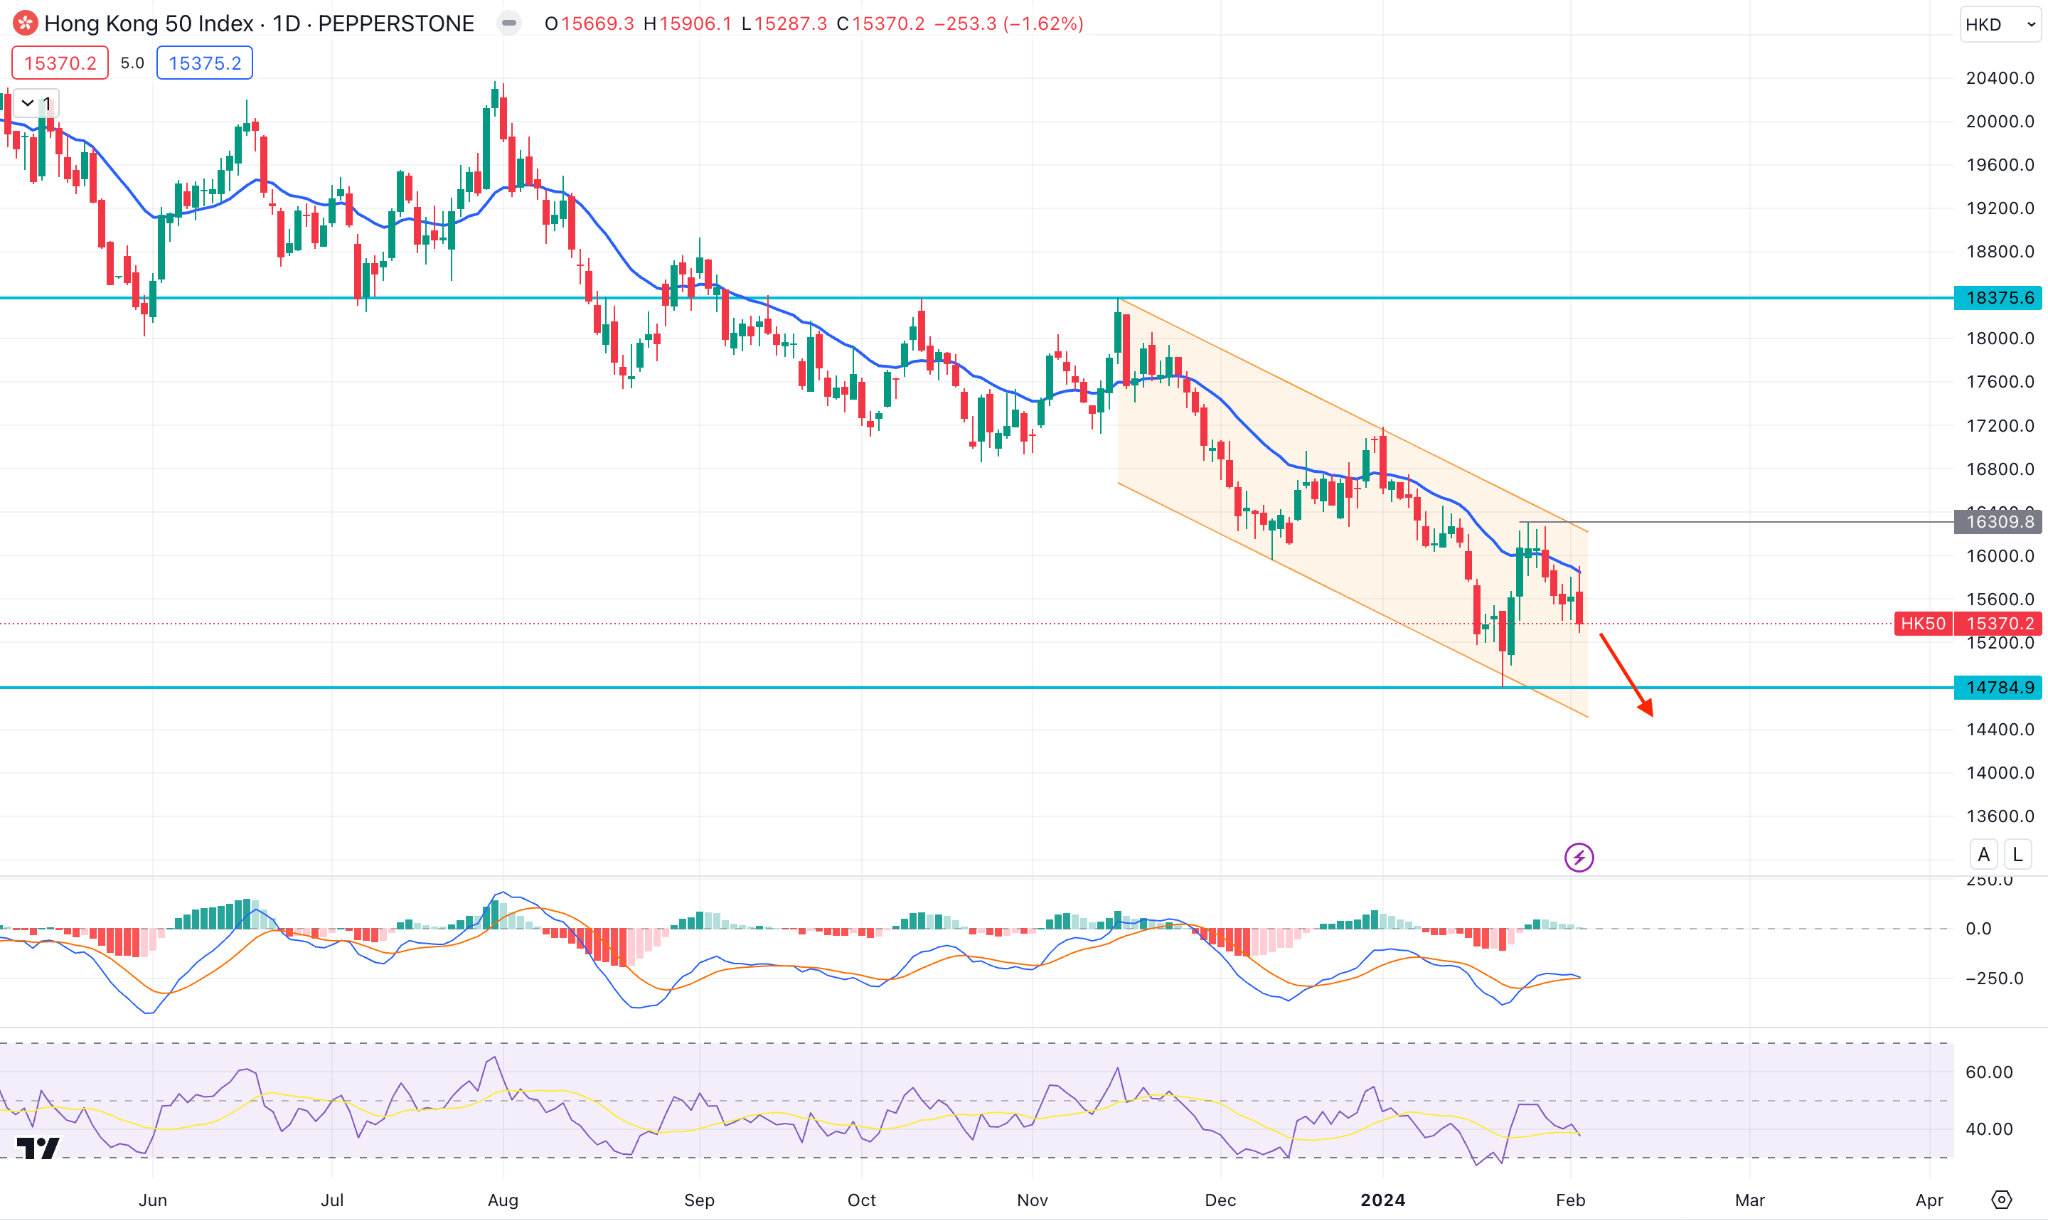
The HK 50 weekly chart shows a bearish continuation as the latest candle rebounded after eliminating the last bullish candle’s body.
In the daily chart, the downside continuation is potent from the 20-day EMA, while the RSI remains downwards to the 30.00 line. In that case, a bearish possibility is potent, where the main aim is to test the 14784.90 support level.
However, a bullish rebound is potent, where a stable market after the channel breakout could offer a long opportunity.
Bitcoin (BTCUSD)
Fundamental Perspective
The Social Dominance Metric, an indicator of how much Bitcoin is discussed on platforms such as X, reveals a decrease in the currency's dominance. Altcoin discourse appears to be gathering momentum, a pattern frequently occurring before Bitcoin price increases over the last half-year.
As reported by Bloomberg Intelligence, BIT, FBTC, ARKB, and BITB ETFs all witnessed capital inflows for the initial fourteen consecutive trading days. In contrast, Grayscale's GBTC has consistently witnessed outflows since its conversion.
Sustained inflows into Bitcoin ETFs indicate that investor demand for Bitcoin continues to rise, especially as ETF issuers such as BlackRock continue to acquire Bitcoin on over-the-counter markets.
Technical Perspective
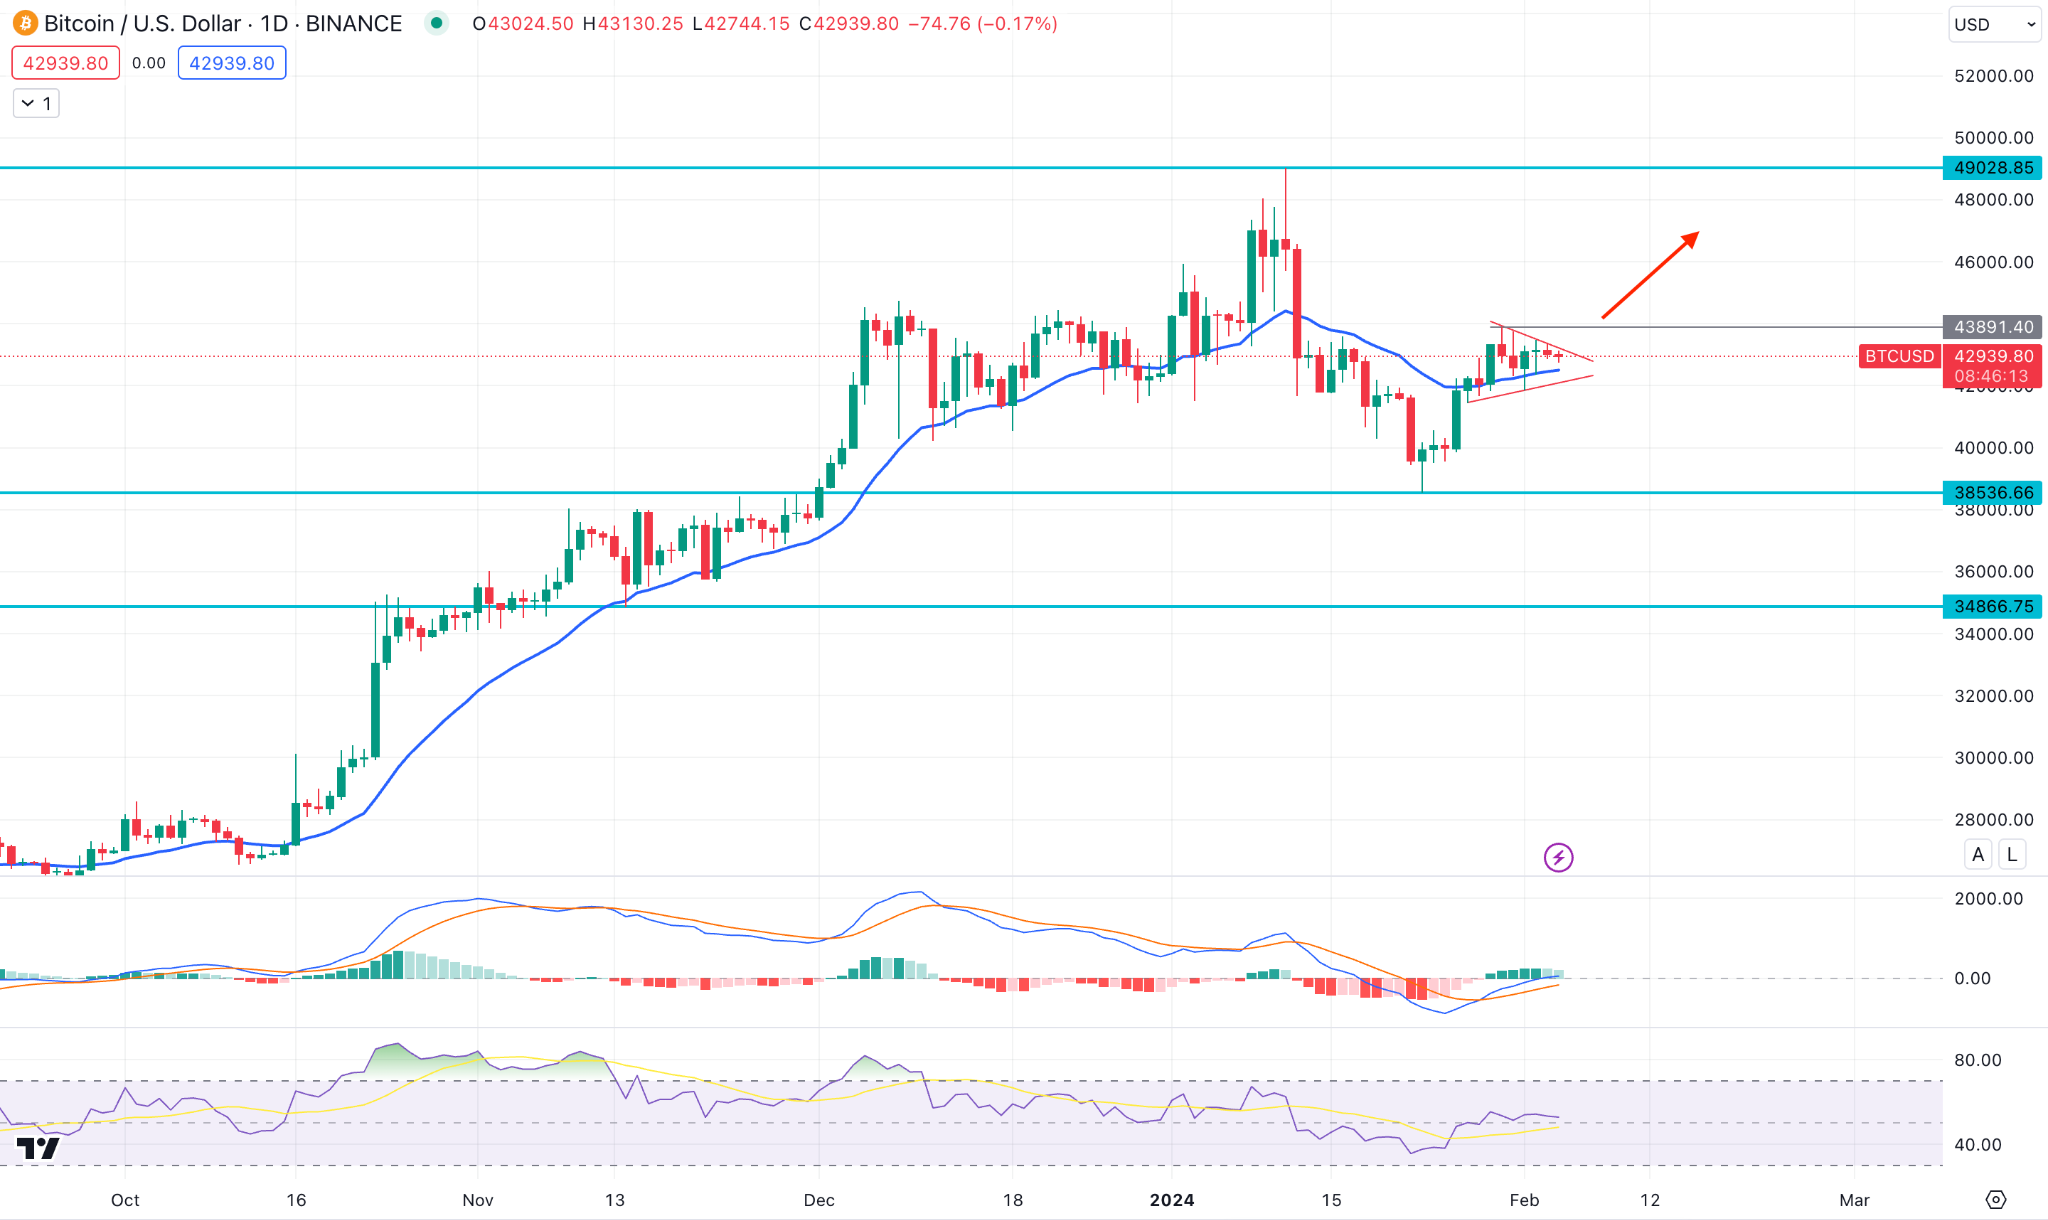
BTCUSD price has remained sideways in recent days, where the long-term upward pressure is visible above the 20-day EMA. Moreover, a sideways momentum is visible from the 14-day RSI, while the MACD Histogram is positive. In that case, a bullish pennant breakout with a D1 candle above the 43891.40 level could be a valid long opportunity.
On the other hand, a downside pressure might extend toward the 38536.66 level, from where another buying pressure might come.
Ethereum (ETHUSD)
Fundamental Perspective
Whale Alert notified the cryptocurrency community on February 4 that an address that had been inactive for the past eight and a half years and contained one hundred Ethereum (ETH) coins had been reactivated.
As of the most recent market assessment, the value of the cryptocurrency stored at the specified address was $230,159. Such fluctuations frequently elicit speculative activity in the market. Reactivating dormant addresses may lead to a sell-off in certain cases, while the holder may opt to transfer the coins to a different address.
Almost 20% of the one hundred ETH that Coin Edition monitored had been transmitted to a new address. However, the nature of this transaction remains unknown.
Technical Perspective
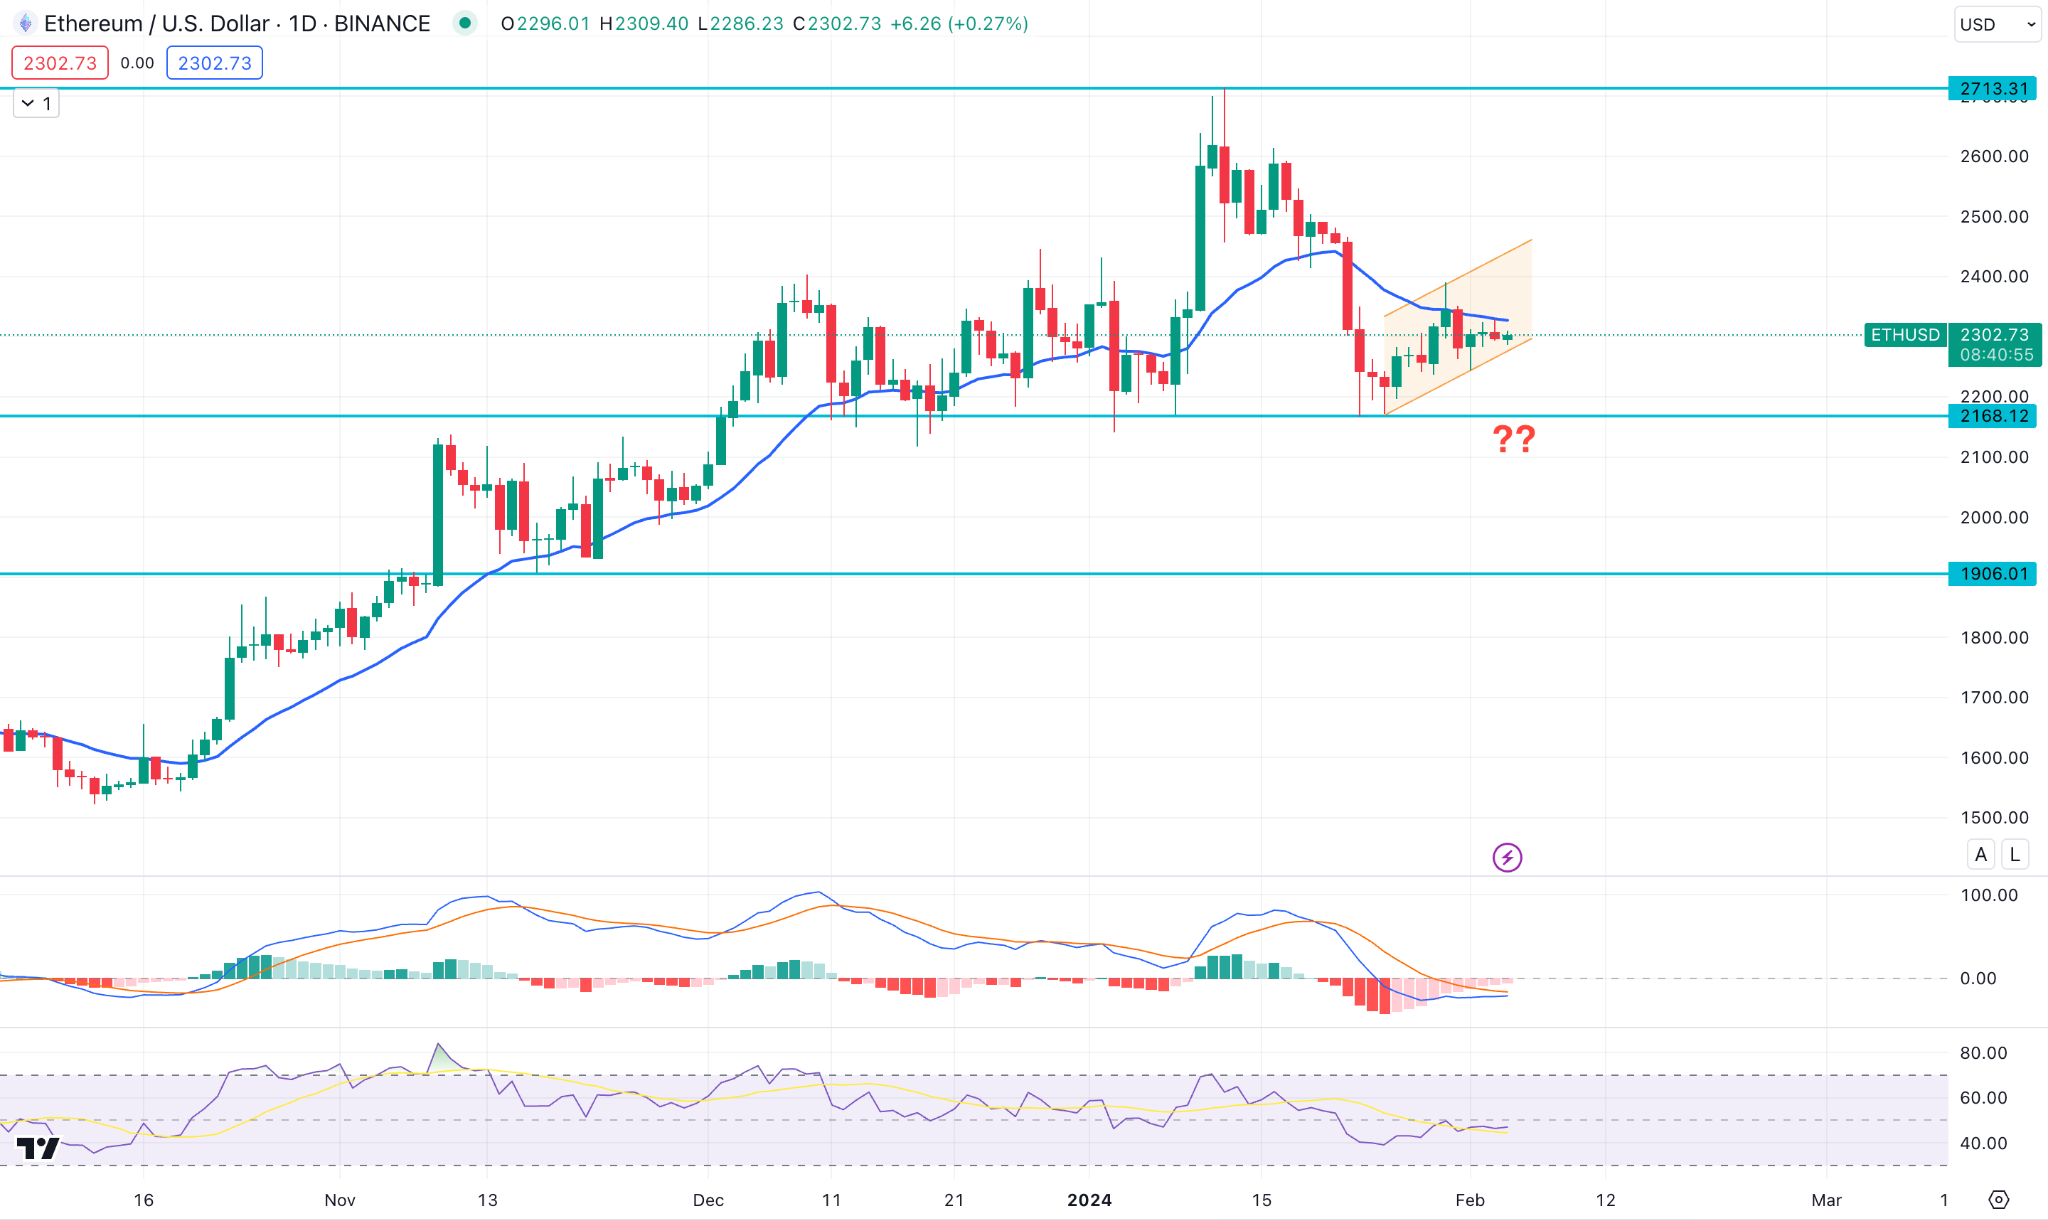
A sideways market is visible in the weekly chart, where the latest candle closed as an inside bar from the previous bearish weekly candle.
Moreover, the daily price remained stable at the ascending channel support, where the current MACD Histogram is bearish.
In that case, a new low below the 2168.12 support level, could be a strong bearish opportunity, aiming for the 1906.00 level. However, a rebound from the channel support with a daily cable above the 20 DMA could alter the current market structure and initiate a bull run.
Tesla Stock (TSLA)
Fundamental Perspective
Tesla Inc. has issued a recall notice for around 2.2 million vehicles, including all models, due to apprehensions surrounding the diminutive font size of instrument panel warning lighting. This recollection signifies the most extensive in the annals of Tesla and is exclusive to the Cybertruck. Due to the potential for accidents caused by the inability to comprehend critical safety information, the recall was initiated.
Federal Motor Vehicle Safety Standards have been violated, as determined by the National Highway Traffic Safety Administration (NHTSA). The vehicles in question have warning indicators for the parking system, brakes, and antilock brake system with font sizes less than 3.2 mm.
The recall pertains to many models, comprising the 2024 Cybertruck, Model X, Model S, and Model 3. Tesla plans to address the matter by means of a complimentary over-the-air software update that will be distributed to customers.
Technical Perspective
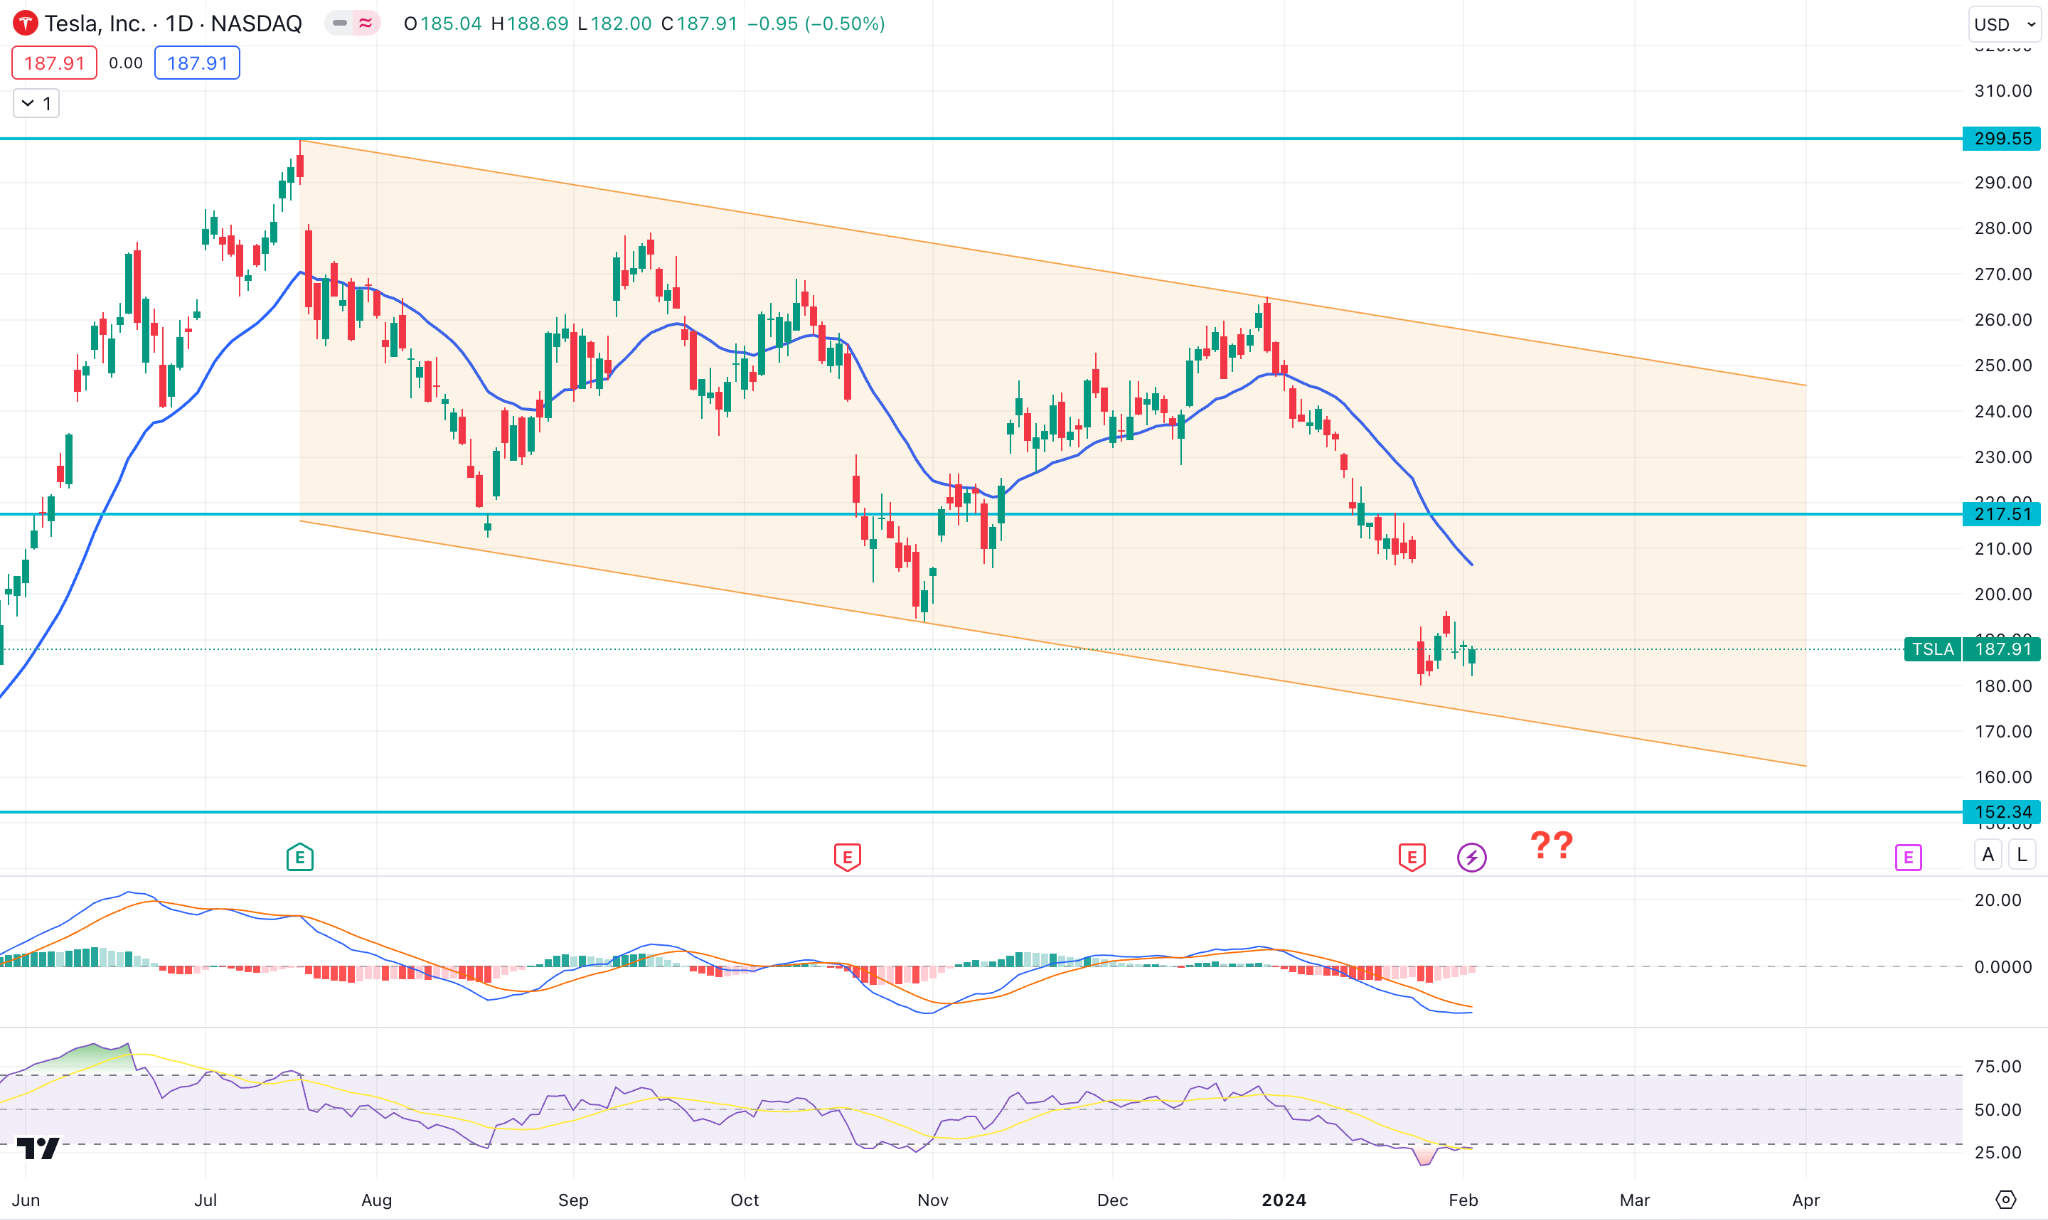
TSLA Stock remained sideways last week, where the current price still trades above the ascending channel support. The bearish MACD Histogram starts to lose momentum and reaches the neutral level, while the RSI is at the 30.00 area.
As long as the price trades above the 152.36 key support level, we may expect the buying pressure in the coming days. However, a steep selling pressure is possible below the channel support, which could signal exhaustion.
Gold (XAUUSD)
Fundamental Perspective
At the start of the week, gold experienced a significant increase, supported by escalating geopolitical tensions and falling US yields. As a result of reports of a drone strike near the Jordan-Syria border, the metal increased by more than 0.5% on Monday. Amid mounting anticipation surrounding the policy announcements of the Federal Reserve, gold maintained a comparatively stable position.
As expected, the Federal Reserve maintained the policy rate between 5.25% and 5.5% on Wednesday. In lieu of this, the Fed emphasized its dedication to monitoring incoming data to determine the most prudent course of action.
At the outset, the US Dollar lost its momentum due to the dovish stance, which caused a marginal increase in the XAU/USD pair. However, the USD rallied in response to Fed Chairman Jerome Powell's post-meeting press conference remarks. As a result, Gold's gains in the late American session were capped.
Nevertheless, Gold retraced its previous week's gains on Friday, eroding most of its weekly surge subsequent to the January employment report. An increase in wage inflation and nonfarm payrolls both surpassed market expectations by a substantial margin.
Technical Perspective
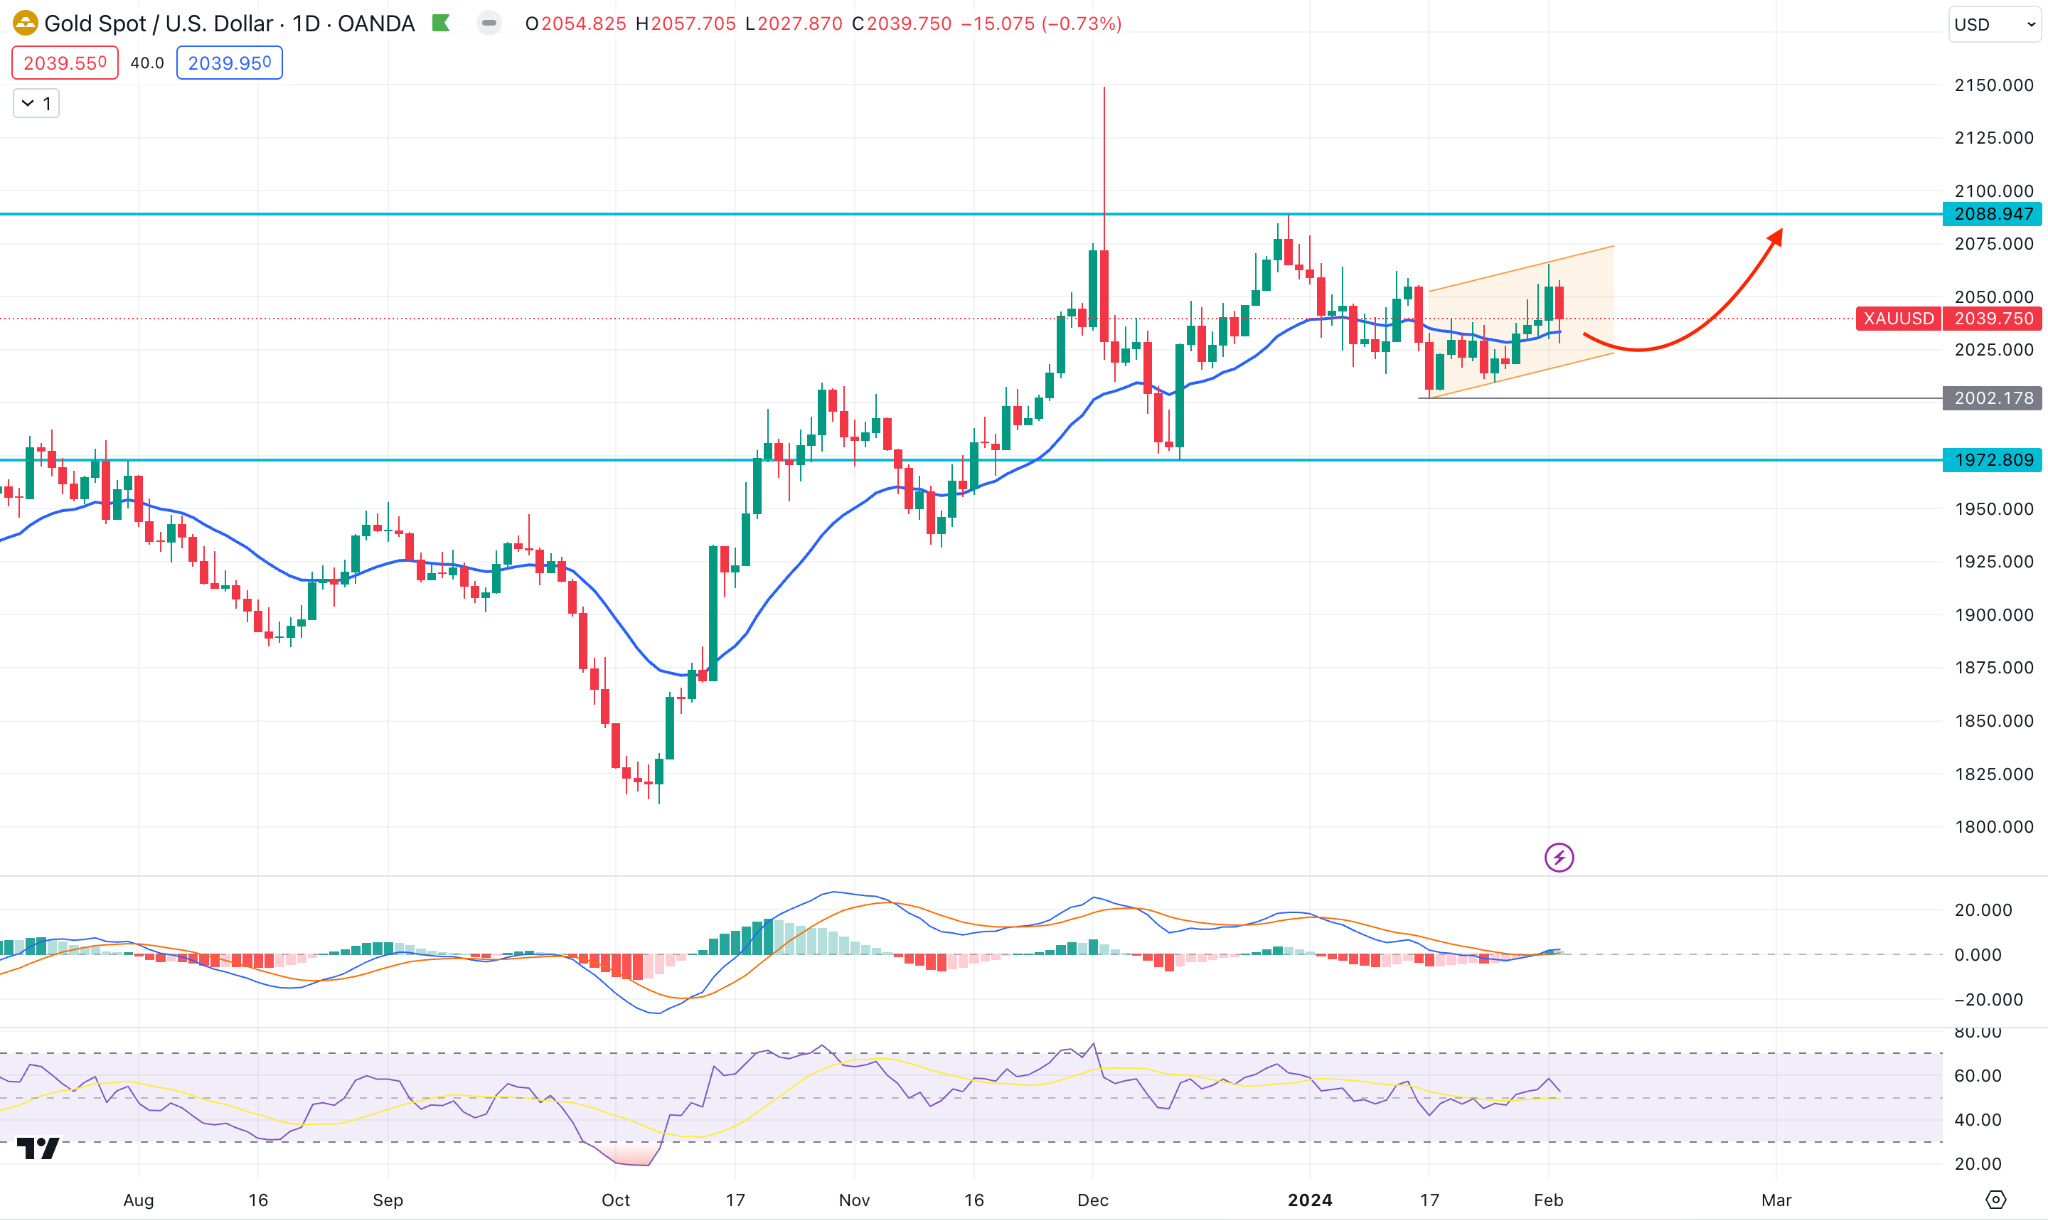
In the weekly chart, XAUUSD rebounded higher with a two-bar bullish continuation. However, a minor downside pressure has come from the upbeat US employment report, where the closing level is still above last week’s opening.
In the daily chart, the recent price trades above the 20-day EMA, while the ascending channel is an immediate support. In that case, selling pressure might come after having a channel breakout with the RSI below the 50.00 line.
On the bullish side, the ongoing uncertainty could be a strong factor to consider, which could take the price above the 2088.94 level without a prior signal.
WTI Crude Oil (USOUSD)
Fundamental Perspective
Developments in the Middle East substantially impact crude oil prices, which in turn dictate market sentiment. On Thursday, WTI prices underwent a substantial reversal, falling 2.5% in reaction to the announcement of a ceasefire between Israel and Hamas.
This decline persisted on Friday by the same margin. Oil price volatility is exacerbated by the ongoing tension in the Middle East, which includes the participation of the US and the UK militaries in the conflict with Houthi rebels in Yemen.
Notwithstanding the geopolitical apprehensions, the extent to which a risk premium should be ascribed to the Middle East remains uncertain. The strong performance of the U.S. economy in nonfarm employment data on Friday provides further evidence for the anticipation of heightened oil demand from the largest economy globally.
The IMF now projects a 3.1% expansion in the global economy for the current year, an increase from the 2.9% expansion projected in October. This expansion is expected to further accelerate to 3.2% by 2025. A partially alleviated concern has emerged regarding the Eurozone's economy after its narrow escape from a technical recession.
It is anticipated that the improved outlook for oil demand from the West will aid in maintaining price stability. However, for sustained support, China's economy must shortly demonstrate signs of improvement, reducing the likelihood of oil price declines.
Technical Perspective
The weekly chart shows a strong bearish reversal where the latest candle closed downwards with a two-bar continuation. Moreover, the daily price showed a bullish sweep from the 76.18 high and moved below the 20-day EMA.
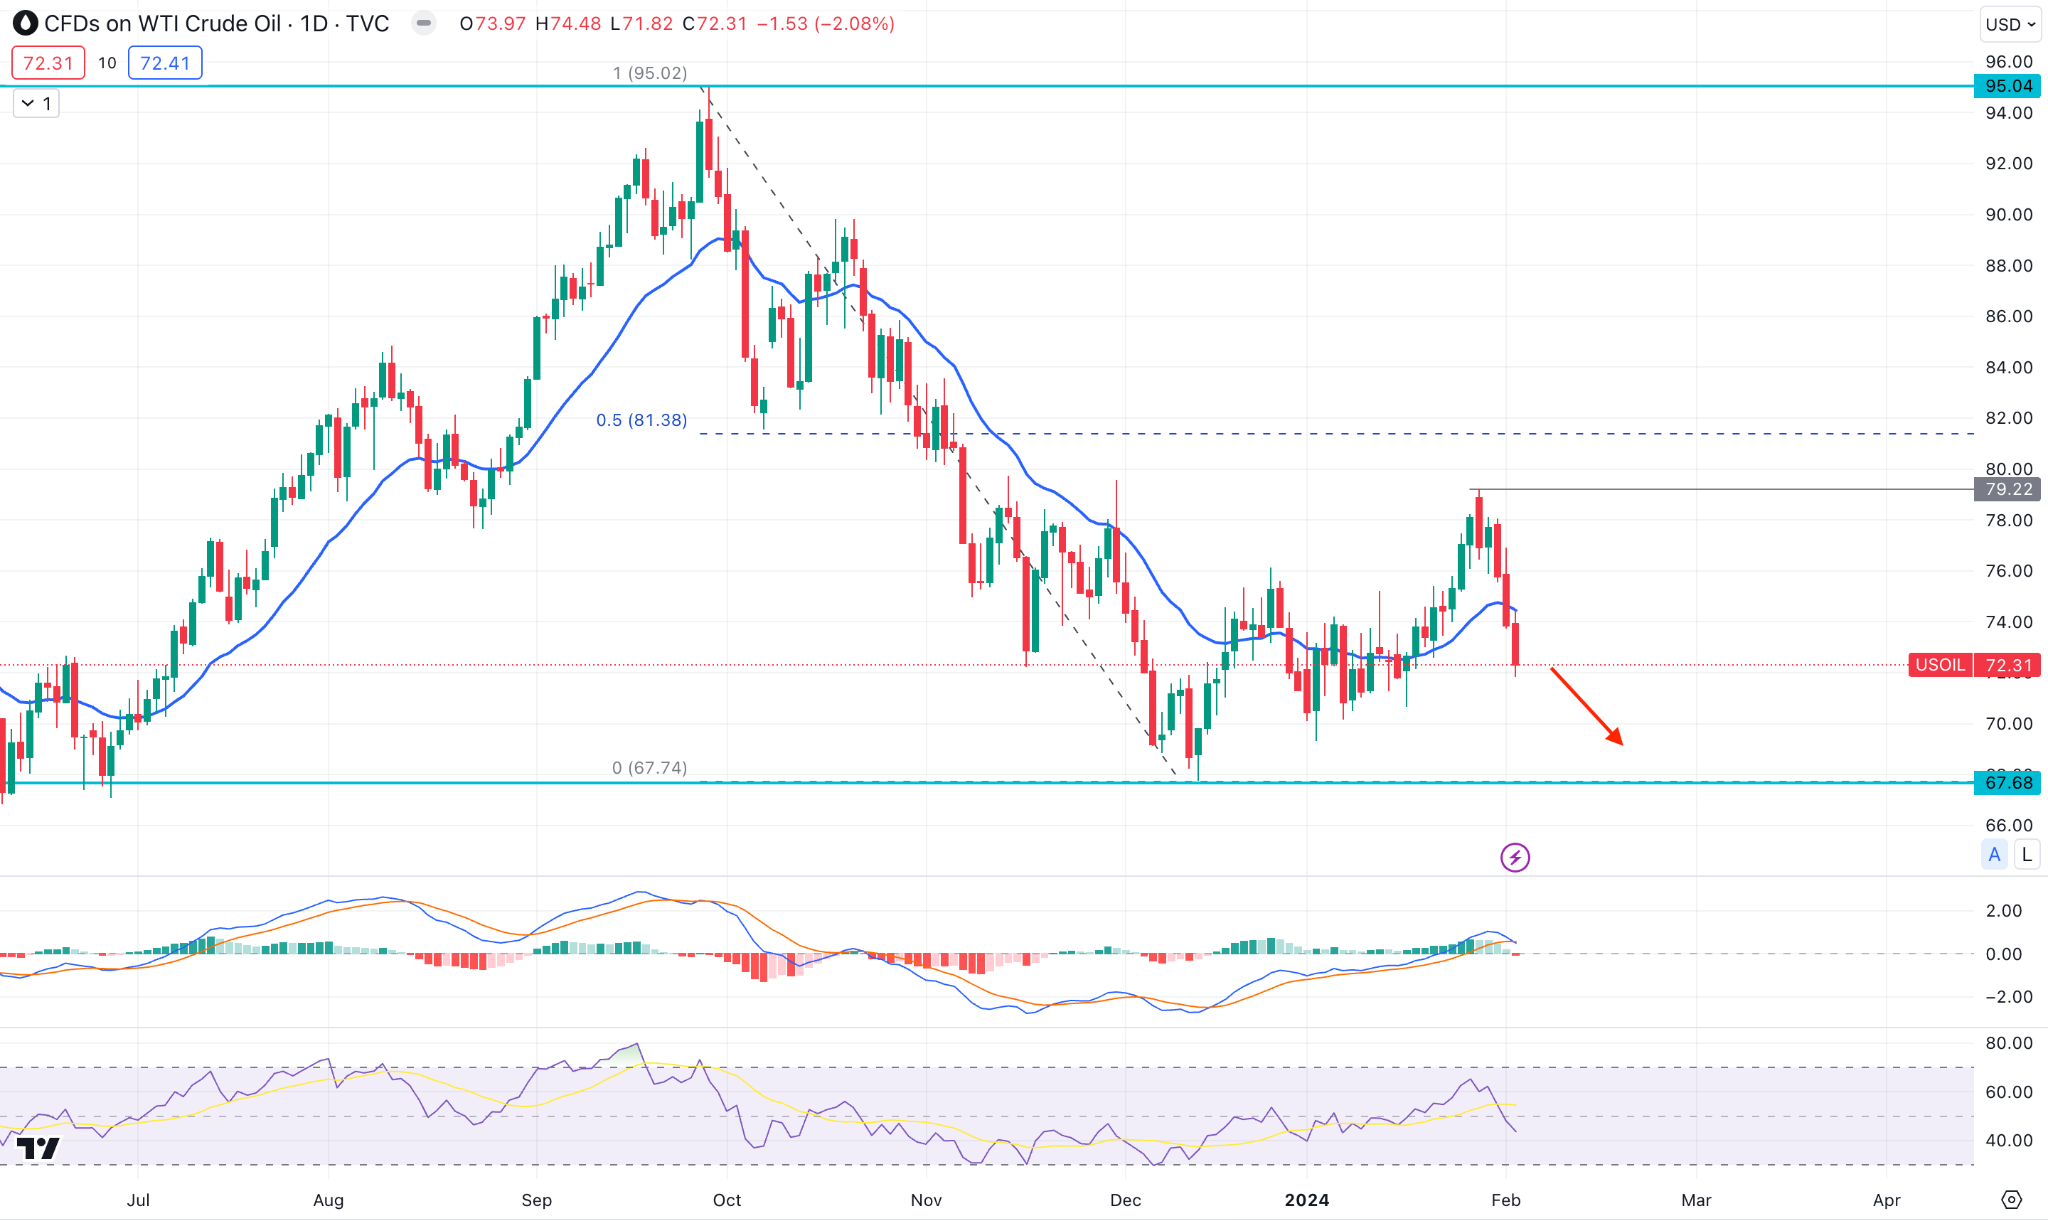
Based on this structure, a downside continuation is potent, where the main aim is to test the 67.68 support level, from where a bullish correction might come.


