


EURUSD
Fundamental Perspective
The most recent German ZEW Survey on Economic Sentiment indicated a positive trend in February, with the evaluation of the present circumstances plummeting to -81.7. Furthermore, the European Union disclosed that the Trade Balance for December exhibited a surplus of €16.8 billion, a reduction from the preceding surplus of €20.3 billion. Positively, industrial production increased 2.6% in December, surpassing the expected decrease of 0.2%.
Christine Lagarde, the president of the European Central Bank (ECB), concluded her testimony before the European Parliament's Committee on Economic and Monetary Affairs. Lagarde reaffirmed that additional data is necessary for the central bank to validate the progress of inflation towards the intended 2% target.
For the US Dollar, the earlier anticipation was that the Federal Reserve would commence easing by an estimated 160 basis points in 2024. This month, however, these dovish forecasts have been revised due to the stronger-than-anticipated U.S. employment growth and persistent inflation data. Presently, only 80 basis points of rate decreases are anticipated by traders for the entire year.
The recent change in the Fed policy has strengthened the DXY index by 1.8% over the previous three weeks. Although future gains might not adhere to a linear pattern, there appears to be a possibility for additional US Dollar bulls.
This week, two noteworthy events will command attention: the FOMC minutes and the S&P Global PMIs for February.
Technical Perspective
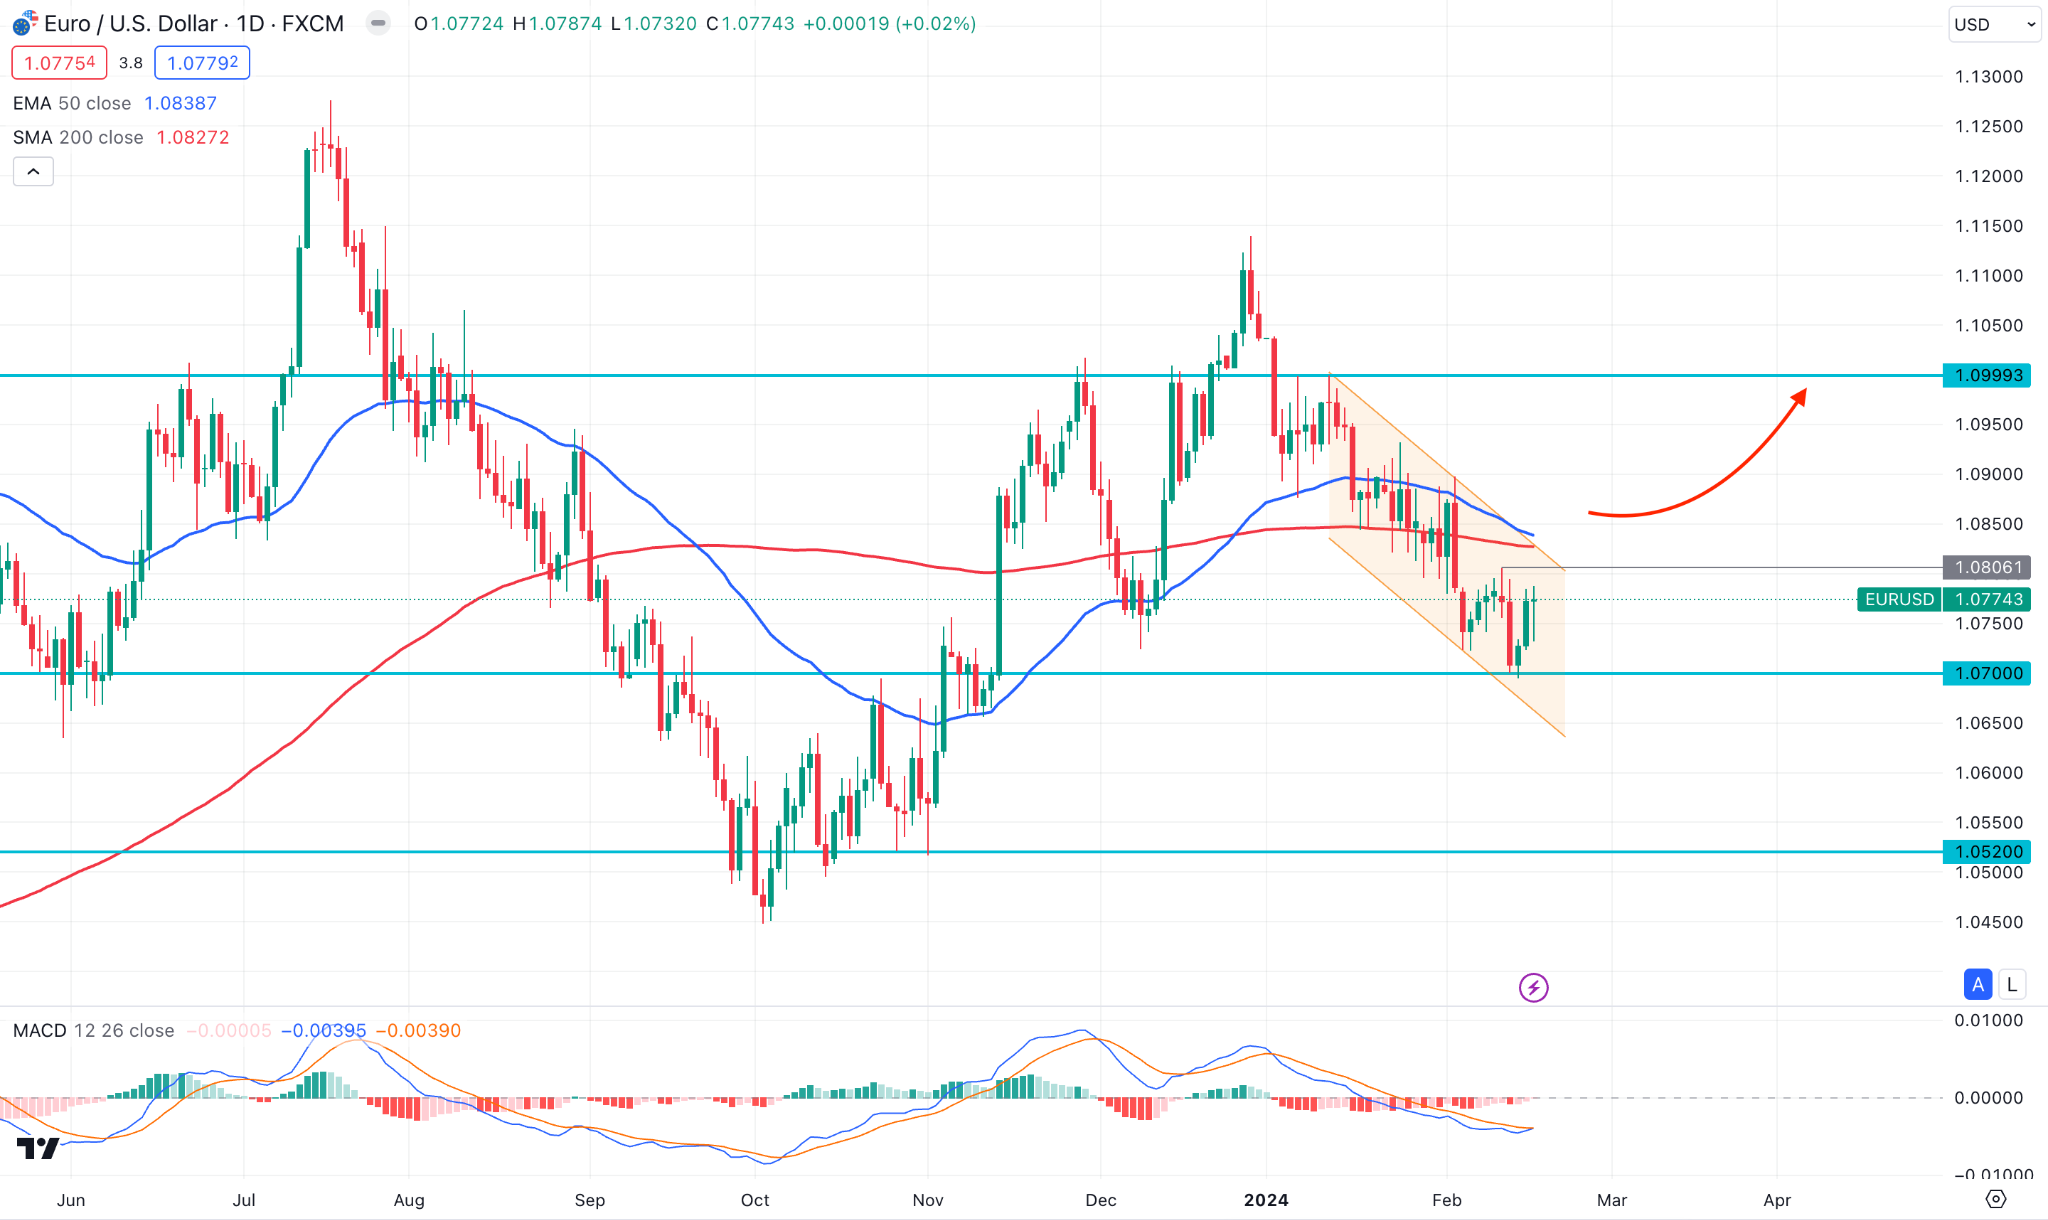
EURUSD bounced back from the 1.0700 key level psychological level last Friday. The valid bullish rejection from the crucial point could open room for reaching the 1.0800 resistance level.
Beyond the current structure, the 200-day SMA is at the 1.0825 level, which could work as a strong barrier to bulls before the 50-day EMA at the 1.0840 level. On the bullish side, valid buying pressure above these lines could increase the price to the 1.0990 level in the coming days.
On the bearish side, sellers' recovery with a valid daily candle below the 1.0700 mark could provide a stable downside possibility. A stable market below this line could extend the downside possibility towards the 1.0650 level before reaching the 1.0520 level.
GBPJPY
The GBPJPY pair surged higher on Tuesday after disclosing the UK labor market report. Based on data provided by the Office for National Statistics (ONS), employment rose by 72,000 in the concluding quarter of 2023, with a 3.8% decrease in unemployment.
In contrast to market expectations of a 4.2% increase, the annual CPI inflation rate in the United Kingdom remained unchanged at 4.0% in January. The reported month's year-on-year core CPI was 5.1%, marginally below expectations of 5.2%.
For the JPY, Bank of Japan (BoJ) Governor Kazuo Ueda's dovish remarks on Friday exerted pressure on the Japanese Yen (JPY). According to Ueda, monetary conditions in Japan are expected to remain accommodating, given the prevailing economic and price conditions.
Gross Domestic Product (GDP) figures that were abysmal on Thursday confirmed Japan's technical recession. This development supports the notion that the Bank of Japan (BoJ) could postpone the end of its negative interest rate policy, which would cause investors to divest from the safe-haven Japanese Yen.
Significant macro data releases are absent in the first half of the week, leaving Pound Sterling traders in anticipation of Thursday's PMI data. Furthermore, Megan Greene, a member of the Monetary Policy Committee (MPC) of the Bank of England, is slated to deliver a speech on Thursday.
Technical Perspective
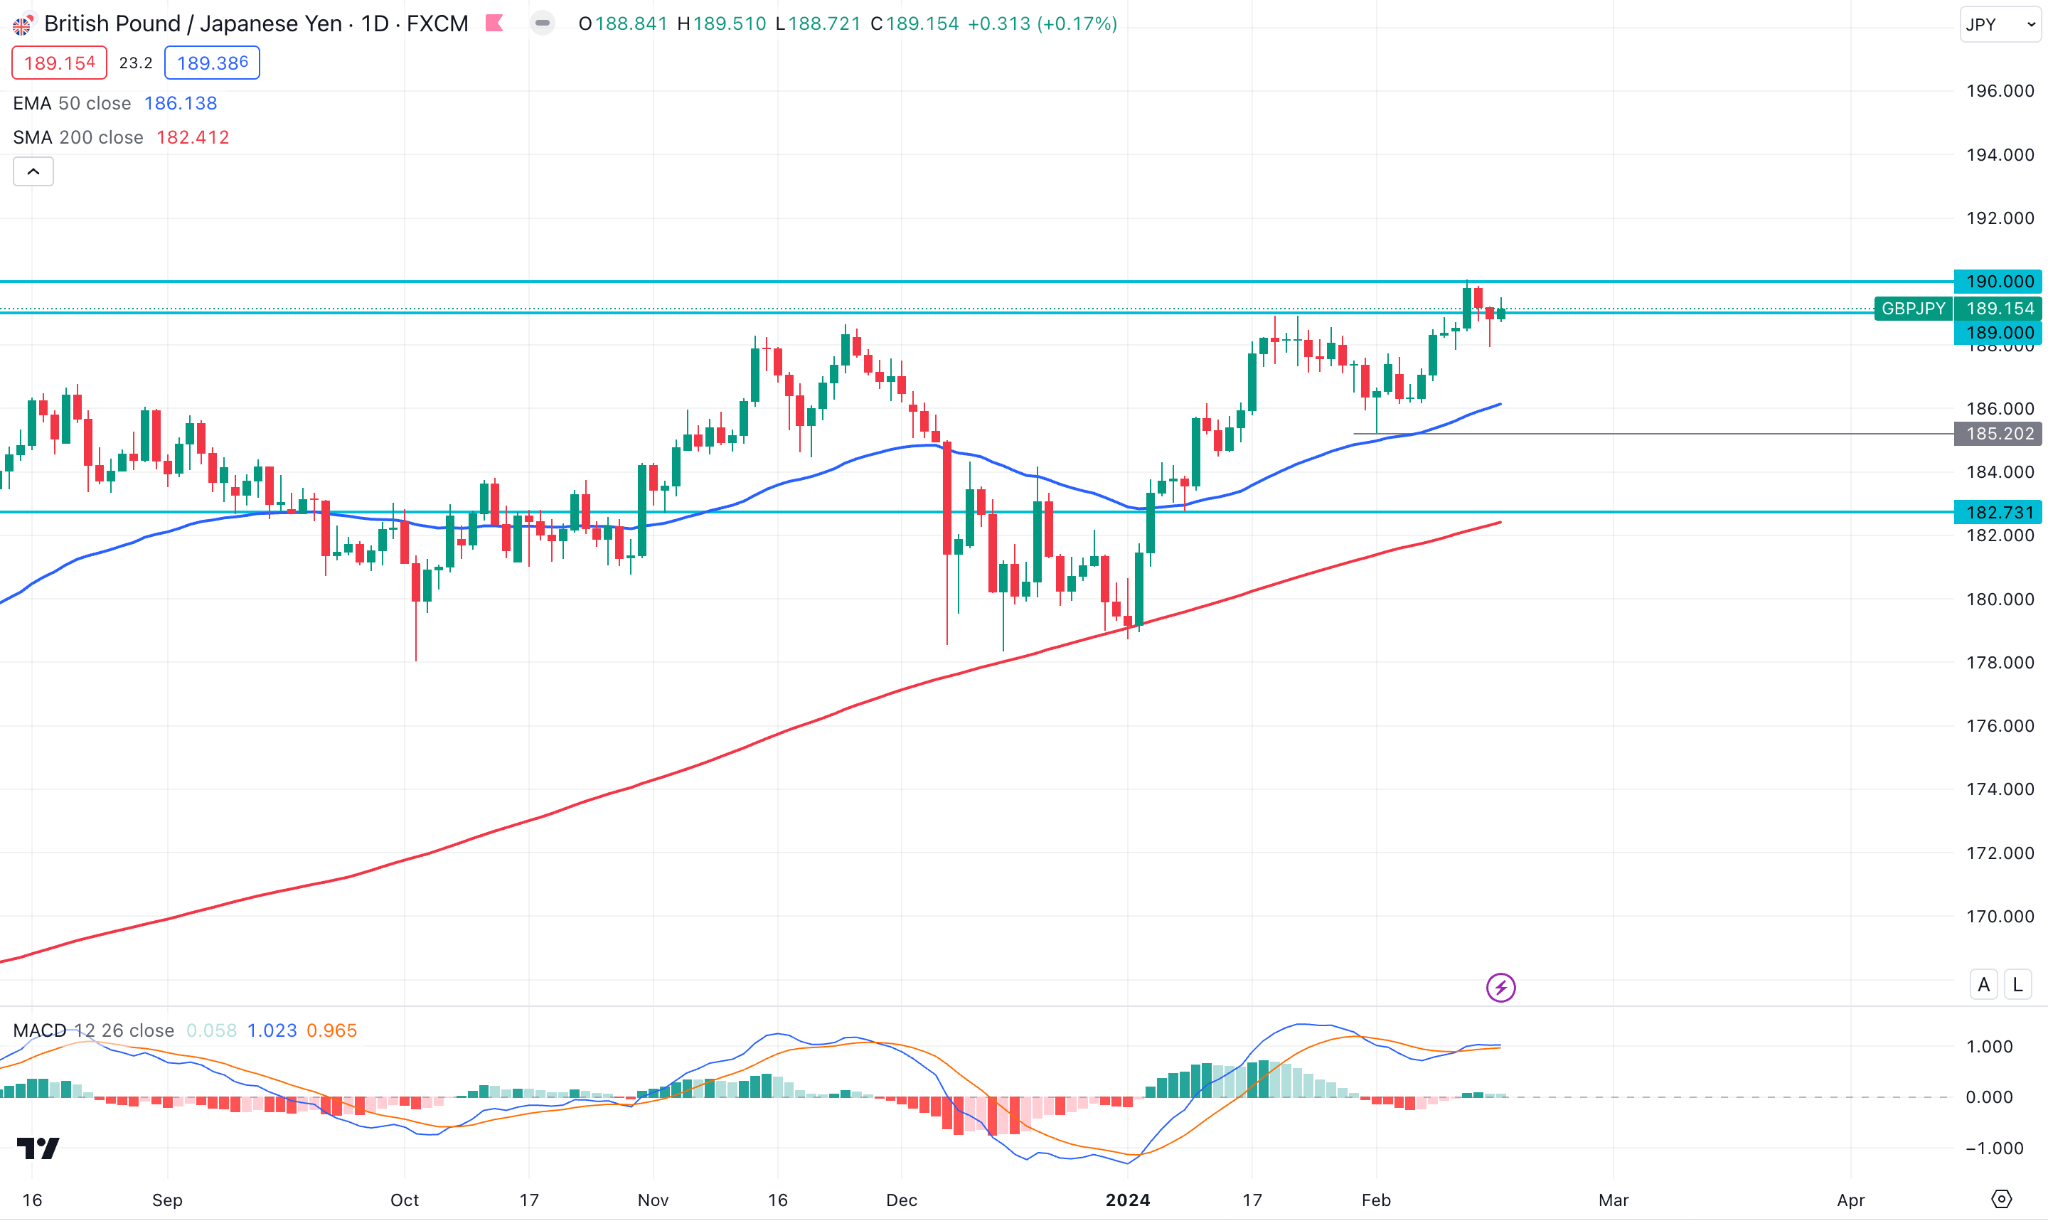
GBPJPY showed a bullish rally on Tuesday, reaching a level not seen since August 2015. However, an immediate selling pressure was seen, sliding the price towards the 189.00 psychological number.
For this week, investors should closely monitor how the price trades on the 189.00 level. A valid bullish recovery with a daily candle above the 190.00 level could be a valid long opportunity for this week. In that case, the upward pressure could extend toward the 196.00 level, which was 2015 high.
On the bearish side, a bearish acceleration below this line with a daily candle below the 189.00 level could open room for reaching the 185.50 support level.
Nasdaq 100 (NAS100)
Fundamental Perspective
Friday marked the end of a five-week winning stretch for the Nasdaq 100, propelled by two inflation reports that exceeded expectations and sparked the possibility of a rate cut.
On the data front, the annual inflation rate amounted to 3.1%, surpassing the expected 2.9%. Furthermore, core inflation, excluding energy and food items, exceeded expectations by 3.9% instead of the 3.7% anticipation.
The difficulty of reaching the Federal Reserve's target rate of 2% was further exacerbated on Friday after the 0.3% monthly increase in the Producer Price Index. This resulted in a recovery from the 0.1% decline observed in December, exceeding the expected 0.1% rise.
Traders modified their anticipations concerning Federal Reserve policy, resulting in a decrease in speculation surrounding cumulative rate cuts for 2024 from 120 to 95 basis points. This effectively eradicated the possibility of a 25-basis-point rate cut.
Among upcoming earnings reports, some crucial releases are HSBC Holdings plc (HSBC), Walmart Inc. (WMT), NVIDIA Corporation (NVDA), Intuit Inc. (INTU), and Berkshire Hathaway Inc (BRK.B).
Technical Perspective
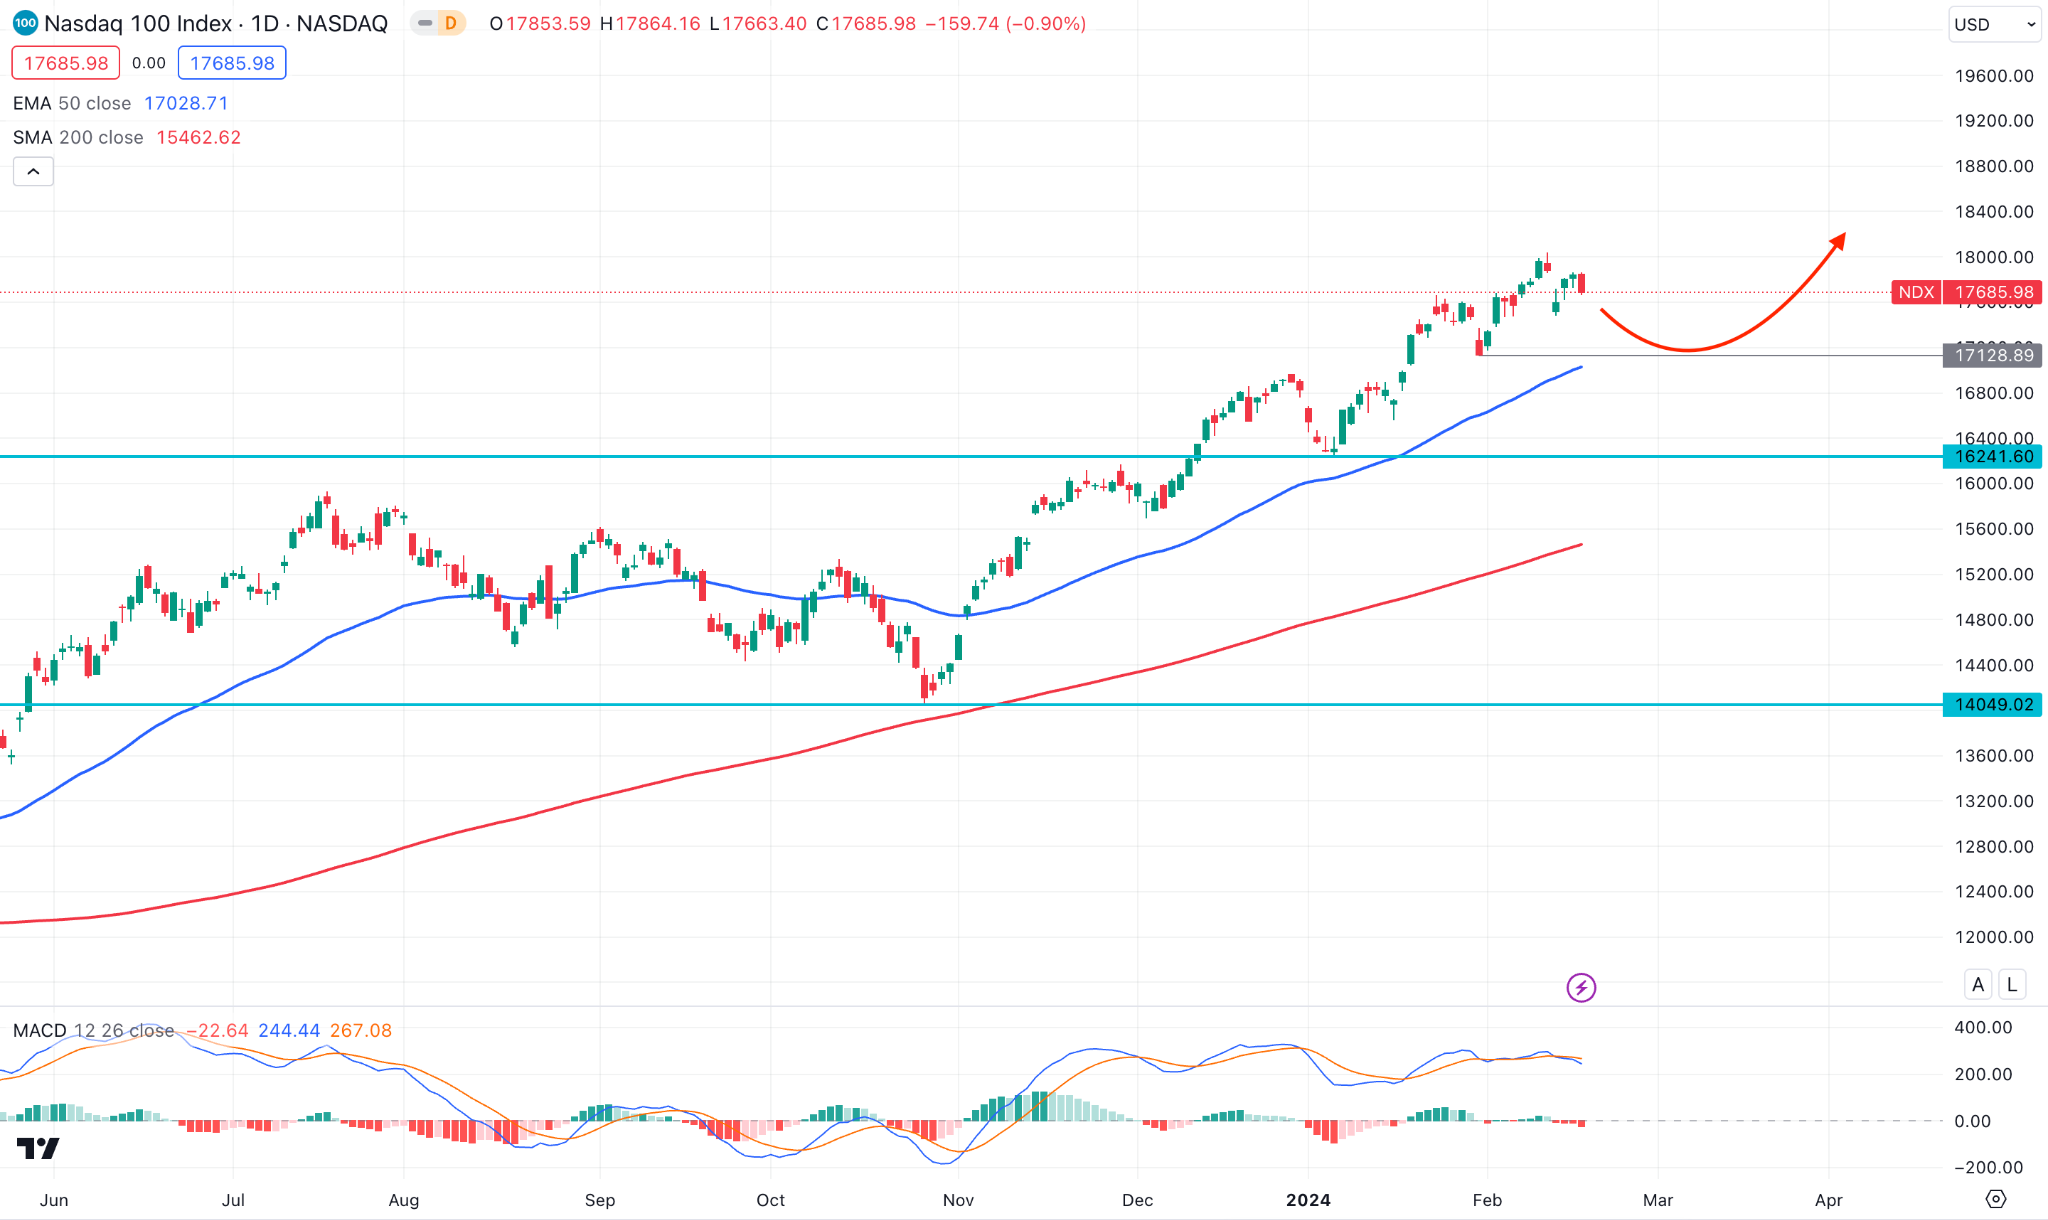
In the weekly chart, a bearish weekly candle showed a downside possibility, but it closed as an insider bar. In that case, a valid daily candle below the 17280.28 low could be a long-term bearish opportunity.
The daily chart shows a corrective price action where the near-term support level is at 17128.89 level. Moreover, the MACD Signal line hovers at the overbought area with a divergence formation.
In that case, a high probable short opportunity might come after having a daily close below the 17128.89 level, which could lower the price toward the 16241.60 support level.
S&P500 (SPX500)
Fundamental Perspective
The benchmark S&P 500 Index reached an all-time high the previous week, signifying an additional significant achievement. Nonetheless, this initial ascent transpired in the early hours of the week after the decline in technology equities.
Despite the CME's FedWatch tool, the Federal Reserve showed less possibility of the rate cut in March, which surged the stock market. At present, the markets have reduced the perceived probability of a rate cut in March from 36% the week prior to March to 10%.
The CPI (inflation) data, which revealed that inflation is not declining at the rate anticipated, were crucial. Consequently, the US Dollar strengthened, leading to a decline in US equities.
In addition, the PPI data stood out, indicating persistent inflationary pressures by surpassing expectations with a 0.3% monthly increase when only a 0.1% increase was predicted.
Technical Perspective
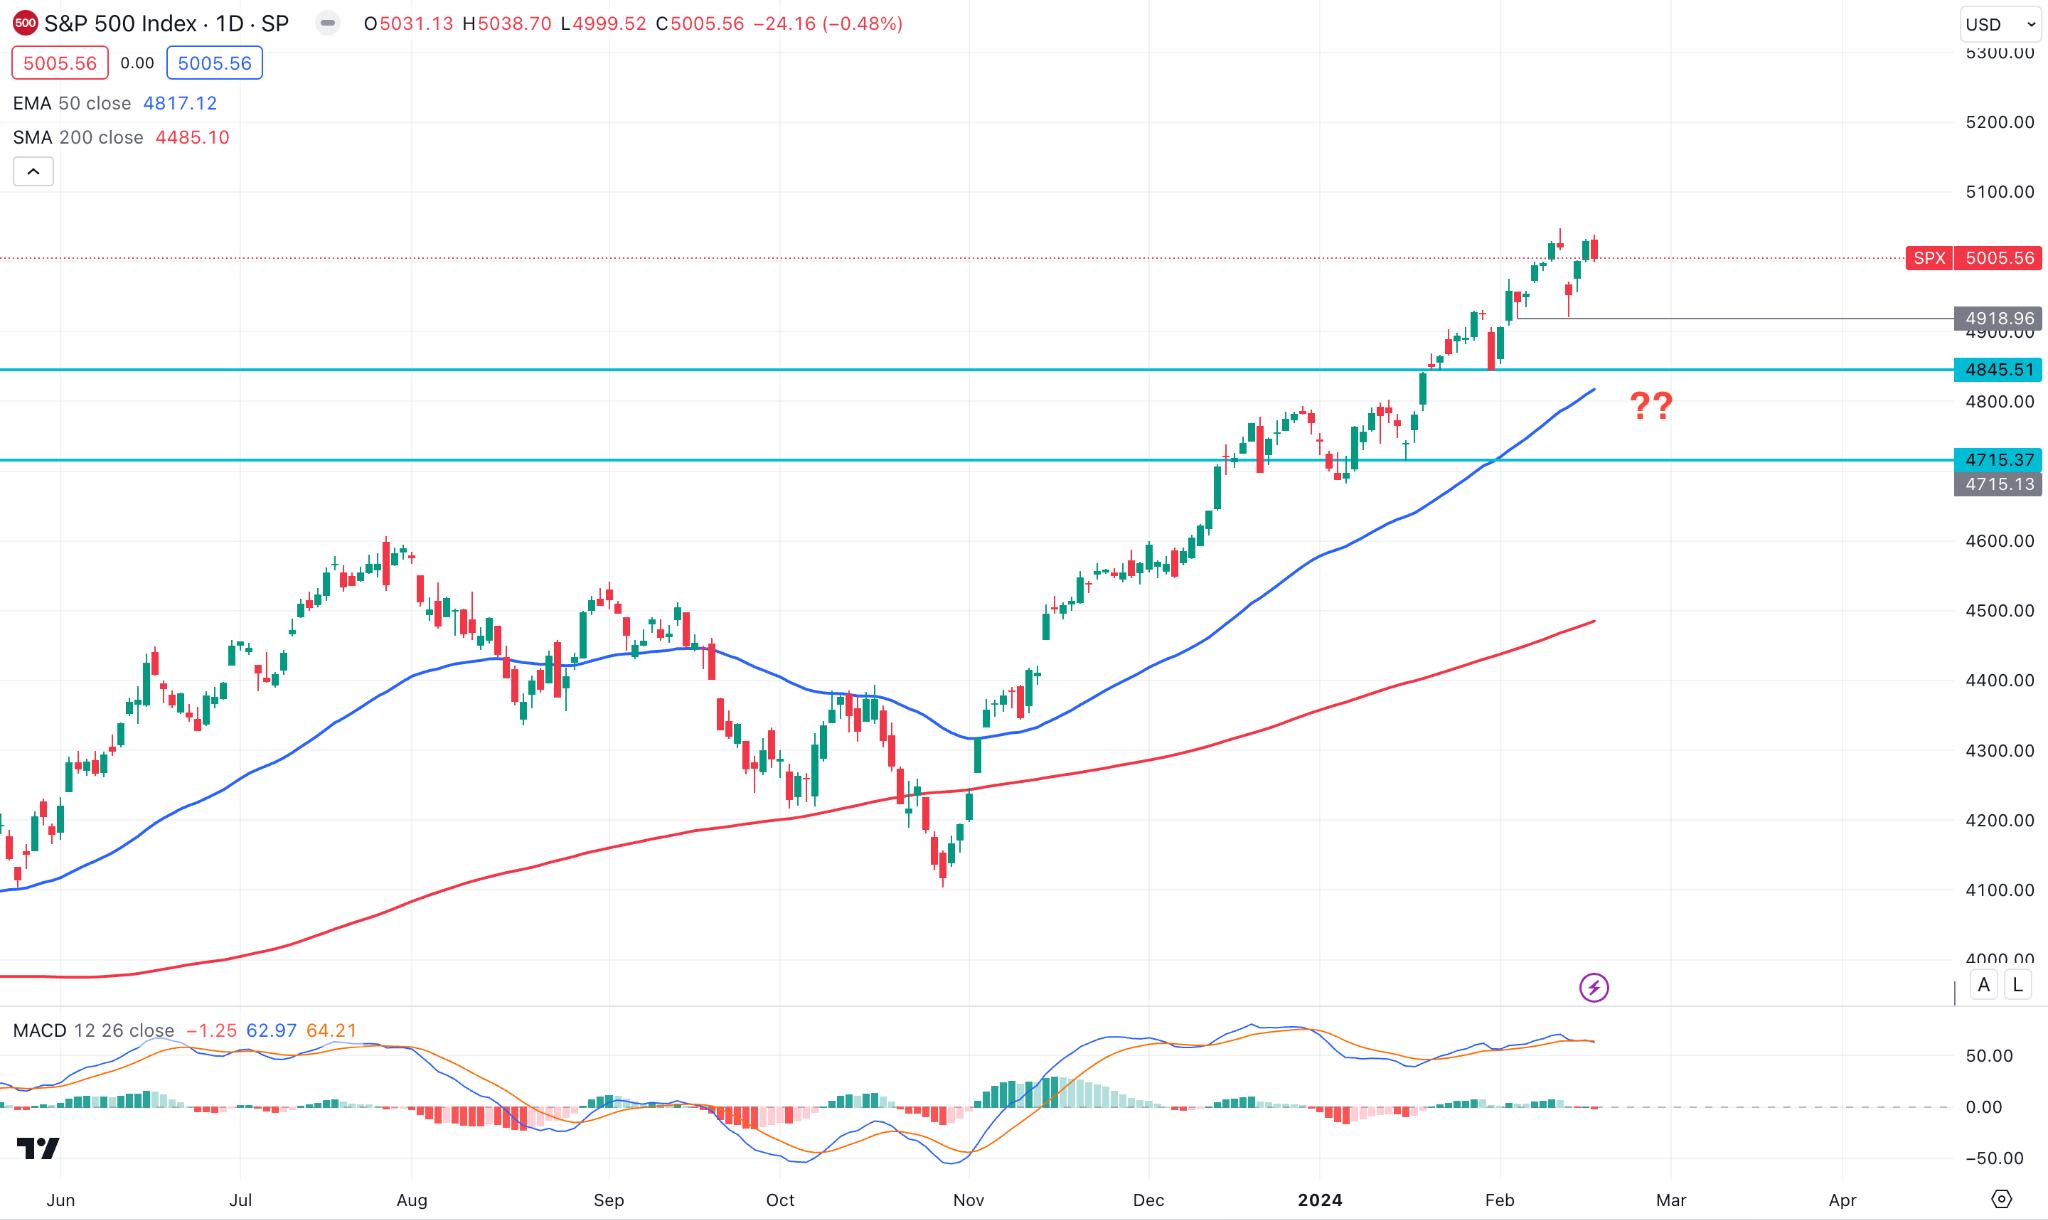
In the daily chart, the S&P 500 trades within a bullish trend continuation, whereas the 50-day EMA and 200-day SMA show an upward continuation possibility. However, a divergence is formed with the MACD Signal lines.
In that case, an upward continuation might come after having a bullish recovery from the 50-day Exponential Moving Average. On the bearish side, a daily close below the 4845.51 static level could be a bearish possibility, targeting the 4700.00 area.
Hang Seng Index (HK50)
Fundamental Perspective
On Friday, customs officials apprehended seven Hong Kong residents about a money laundering case worth HK$14 billion associated with a transnational organization of significant scope.
The director of Hong Kong's Customs Financial Investigation Bureau, Ip Tung-ching, revealed that many of the detained individuals were not of Chinese nationality.
The syndicate allegedly utilized a network of shell corporations and bank accounts in Hong Kong to transfer substantial quantities of money into bank accounts. Notably, the news agency reported that approximately HK$2.9 billion of the laundered funds were associated with a mobile application fraud case in India.
Analysts have noted that several companies, including XPeng (XPEV), Prada (1913), and JD Logistics (2618), are probable contenders for inclusion in the Hong Kong 50 Index as they strive to achieve the milestone of 100 members.
Technical Perspective
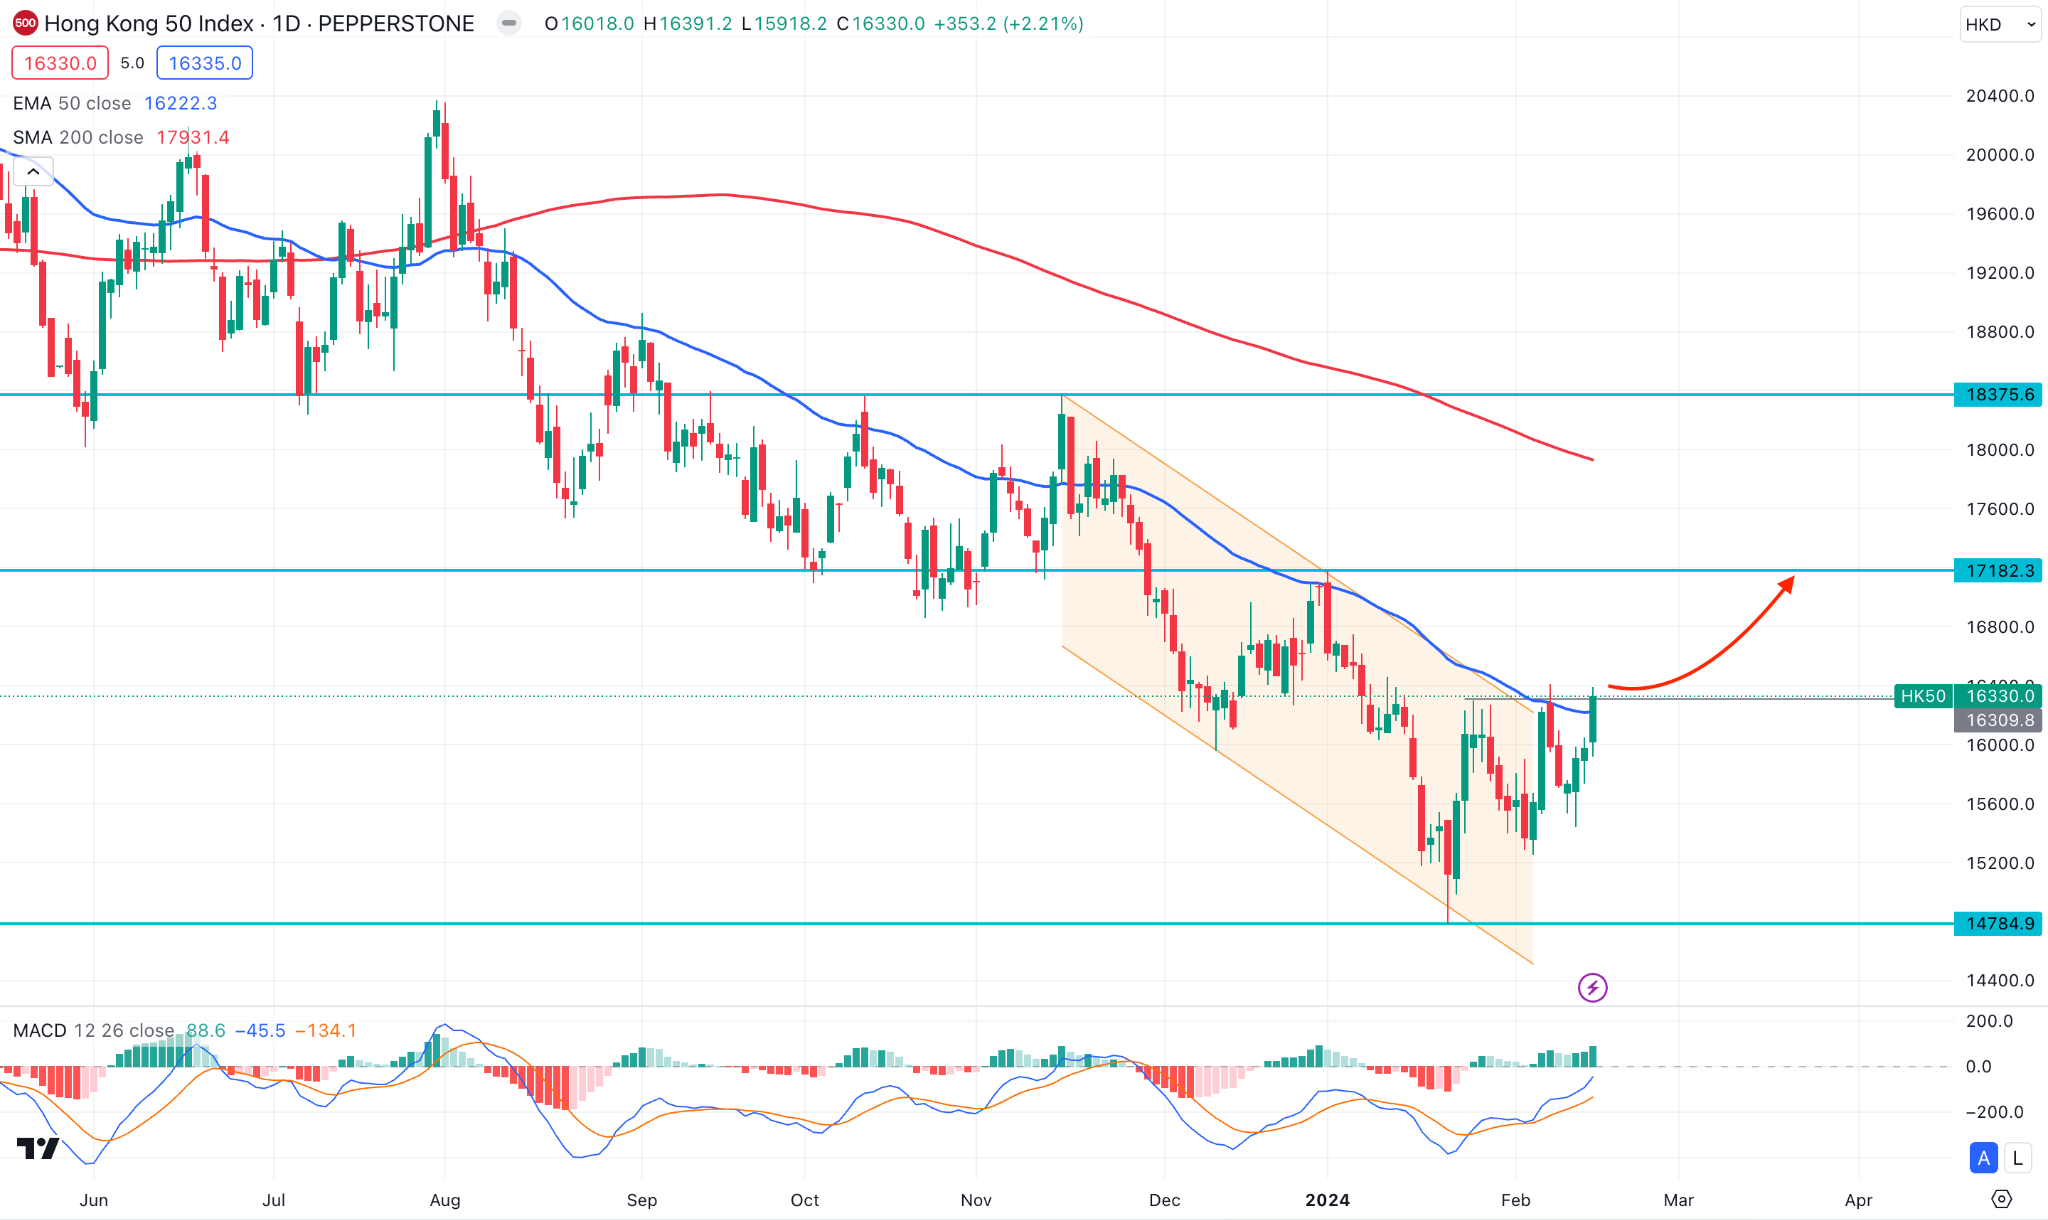
The HK 50 weekly candle shows a bullish reversal after having a bearish inside bar. In that case, an upward continuation is potent as the recent candle closed bullish, above last week’s high.
In the daily chart, the current candle trades above the 50-day EMA, while the 200-day SMA is way above the current price. In that case, the primary intention of this instrument is to test the 17182.30 resistance level before forming a downside possibility.
However, an immediate bearish reversal below the current dynamic line might resume the current bearish possibility, targeting the 1478.60 support level.
Bitcoin (BTCUSD)
Fundamental Perspective
According to the on-chain data from Santiment, whale activity has reached its highest level in twenty months. Significant inflows into Bitcoin's ETF have not influenced the behavior of large wallet investors, which signifies a notable shift in the Bitcoin supply held by various groups of whales.
Whales of Bitcoin who held between 1,000 and 10,000 BTC in their accounts amassed an asset value of $12.95 billion in 2024. On the contrary, the cohort comprising investors with 100 to 1,000 BTC inventories decreased their holdings by $7.89 billion.
As Bitcoin has surpassed $52,000 in value over the past five days, Santiment has detected an increase in whale transactions with a maximum value of $100,000. The current level of this metric is the highest since June 2022. The trends above indicate that market participants have been captivated by the recent price fluctuations of Bitcoin this week.
Technical Perspective
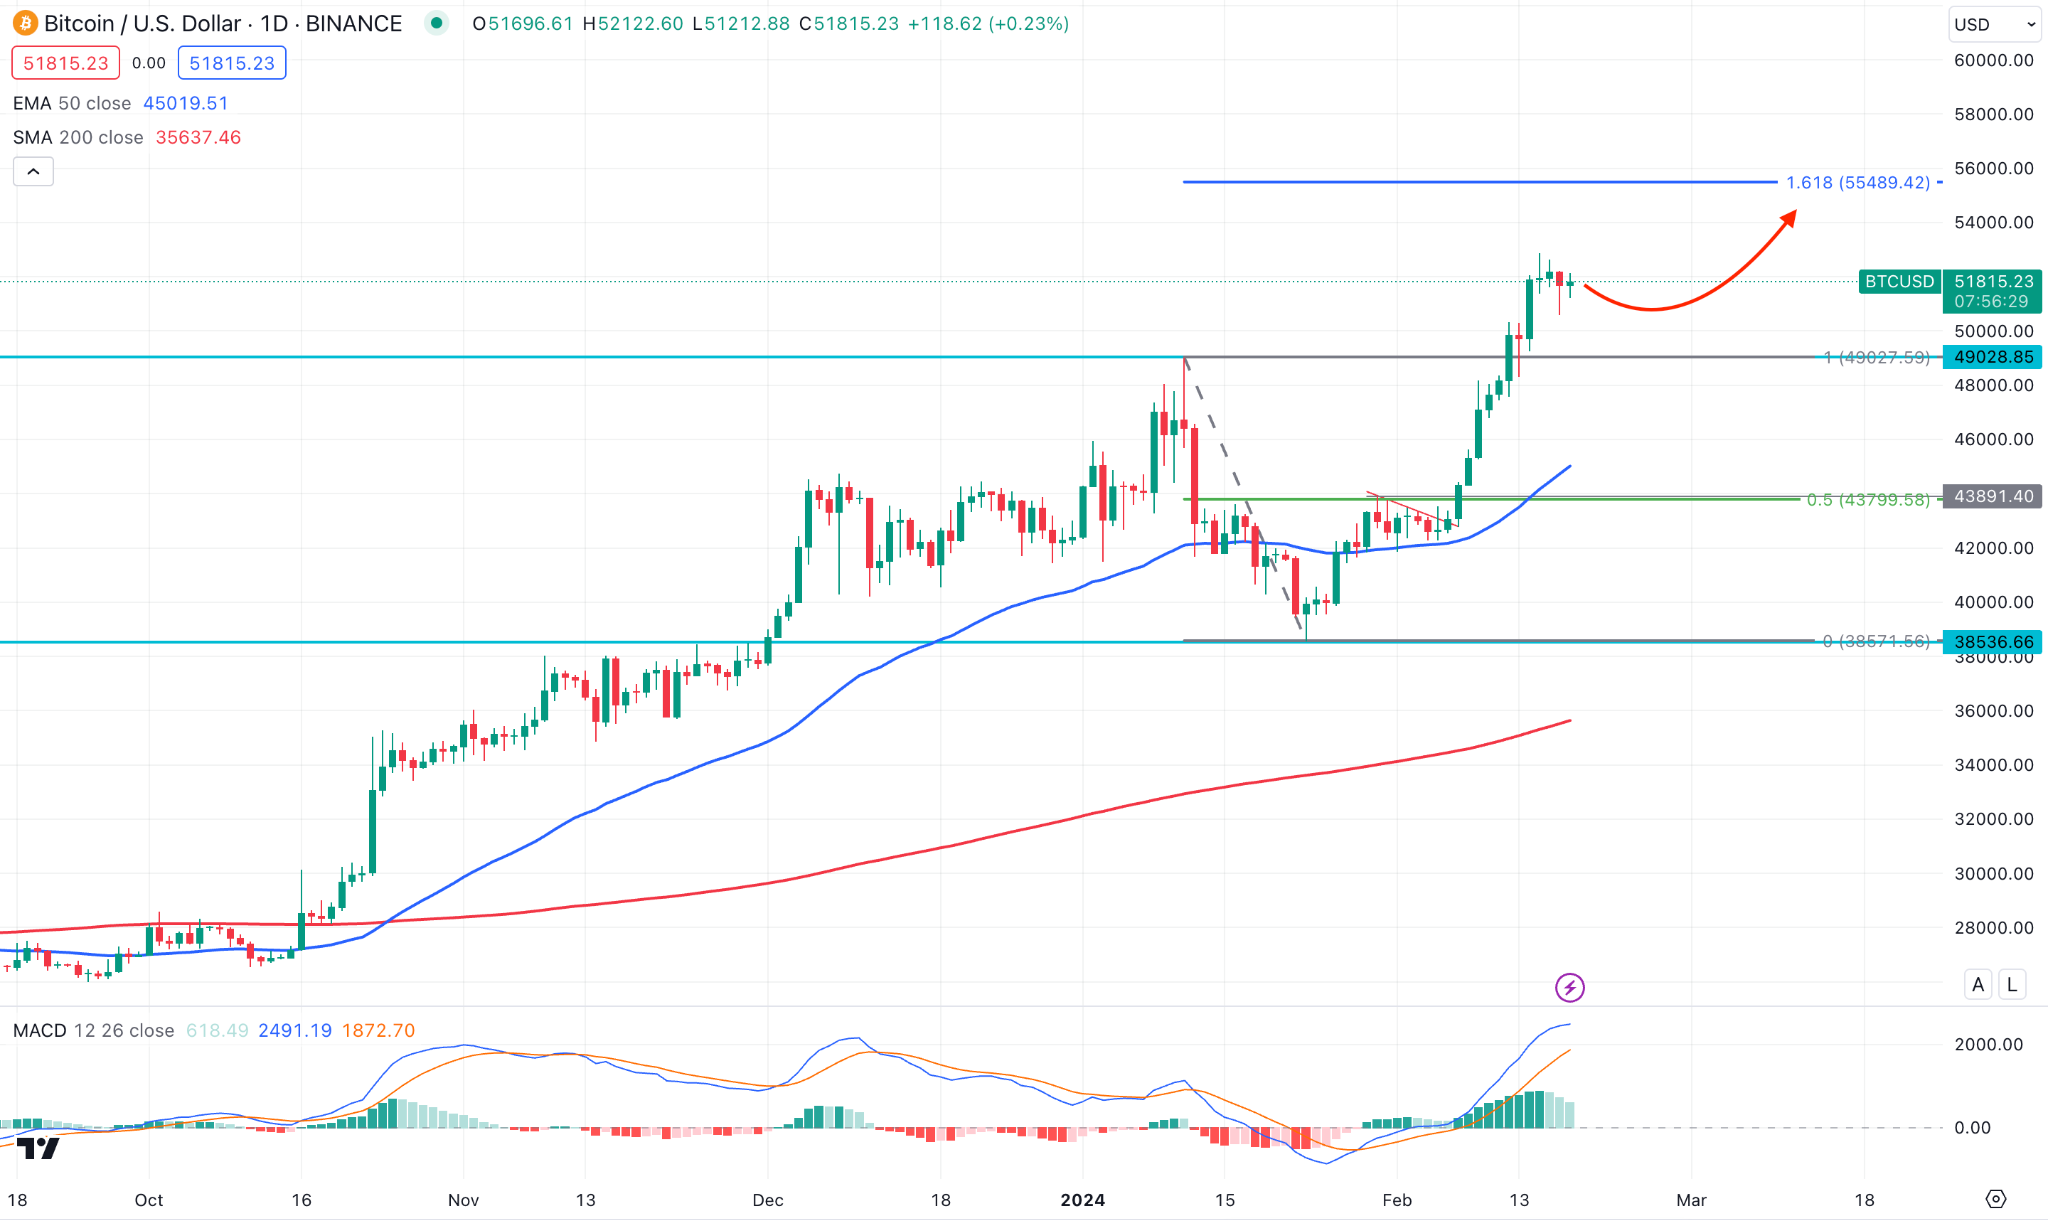
Bitcoin (BTC) trades within a bullish trend, while the recent price hovers above the 49,028.80 critical zone. Moreover, the dynamic 50-day EMA is below the current price with a bullish slope, working as a confluence bullish factor.
Based on this outlook, the upward continuation is potent as long as it stays above the 49,000.00 level, where the main aim is to test the 55,489.90 Fibonacci Extension level. On the bearish side, a valid selling pressure below the 49,000.00 level could extend the bearish continuation toward the 43,891.41 level.
Ethereum (ETHUSD)
Fundamental Perspective
Last week, applications for the Ethereum exchange-traded fund (ETF) were submitted by prominent financial institutions such as Franklin Templeton, BlackRock, Fidelity, Ark and 21Shares, Grayscale, VanEck, Invesco and Galaxy, and Hashdex.
Since mid-January, when spot bitcoin (BTC) ETFs were introduced, these companies have offered them. These funds have accumulated $11 billion worth of Bitcoin since their inception, thereby contributing to the increase in the value of the leading cryptocurrency beyond $52,000.
According to market observers, the demand for ETH may be stimulated by a similar trend. Another advantage is that regulated ether products may provide 5% annual rewards via token staking, a characteristic absent from Bitcoin. Preparations are already underway to introduce such products in specific regions of Europe.
Technical Perspective
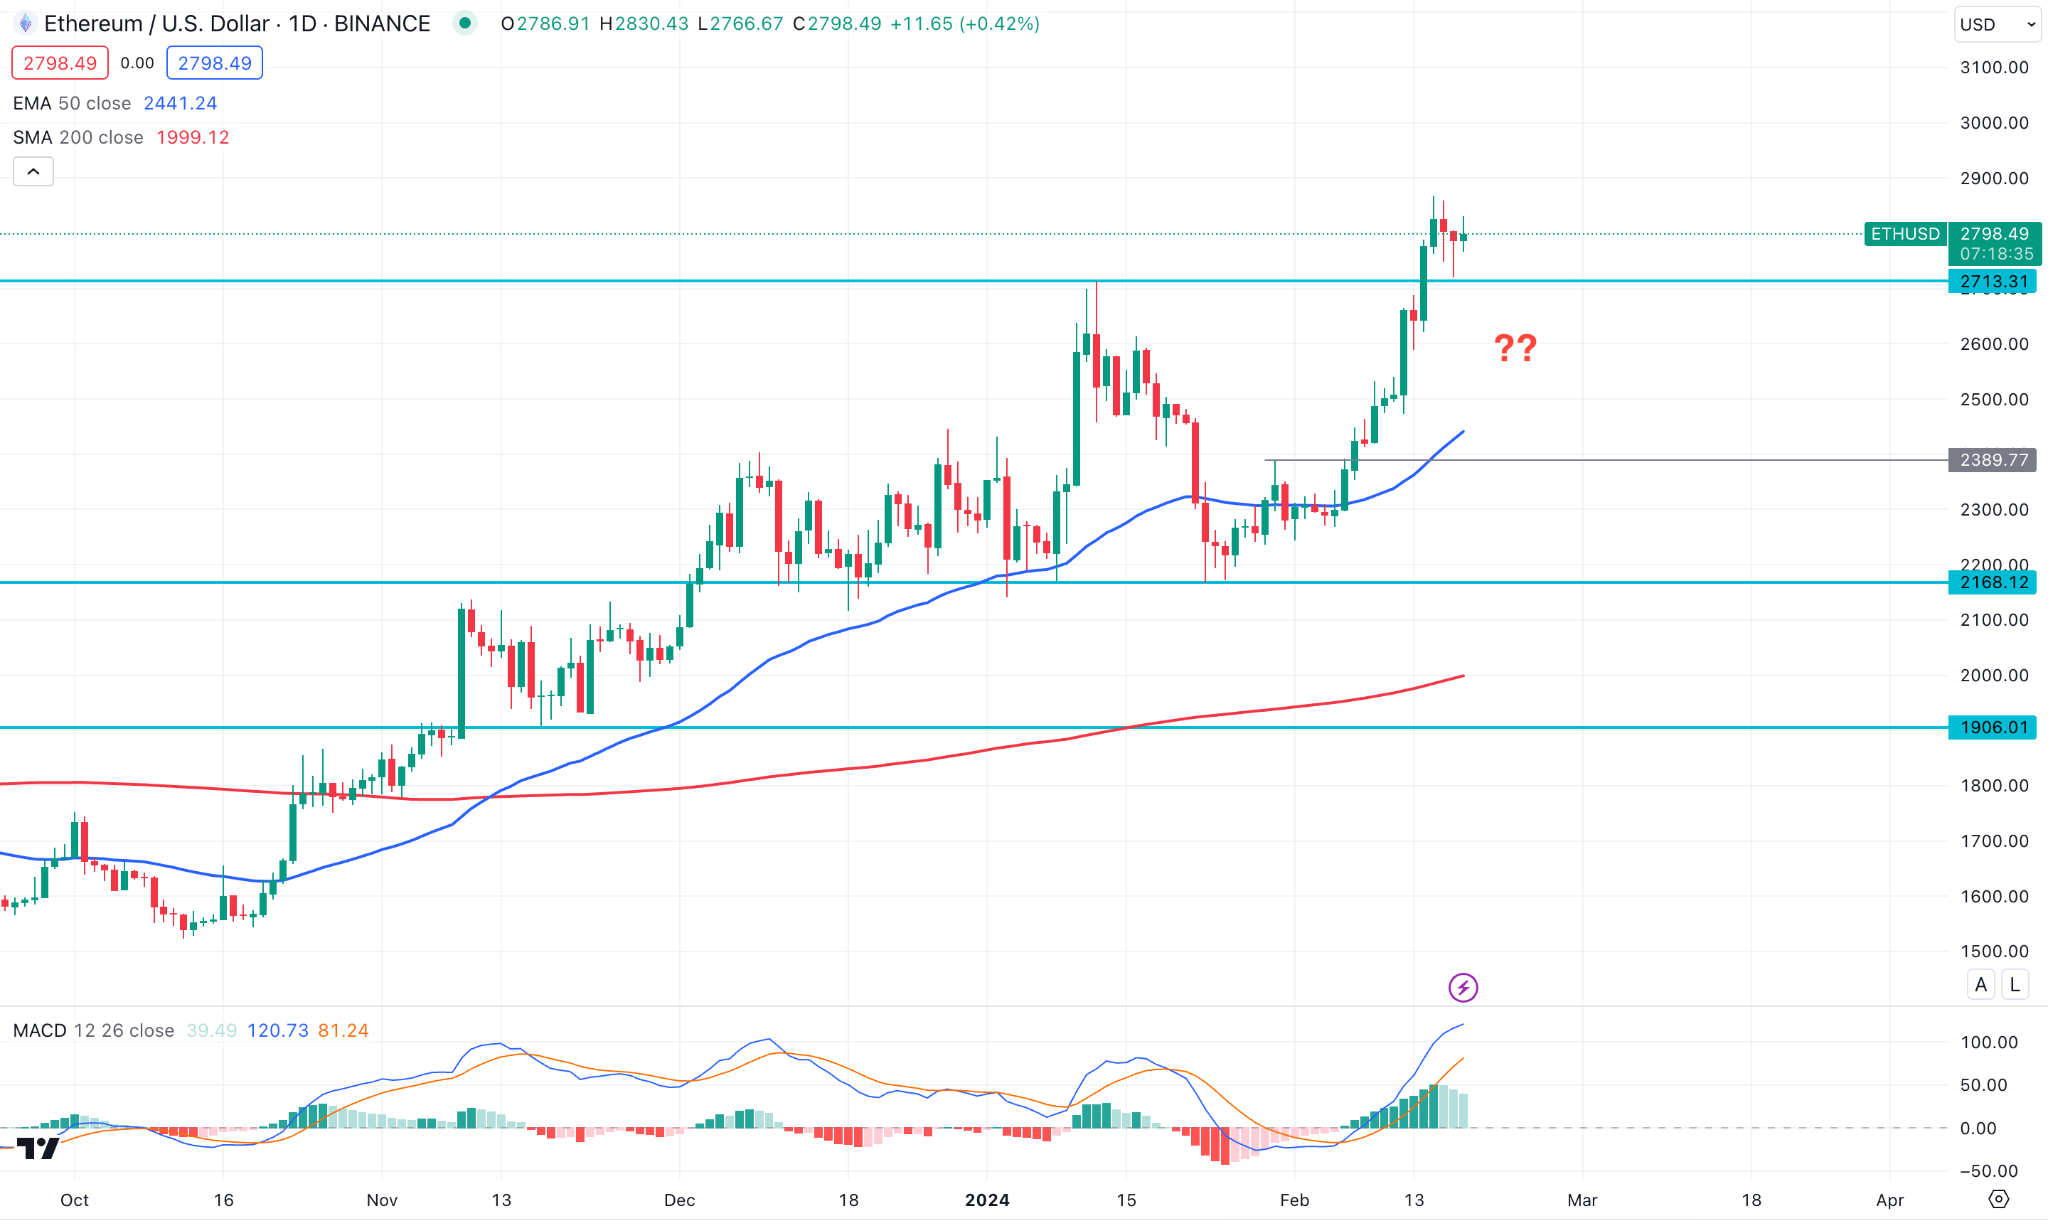
Before the latest bull run, Ethereum (ETH) showed a consolidation for 11 trading days. Finally, bulls regained the momentum and took the price 9% higher after getting a valid rejection from the 2539.00 level.
In the technical indicator, the MACD Histogram shows a bullish Histogram, indicating buyers’ presence in the market. Moreover, 50 and 100-day Moving Averages remain bullish, below the current price, which could work as a bullish factor for this pair.
On the bearish side, investors should closely monitor how the price trades in the near-term zone. A valid daily candle below the 2700.00 level could be a bearish opportunity, targeting the 2389.11 level.
Tesla Stock (TSLA)
Fundamental Perspective
Tesla stock achieved its second consecutive day of growth, with fluctuations in the Treasury market. The upward pressure came from the impact of the most recent disclosures regarding the remuneration and benefits of Chief Executive Elon Musk.
The electric vehicle manufacturers' stock price increased by 4.2% last week, reaching nearly the 200.00 psychological level.
Investing sentiment has been preoccupied with events surrounding the January judgment by a Delaware court that vacated the $56 billion compensation package of CEO Elon Musk in response to a shareholder challenge.
Furthermore, on Wednesday, Tesla submitted paperwork to the Securities and Exchange Commission that revealed Elon Musk's ownership stake in Tesla stock. According to the filings, he retains authority over slightly more than 20% of the organization. The level of ownership has remained constant over the past year, indicating that the Delaware decision has not had any effect on the CEO's holdings.
Despite media reports indicating that Musk's stake in Tesla has exceeded 20%, Gary Black, a Tesla shareholder and Future Fund Active ETF co-founder refuted these assertions as a substantial determinant in the volatility observed on Thursday.
Technical Perspective
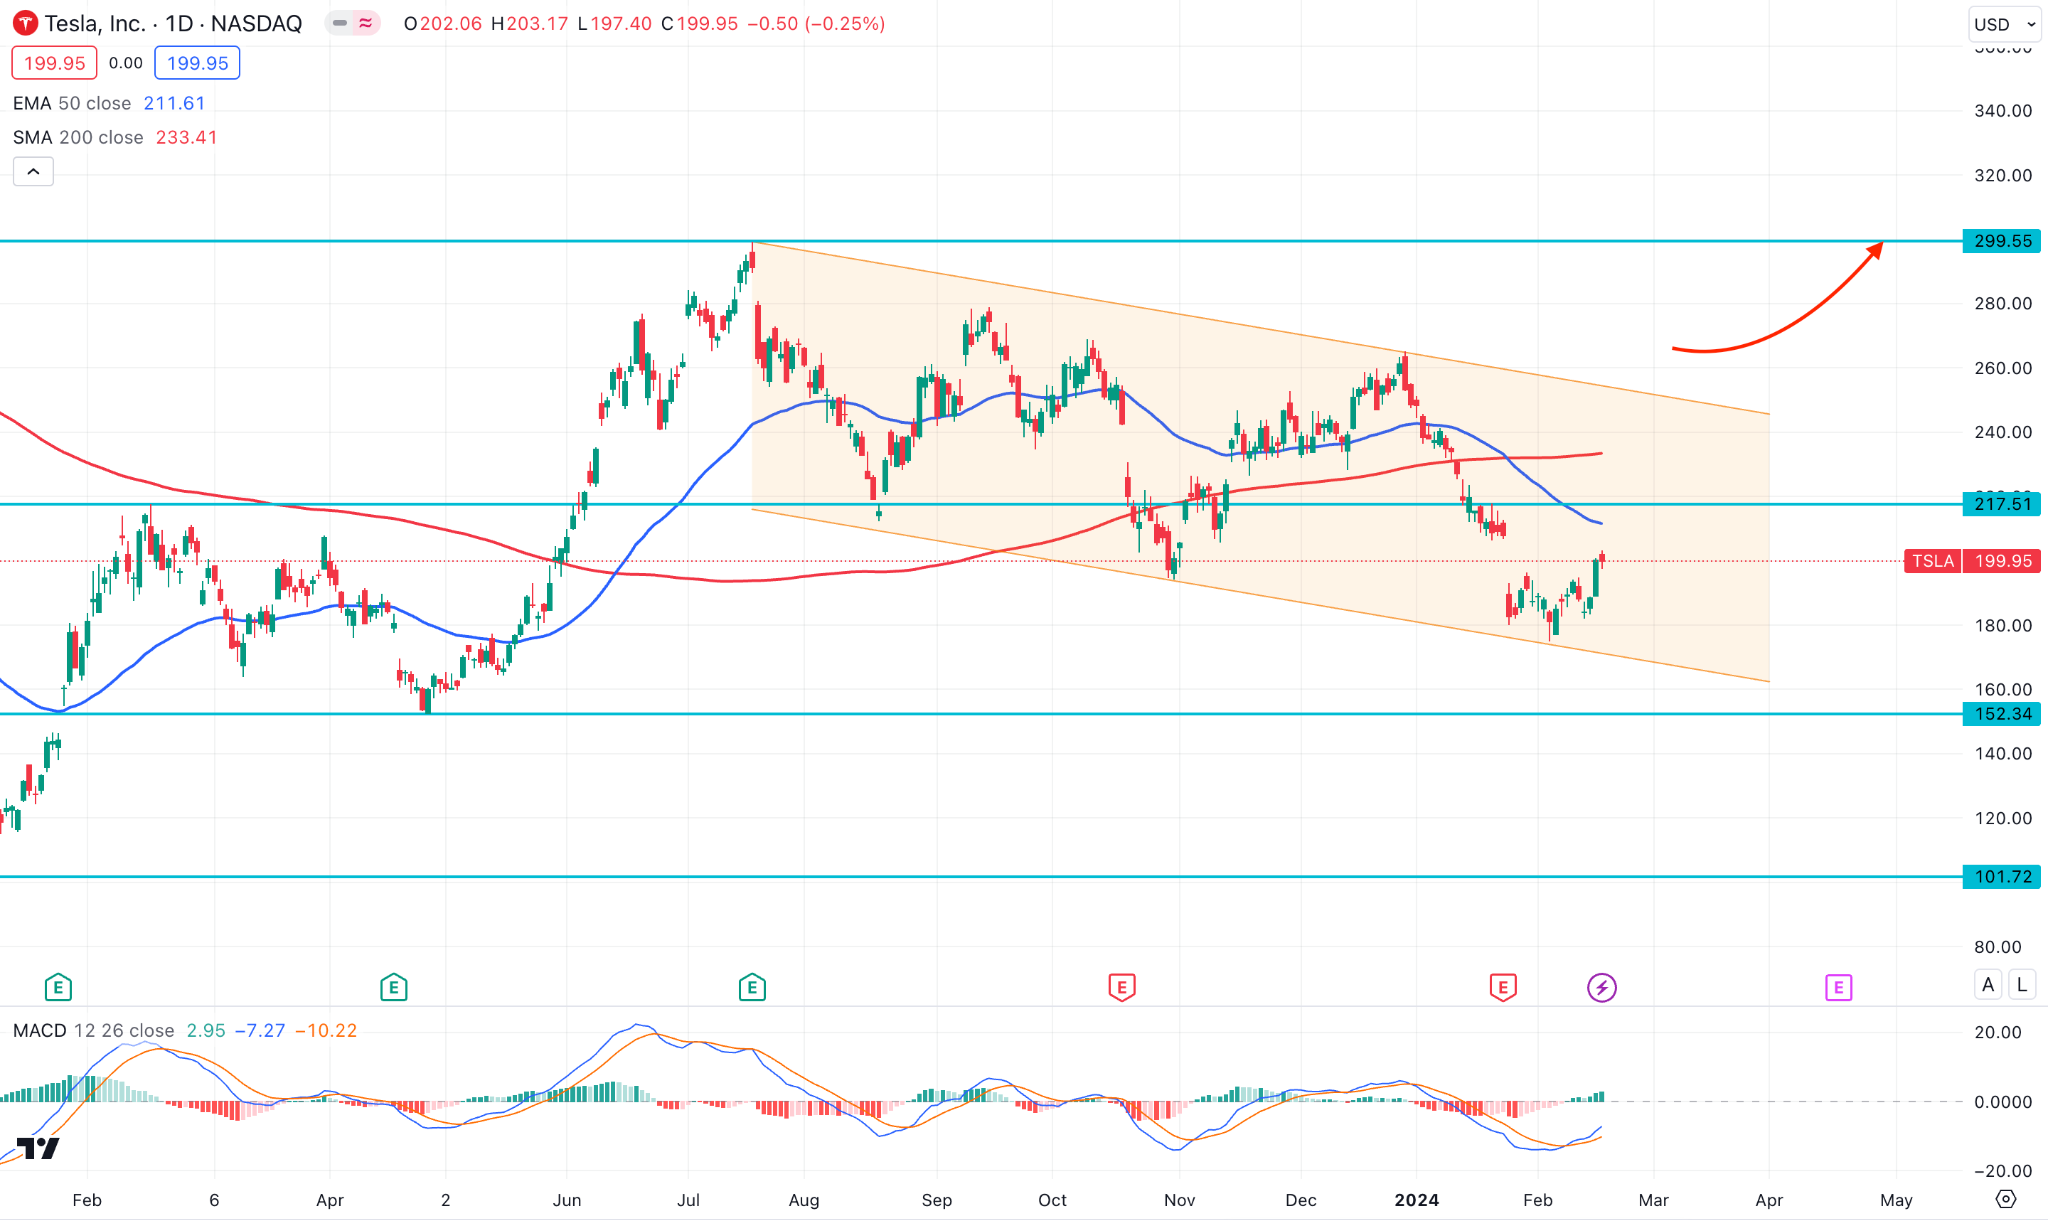
In the daily TSLA stock price chart, the MACD Histogram remains bearish, while the 50-day EMA is the near-term resistance. In that case, a minor upward correction is pending towards the channel resistance from where the bearish continuation might come.
In the long-term outlook, a valid channel breakout with a stable market above the 269.49 swing high could resume the bullish trend toward the 400.00 area.
Gold (XAUUSD)
Fundamental Perspective
The annual increase in the Consumer Price Index for January was 3.1%, as reported by the US Bureau of Labor Statistics on Tuesday. The US Dollar (USD) Index declined, causing the XAUUSD pair to fluctuate within a narrow range near the 1,990.00 to 2016.00 area.
Retail Sales decreased by 0.8% to $700.3 billion in January, with Retail Sales excluding Autos contracting by 0.6% during the same period, according to data released in the United States on Thursday. As a result of the unfavorable data, the 10-year US yield fell to 4.2% later in the day, allowing XAU/USD to reclaim its previous peak of $2,000.
In anticipation of forthcoming PMI data, gold prices might be influenced by the FOMC minutes of its policy meeting. Nevertheless, prospective alterations in Federal Reserve policy, specifically about labor market conditions, continue to captivate the market.
Moreover, the preliminary Manufacturing and Services PMI reports released by S&P Global on Thursday may impact the Gold price. The surveys primarily concentrate on business activity and price pressures, which could be factors to consider.
Technical Perspective
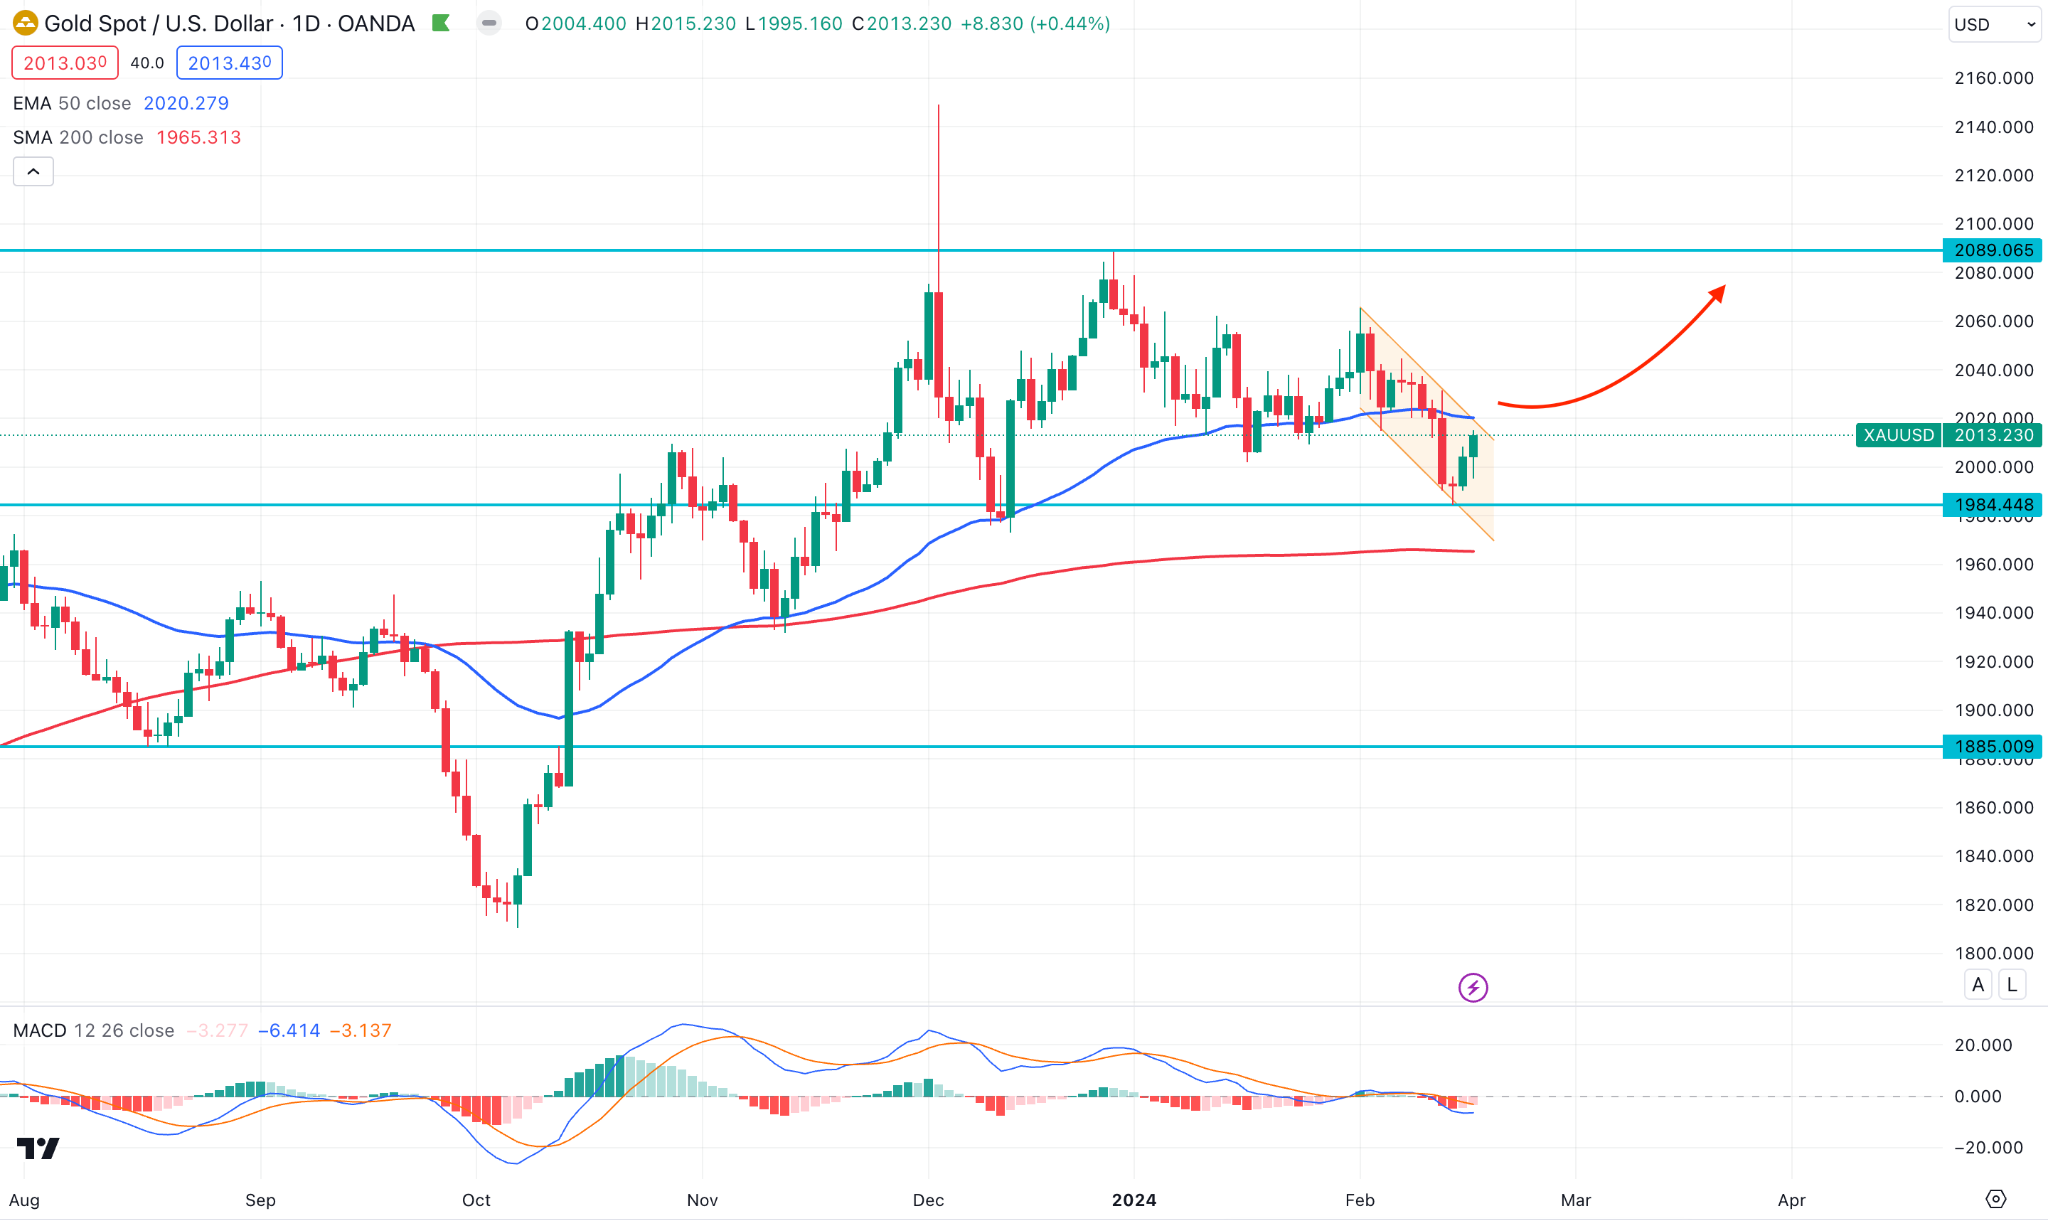
XAUUSD trades sideways within the descending channel, while the dynamic 50-day EMA is the immediate resistance. In that case, a valid bullish channel breakout with a daily close above the 50 DMA could raise the price to the 2064.19 level.
On the bearish side, the 100-day SMA would be crucial support as a valid daily candle below this level could lower the price in the coming days.
WTI Crude Oil (USOUSD)
Fundamental Perspective
Crude oil prices increased moderately on Friday, reaching a two-month high. The ascent is ascribed to heightened geopolitical risks in the Middle East stemming from apprehensions regarding the potential escalation of the Israel-Hamas conflict into Lebanon. The pledge by Hezbollah to escalate its assaults on Israel has played a role in the escalation of crude prices. Moreover, the dollar's depreciation on Friday offered an additional boost to energy prices.
There are concerns that the ongoing Israel-Hamas conflict could potentially escalate to Lebanon, especially in light of the Hezbollah leader's declaration of retaliation against Israel, which targeted non-military locations. Daily exchanges of gunfire have marked the escalation of tensions between Hezbollah and Israel since the Israel-Hamas conflict began on October 7.
Technical Perspective
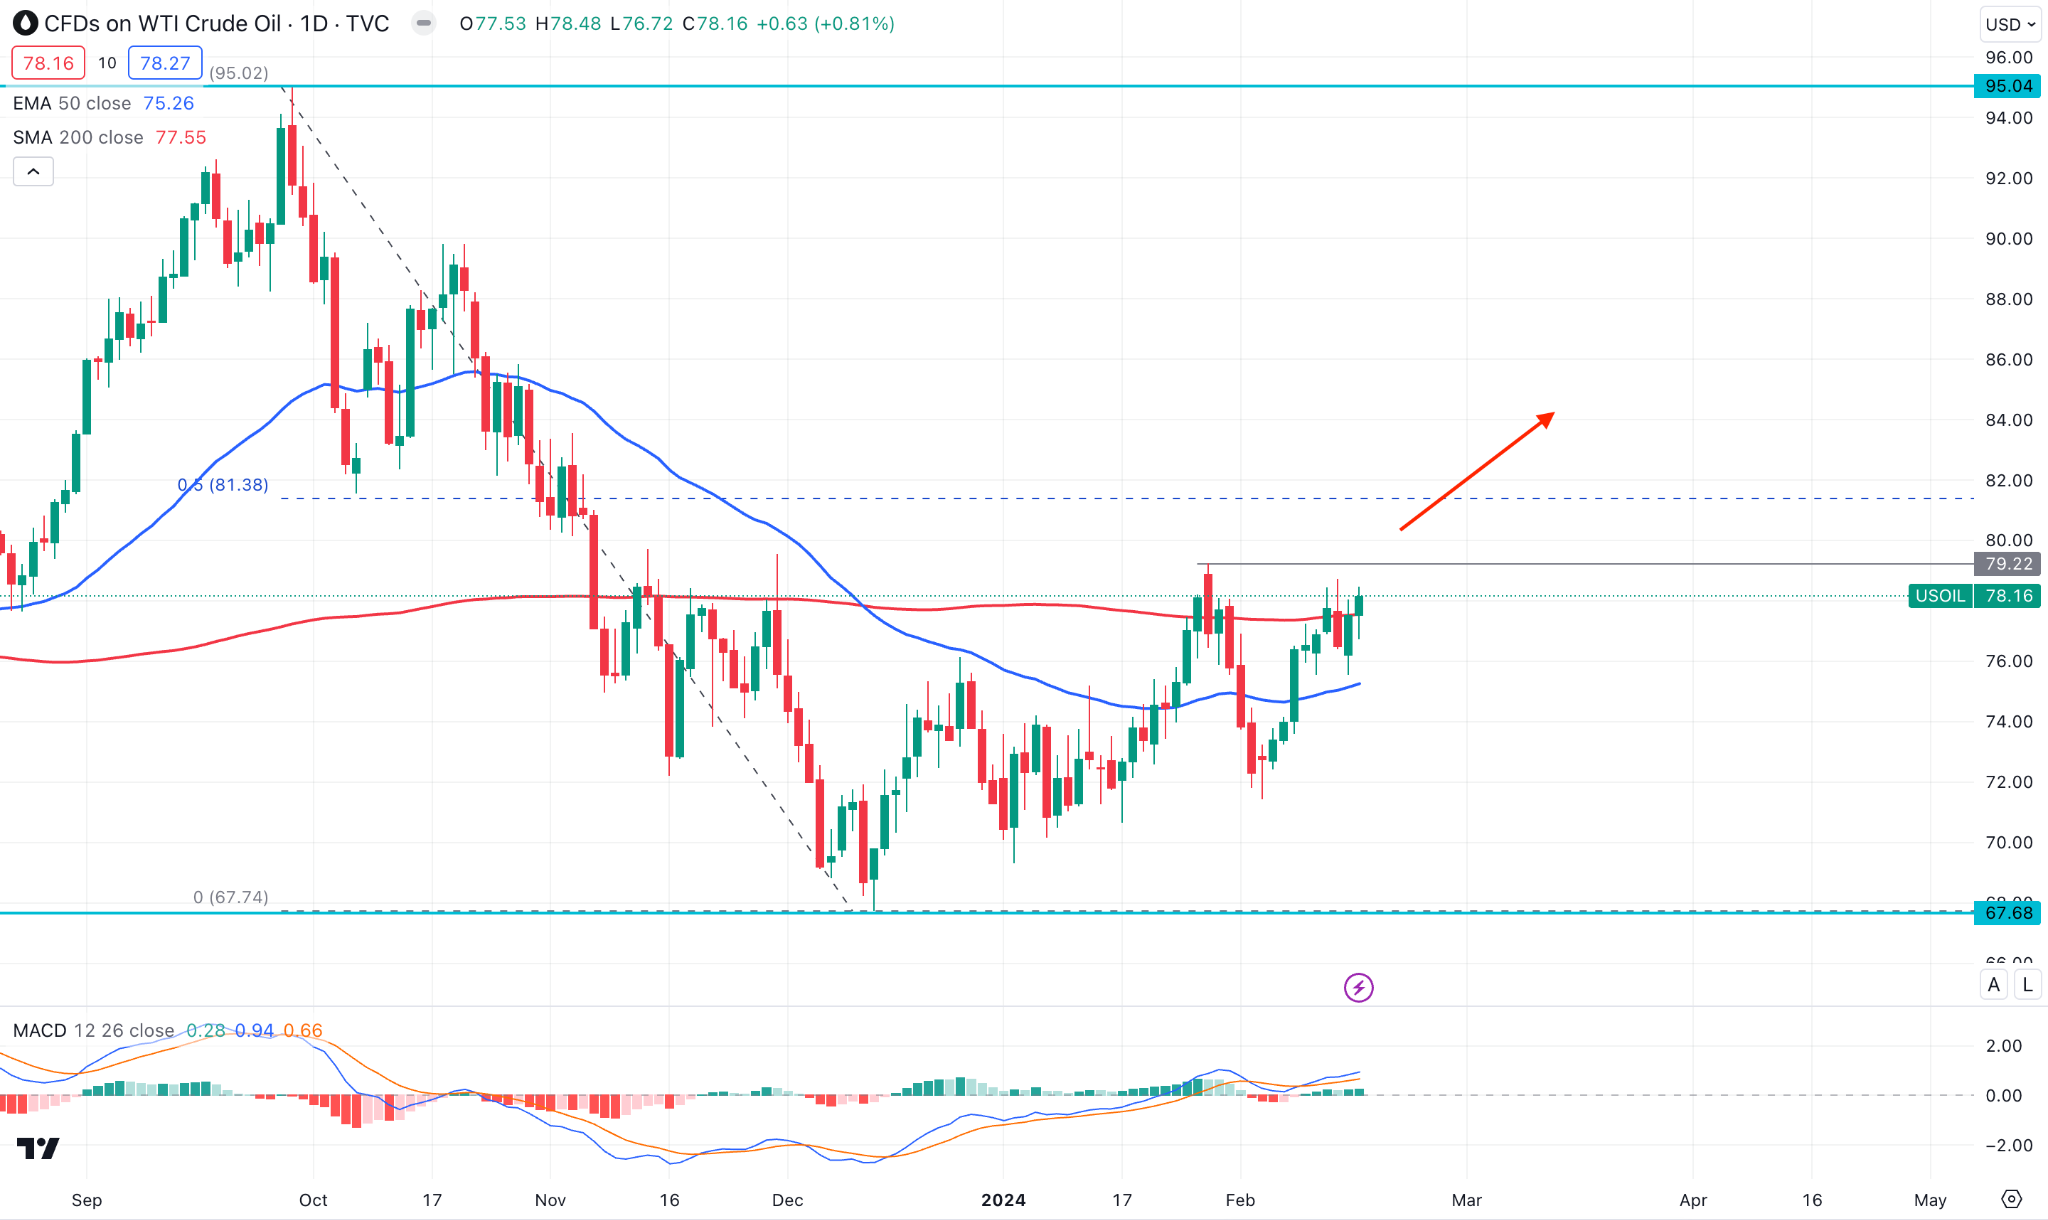
The broader market direction in the daily chart of WTI Crude oil is bullish as the current price hovers at the dynamic 200-day SMA level. In that case, a daily candle above the 79.22 resistance level could be a valid long opportunity. However, an immediate selling pressure with a daily close below the 74.00 level could be a bearish opportunity, targeting the 70.00 level.


