


EURUSD
Fundamental Perspective
The December shift to a more dovish posture by the Federal Reserve has bolstered the argument for the dollar to continue its depreciation through 2024. However, the resilience of the U.S. economy could potentially mitigate the decline of the dollar.
The U.S. currency has primarily fluctuated this year from the two-decade high that it reached in 2022 after the Federal Reserve's rate hikes. This trend can be attributed to strong domestic development and the Fed's determination to sustain elevated borrowing expenses.
The dollar was anticipated to decline 2% against a composite of its peers (DXY) this year, its first annual decline since 2020.
A change was indicated at the December Fed meeting, where Chair Jerome Powell made an unexpected shift and alluded to the conclusion of the historic tightening cycle as a result of easing inflation. Next year, the Fed currently expects a reduction of 75 basis points.
In general, decreased interest rates present a formidable obstacle for the dollar, diminishing U.S. currency investments' appeal for yield-oriented investors. Although analysts predicted that the dollar would weaken in the coming year, a more rapid tempo of interest rate reductions could accelerate the currency's decline.
Technical Perspective
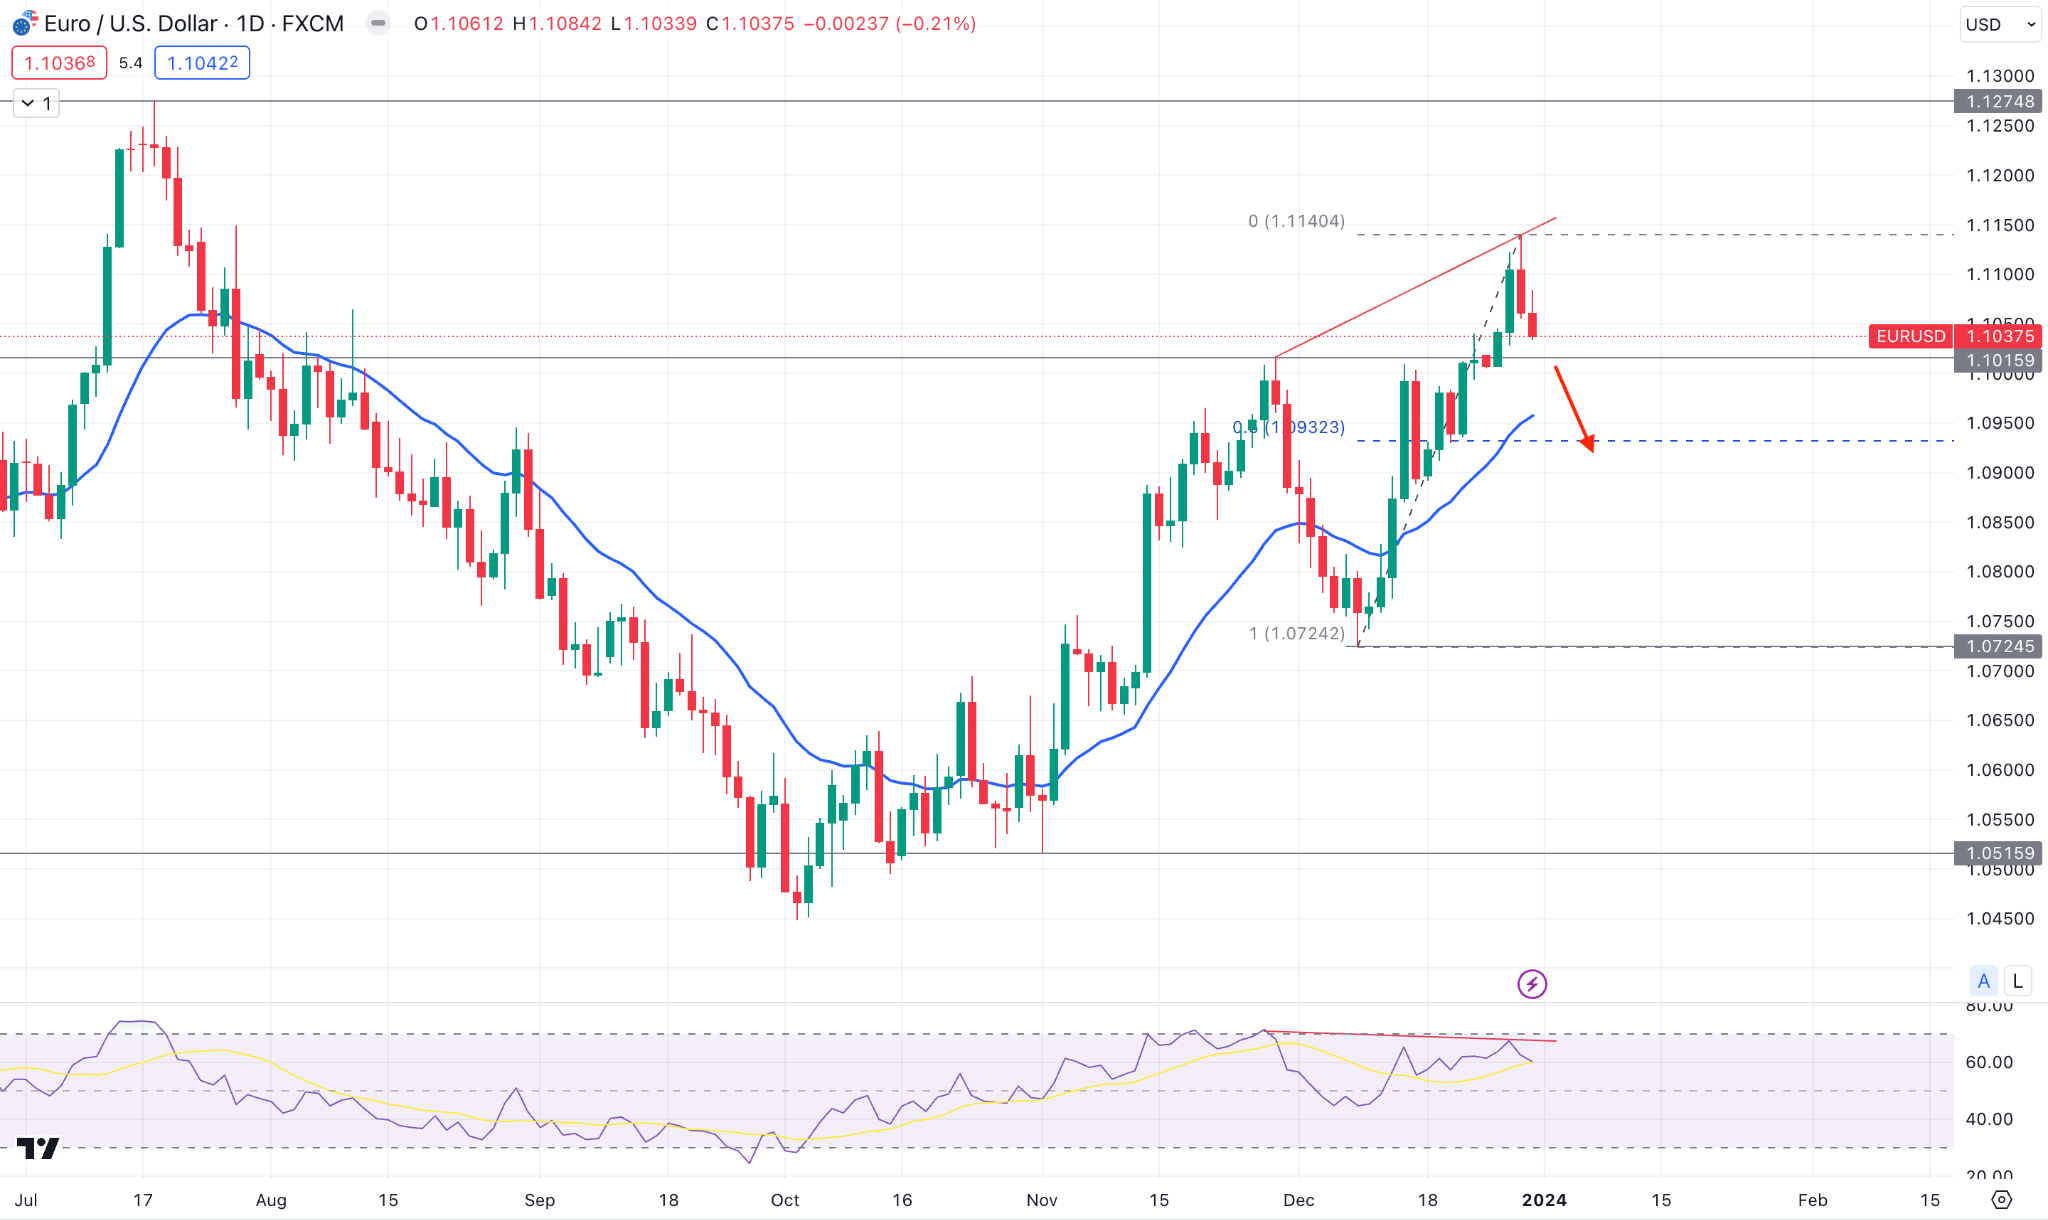
In the weekly chart, the EURUSD showed a bullish continuation but failed to close the candle with a strong buying pressure. However, the sideways close after a bullish impulsive candle suggests valid buying pressure.
In the daily chart, the immediate buying pressure and a bearish rejection above the 1.1015 resistance level indicate a buy-side liquidity sweep in the market. Moreover, the dynamic 20 EMA is below the current price with a strong gap, which suggests a bearish correction as a mean reversion.
Based on the daily outlook, a bearish daily candle below the 1.1015 level could be a short opportunity, targeting the 1.0850 level. However, a bullish rebound is possible from the 20-day EMA, which could resume the existing trend towards the 1.1200 area.
GBPJPY
Fundamental Perspective
Despite the recent announcement by the Bank of Japan that policy action at the January 23 meeting is unlikely, yen option dealers continue to be vigilant.
Market volatility is crucial in foreign exchange options, and dealers establish premiums based on anticipated volatility using implied volatility. During the life of an option, realized volatility that corresponds to implied volatility will typically be sufficient to cover the premium.
Following the BoJ's decision, there was a discernible decrease in implied volatility associated with the JPY; however, it remained above recent lows compared to other currencies. Before the BoJ's action, the implied volatility for the 1-month USD/JPY peaked at 11.9 but subsequently declined to 8.7. Nevertheless, it rebounded to surpass 10.0 by Thursday, considering the January 23 meeting and any possible policy-related declarations in the expiration.
There is a greater likelihood that the Bank of Japan (BoJ) will modify its negative interest rate policy during its meetings on April 26 or March 19, as anticipated. This would result in increased implied volatility for subsequent expirations.
Technical Perspective
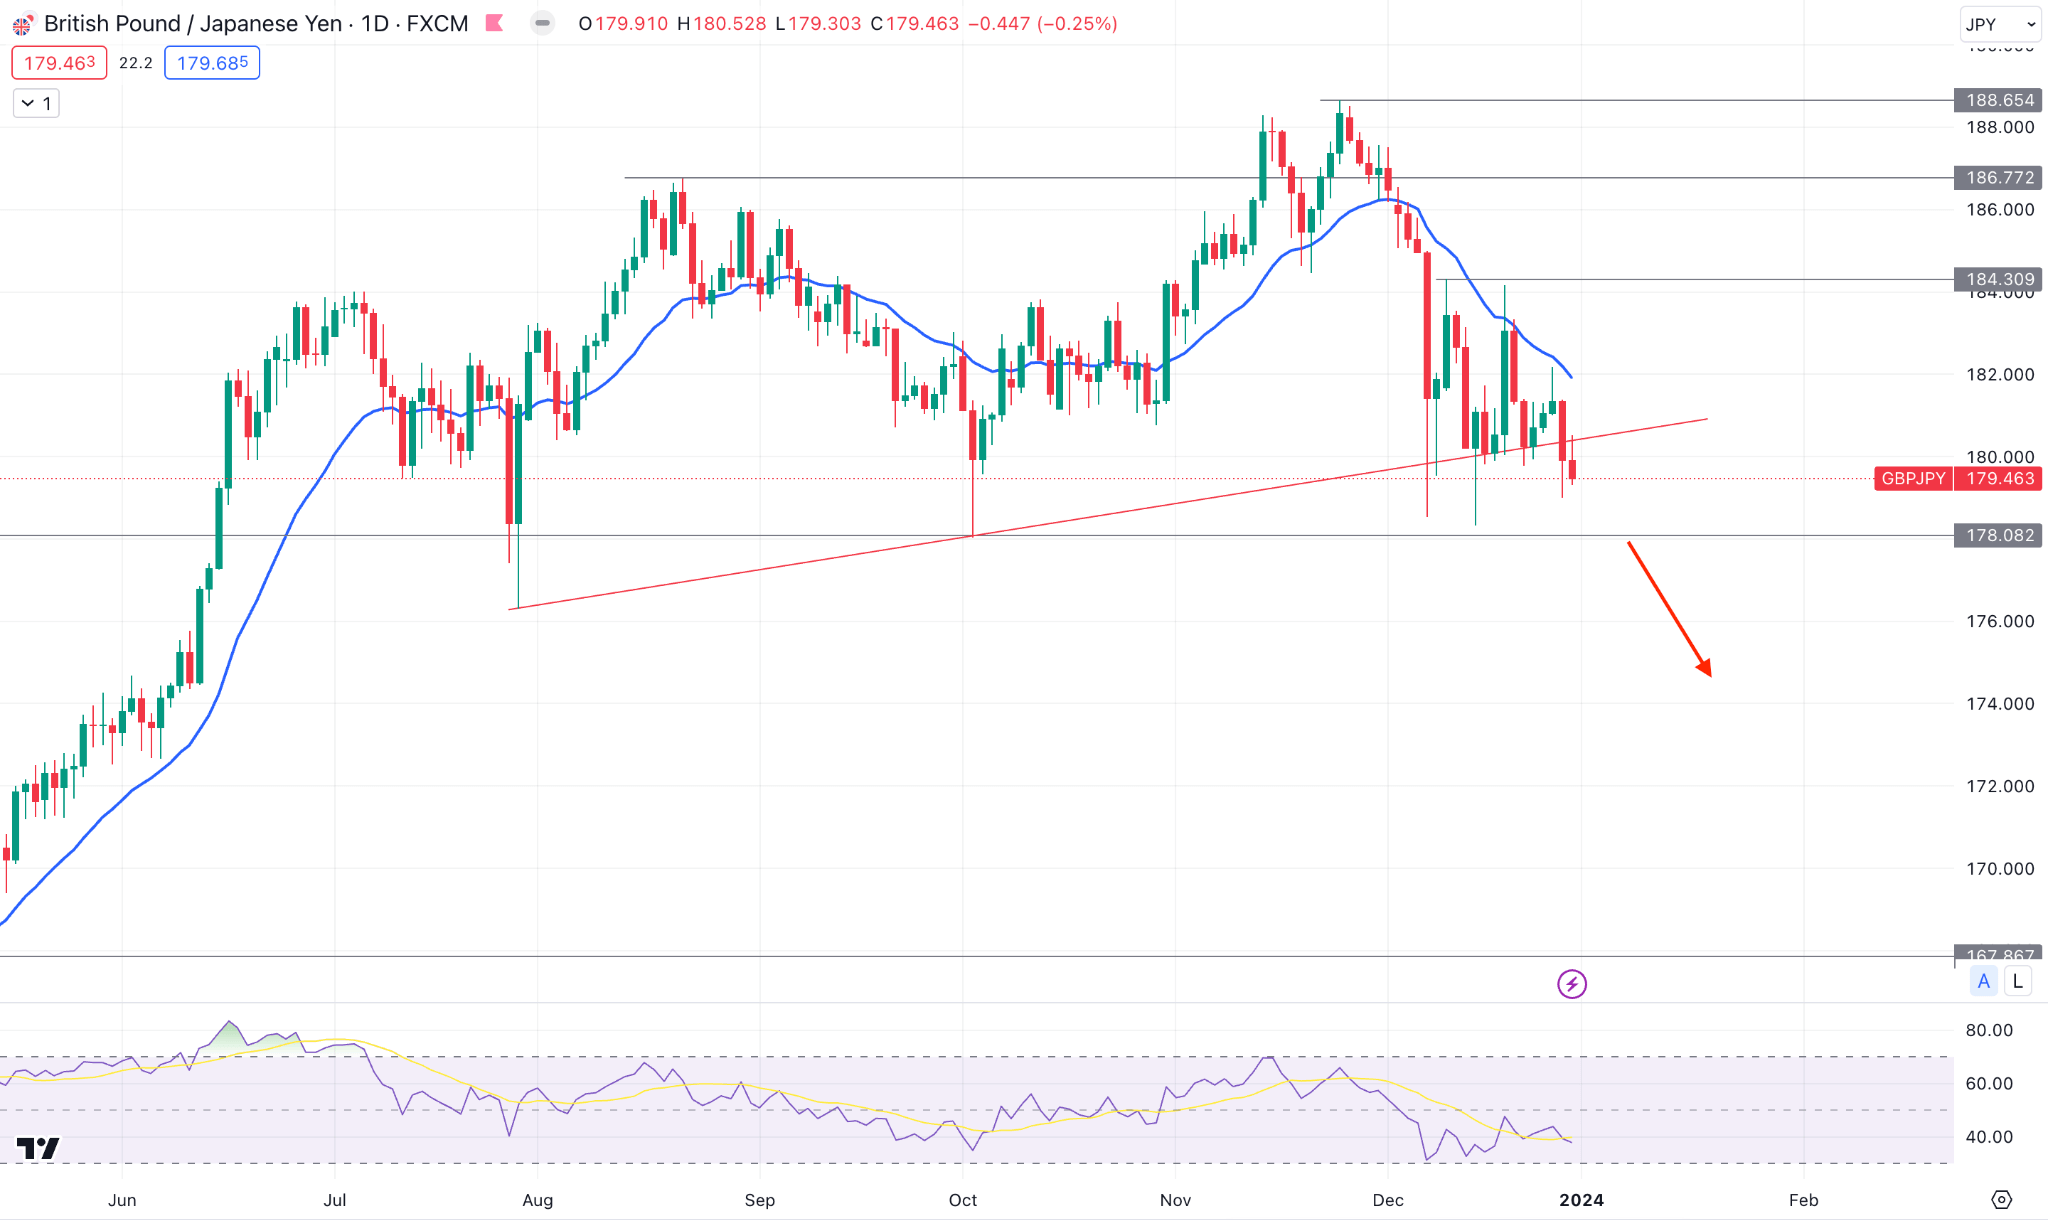
In the weekly GBPJPY price, the latest candle closed as a bearish inside bar, which could work as a continuation opportunity.
In the daily chart, a bearish daily close below the trendline support with the support from the dynamic resistance could be a potential short opportunity in this pair. Meanwhile, the 14-day RSI shows a corrective pressure as the current reading remains sideways below the 50.00 line.
On the bullish side, a valid upward pressure with a stable market above the dynamic 20-day EMA could be a long opportunity, targeting the 186.72 level.
Nasdaq 100 (NAS100)
Fundamental Perspective
Since its low point in late October, the Nasdaq 100 has ascended for nine consecutive weeks. It is approaching the psychological threshold of 17,000, which may function as a temporary obstacle.
In the realm of data, the EIA crude oil inventories, the US commodities trade balance, initial jobless claims, wholesale inventories, and pending home sales are among the most significant releases. These may cause fluctuations in oil prices and stock indices, especially considering the lack of trading activity that persists towards the year's conclusion.
There is a possibility of encountering support near the weekly high of 16,863. This level has the potential to act as a protective barrier against any declines.
Technical Perspective
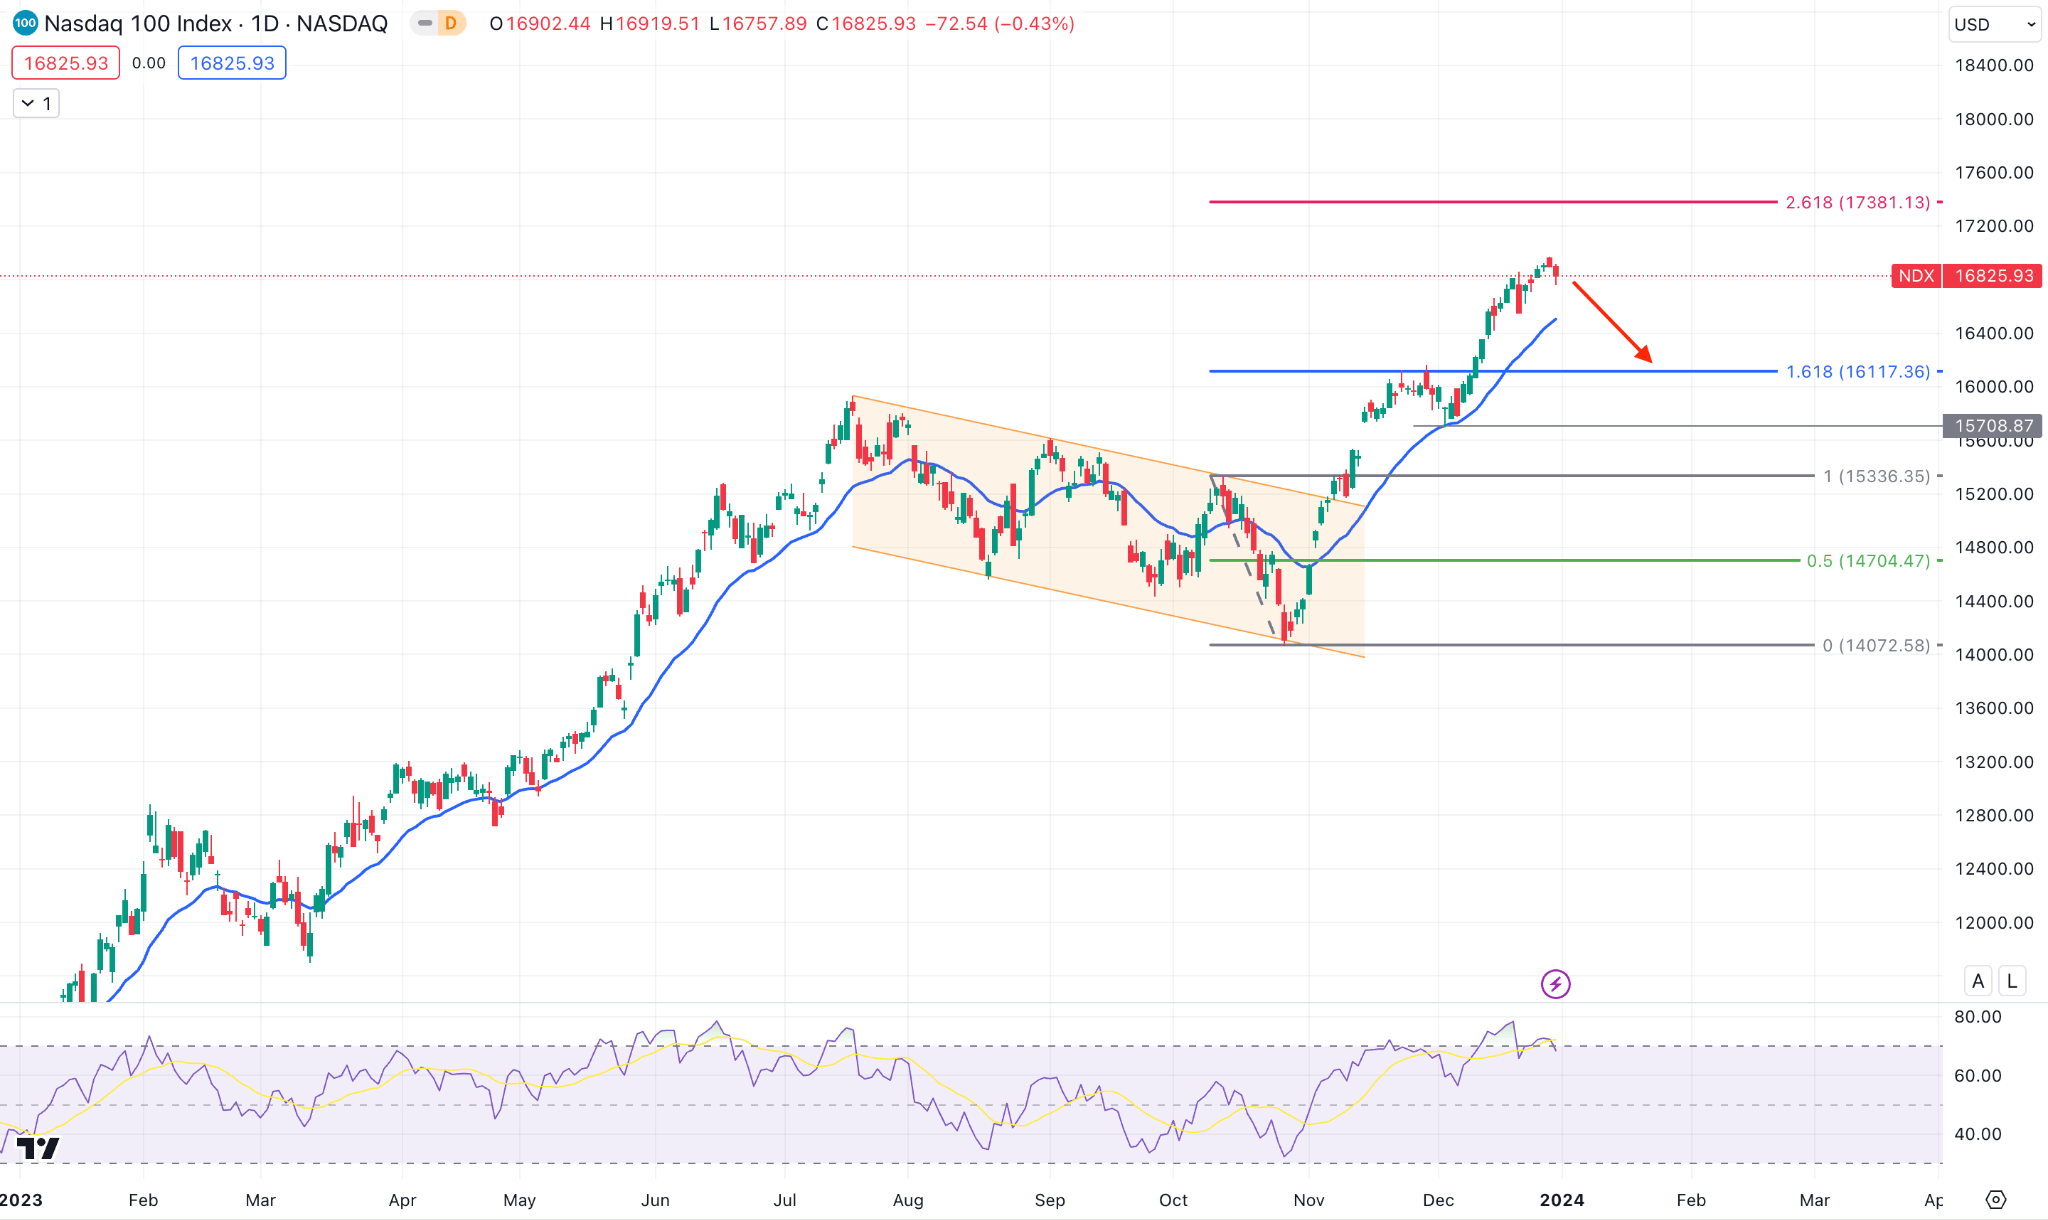
In the weekly Nasdaq 100 price, the latest candle closed as a doji after a strong bullish candle. It indicates that bulls are losing momentum, where the yearly shift could be a bearish correction.
In the daily chart, the dynamic 20 EMA still works as a major support while the current price trades above the 161.8% Fibonacci Extension level from the existing price swing.
Based on this outlook, a downward pressure might extend towards the 15708.87 swing low. However, a decent downside correction might result in a bullish continuation, but a stable market above the multi-year high is needed.
S&P500 (SPX500)
Fundamental Perspective
U.S. stocks concluded a strong year-end rally on the last trading day of 2023, with a minor decline in the close. This decline occurred as investors anticipated a more accommodating monetary policy in the coming year.
During the year's final months, the stock market witnessed substantial positive momentum, which propelled all three main indexes to achieve monthly, quarterly, and annual gains.
The year was marked by significant upheaval, including the March banking crisis in the United States, an upsurge in artificial intelligence stocks, and apprehensions regarding energy supply due to the Israel-Hamas conflict.
In contrast, a year-end rally was instigated by declining interest rates, which gained traction in December when the Federal Reserve referred to possible reductions in U.S. interest rates in 2024. This came after a series of rate hikes effectively reined in inflation to the 2% annual target set by the central bank.
Technical Perspective
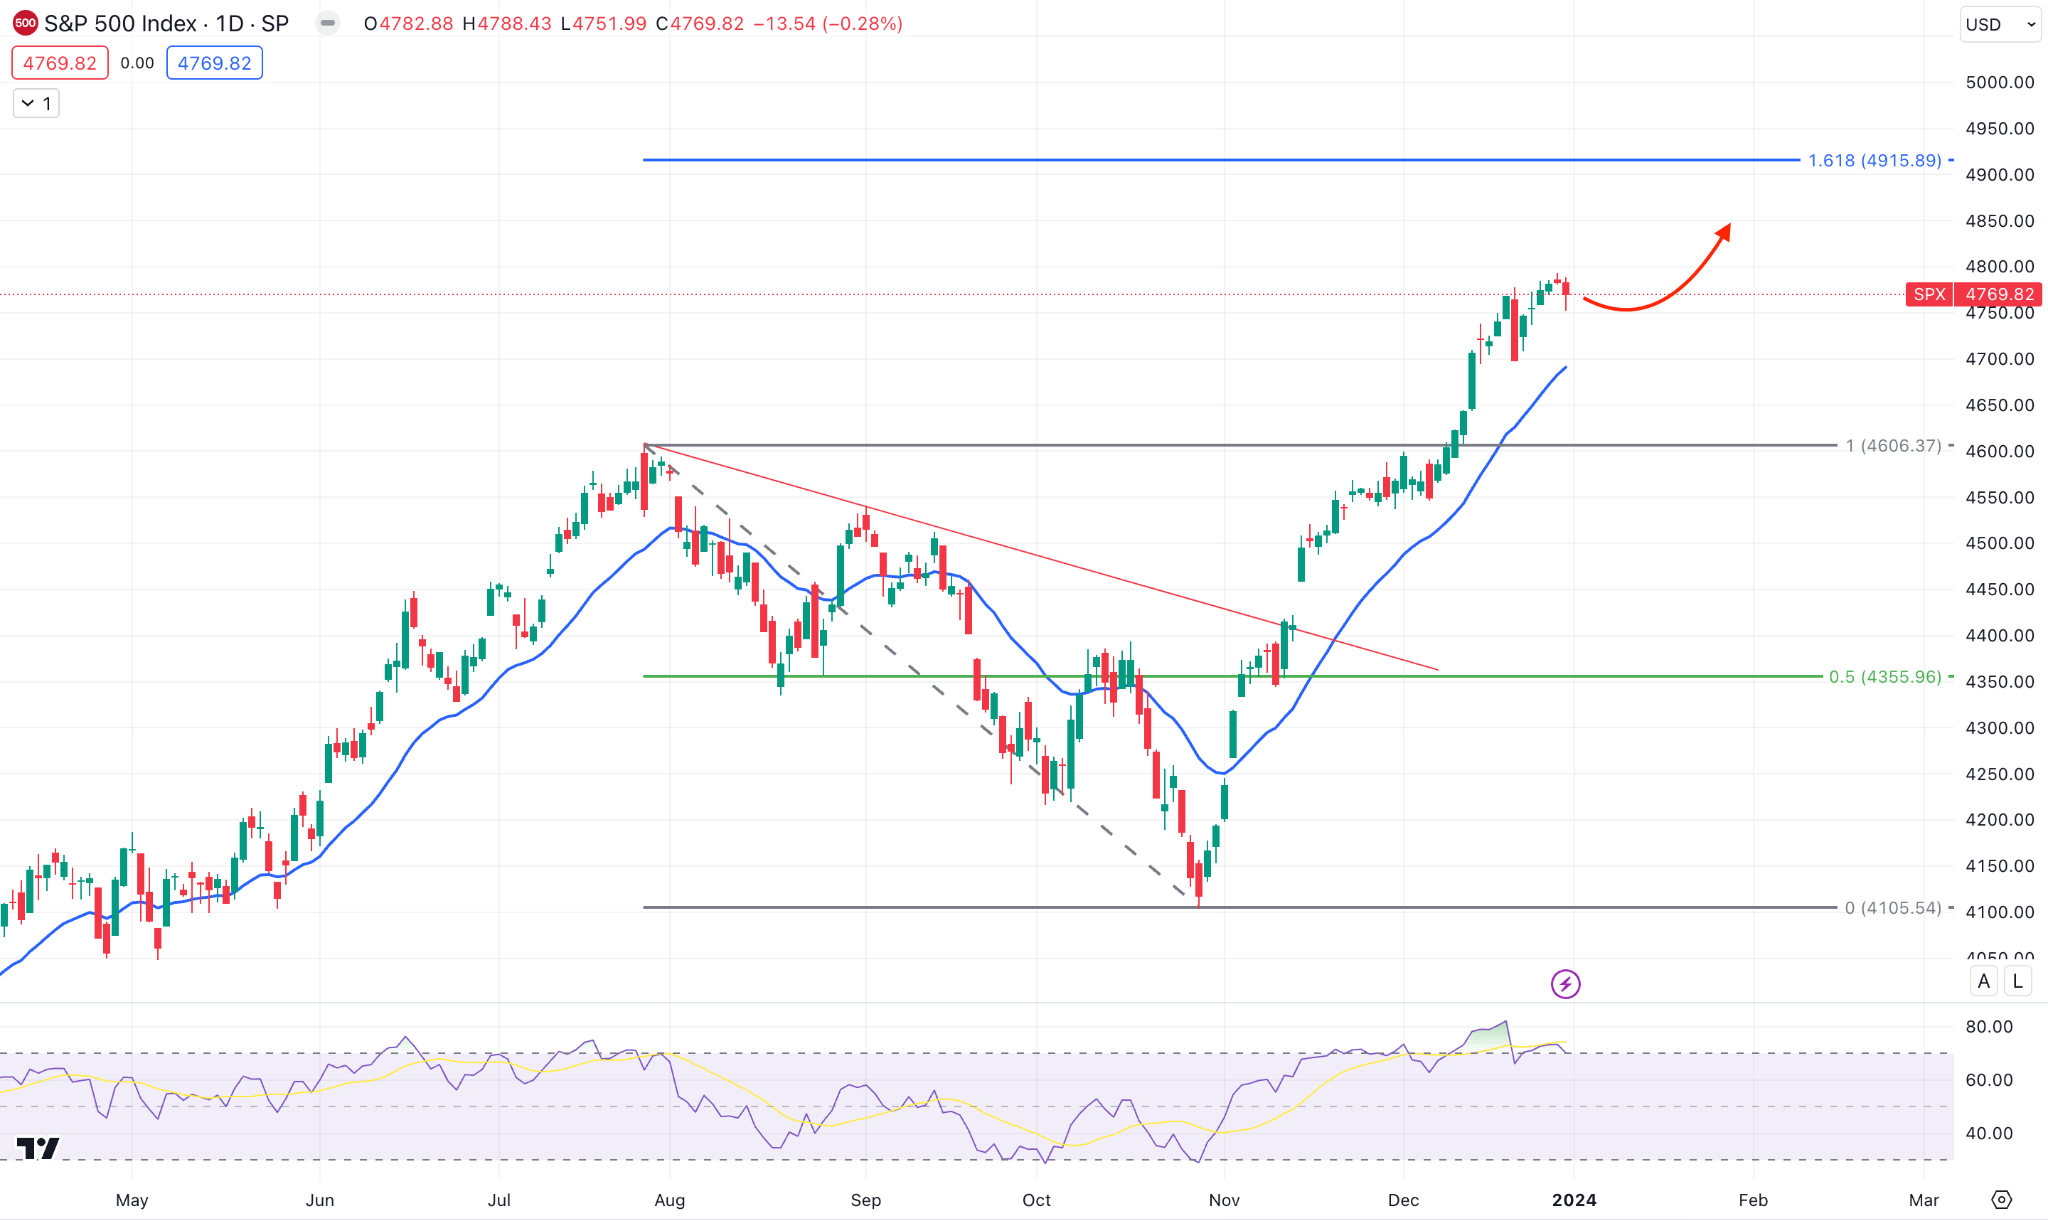
In the W1 S&P 500 chart, the buying pressure has faded recently, suggesting an upcoming bearish correction. However, a bearish weekly candle from the current price area could be a conservative bearish opportunity.
The daily chart shows the recent price trades above the dynamic 20-day EMA with an overbought condition in the daily RSI. In that case, a minor downside correction and a bullish reversal from the dynamic level could be a long opportunity.
However, a sharp bearish pressure with a daily candle below the 4606.37 level, could lower the price towards the 4400.00 psychological level.
Hang Seng Index (HK50)
Fundamental Perspective
Hong Kong stocks concluded the last trading day of the year in positive territory, exhibiting minimal change, as investors maintained a prudent stance regarding the outlook for 2024.
The Hang Seng Index experienced a marginal increase, culminating in the day at 17,047.39 on Friday. This was consistent with the Hang Seng China Enterprises Index, which concluded the day at 5,768.50.
The managing director of Kaiyuan Capital in Hong Kong, Brock Silvers, voiced apprehensions regarding elements that may pose a threat to Hong Kong's status as a financial center in Asia. Alongside ongoing geopolitical tensions, he emphasized the possibility that the housing crisis in China and the challenges encountered by mainland local governments could overshadow the city's cyclical gains in the coming year.
Regarding corporate developments, UBTech Robotics experienced positive performance on its initial trading day. Shares of the company closed at HK$90.85, representing a 0.9% surge from its initial offering price of HK$90.
Technical Perspective
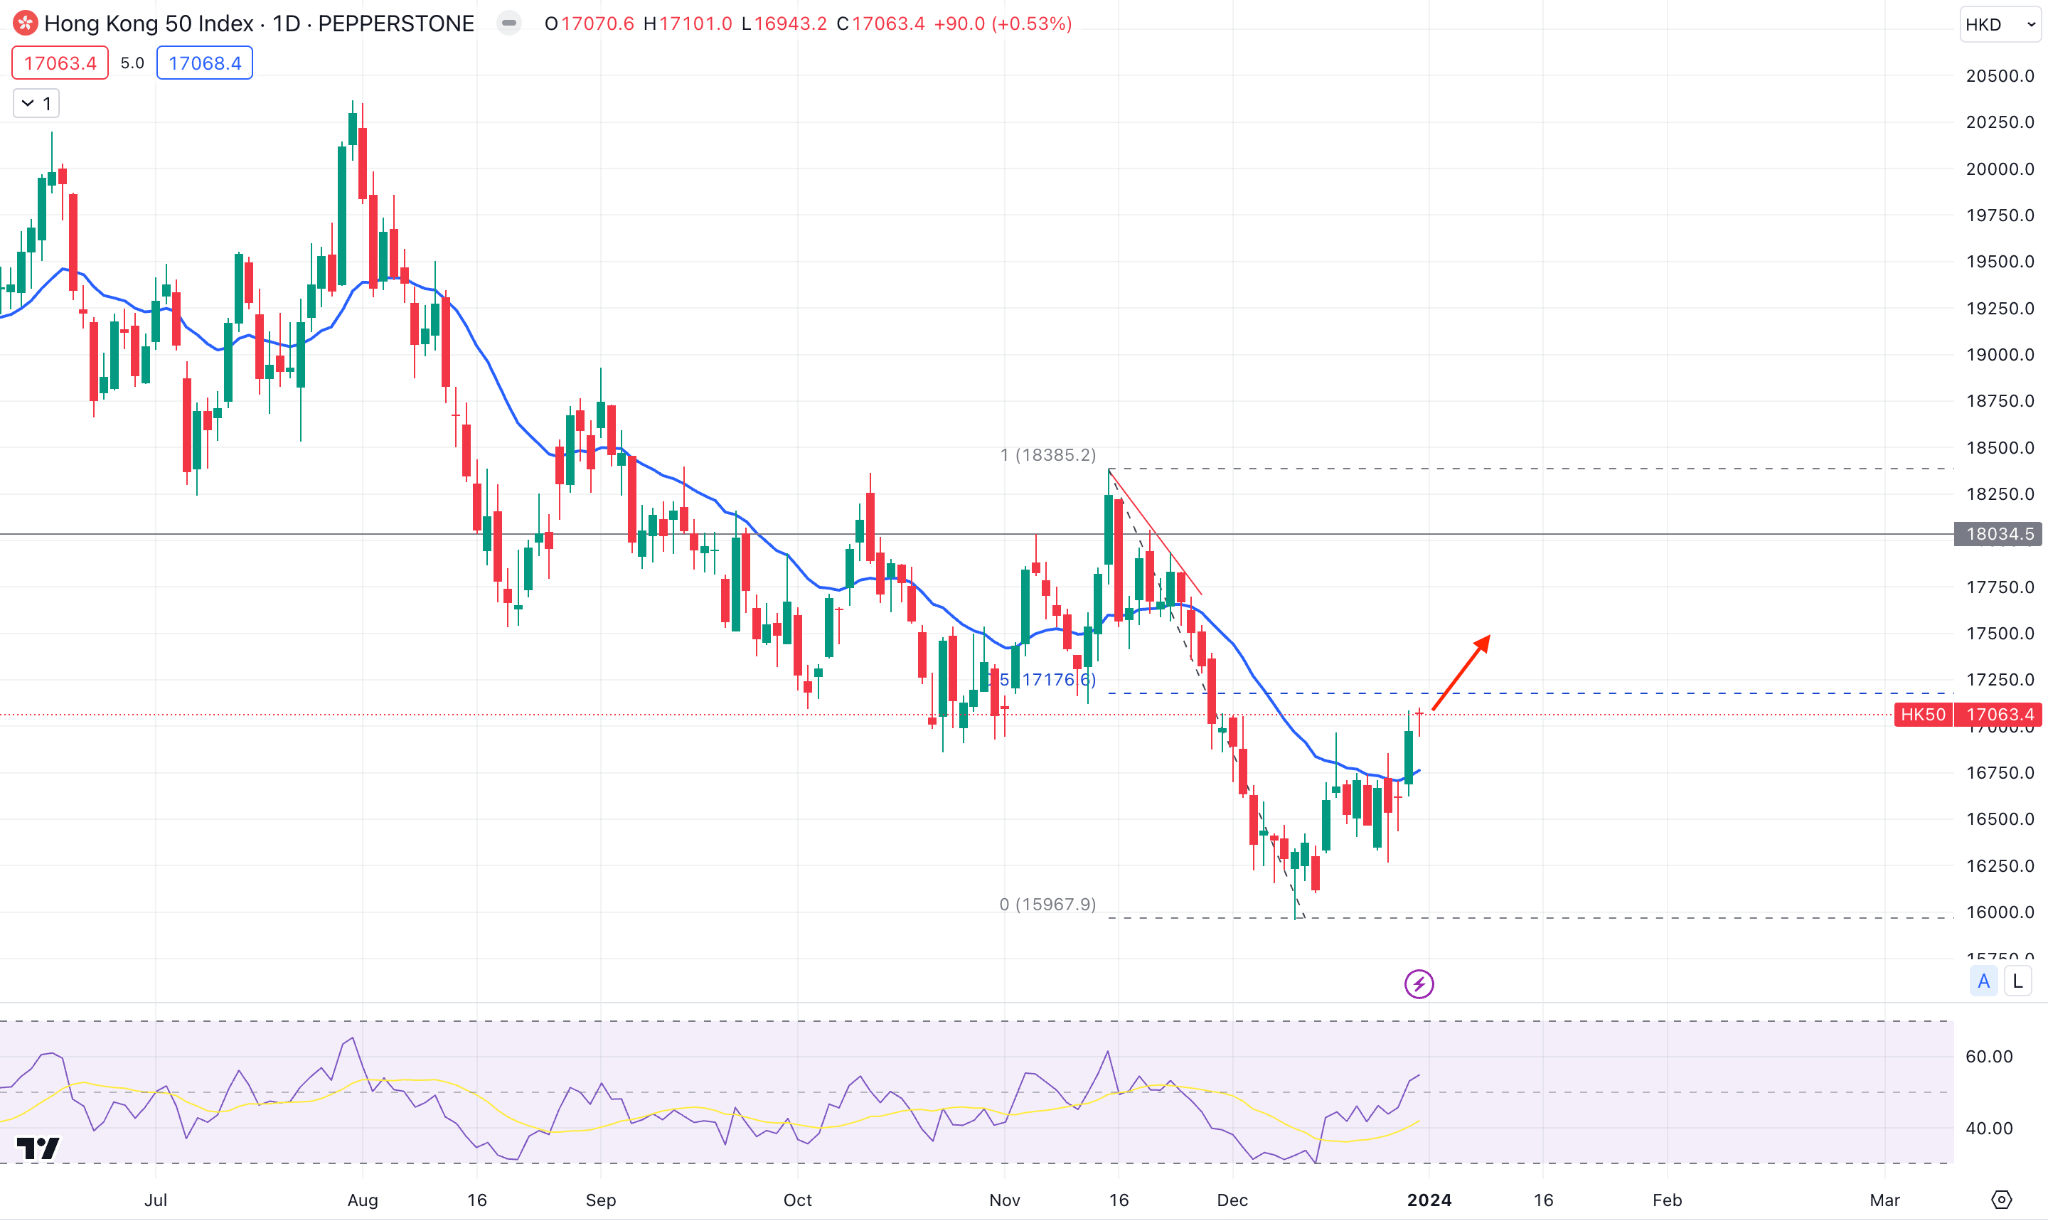
In the weekly chart, the HK 50 closed bullish after an inside bar formation, which is a sign of a stable bullish trend.
In the daily chart, the existing buying pressure is visible above the 20 day EMA. Moreover, the 14 day RSI looks bullish as it remains upwards above the 50.00 line.
Based on this structure, an upward constitution above the 17176.76 level is potential until there is an immediate reversal below the 20 DMA.
Bitcoin (BTCUSD)
Fundamental Perspective
According to a recent Reuters report, the US Securities and Exchange Commission (SEC) may inform asset managers of the status of their applications to establish a spot Bitcoin ETF as early as next week.
On Saturday, December 30, Reuters reported that the fourteen Bitcoin ETF petitioners might receive notification from the SEC regarding their approval status no later than Tuesday or Wednesday of the following week. This action surpasses the January 10 deadline by which the agency is expected to decide regarding Ark Invest and 21 Shares' ETF application.
Invesco declared a fee of 0.59% on the initial $5 billion assets for the first half-year following the launch. In the interim, BlackRock, a prominent contender in the Bitcoin ETF sweepstakes, disclosed in its updated application that Jane Street Capital and JP Morgan Securities are authorized participants.
This recent development signifies that the SEC has decided to complete the evaluation of Bitcoin ETFs by the commencement of the new year. However, the latest report from Reuters instills a sense of optimism concerning the agency's potential approval of numerous ETF applications by January 10.
Technical Perspective
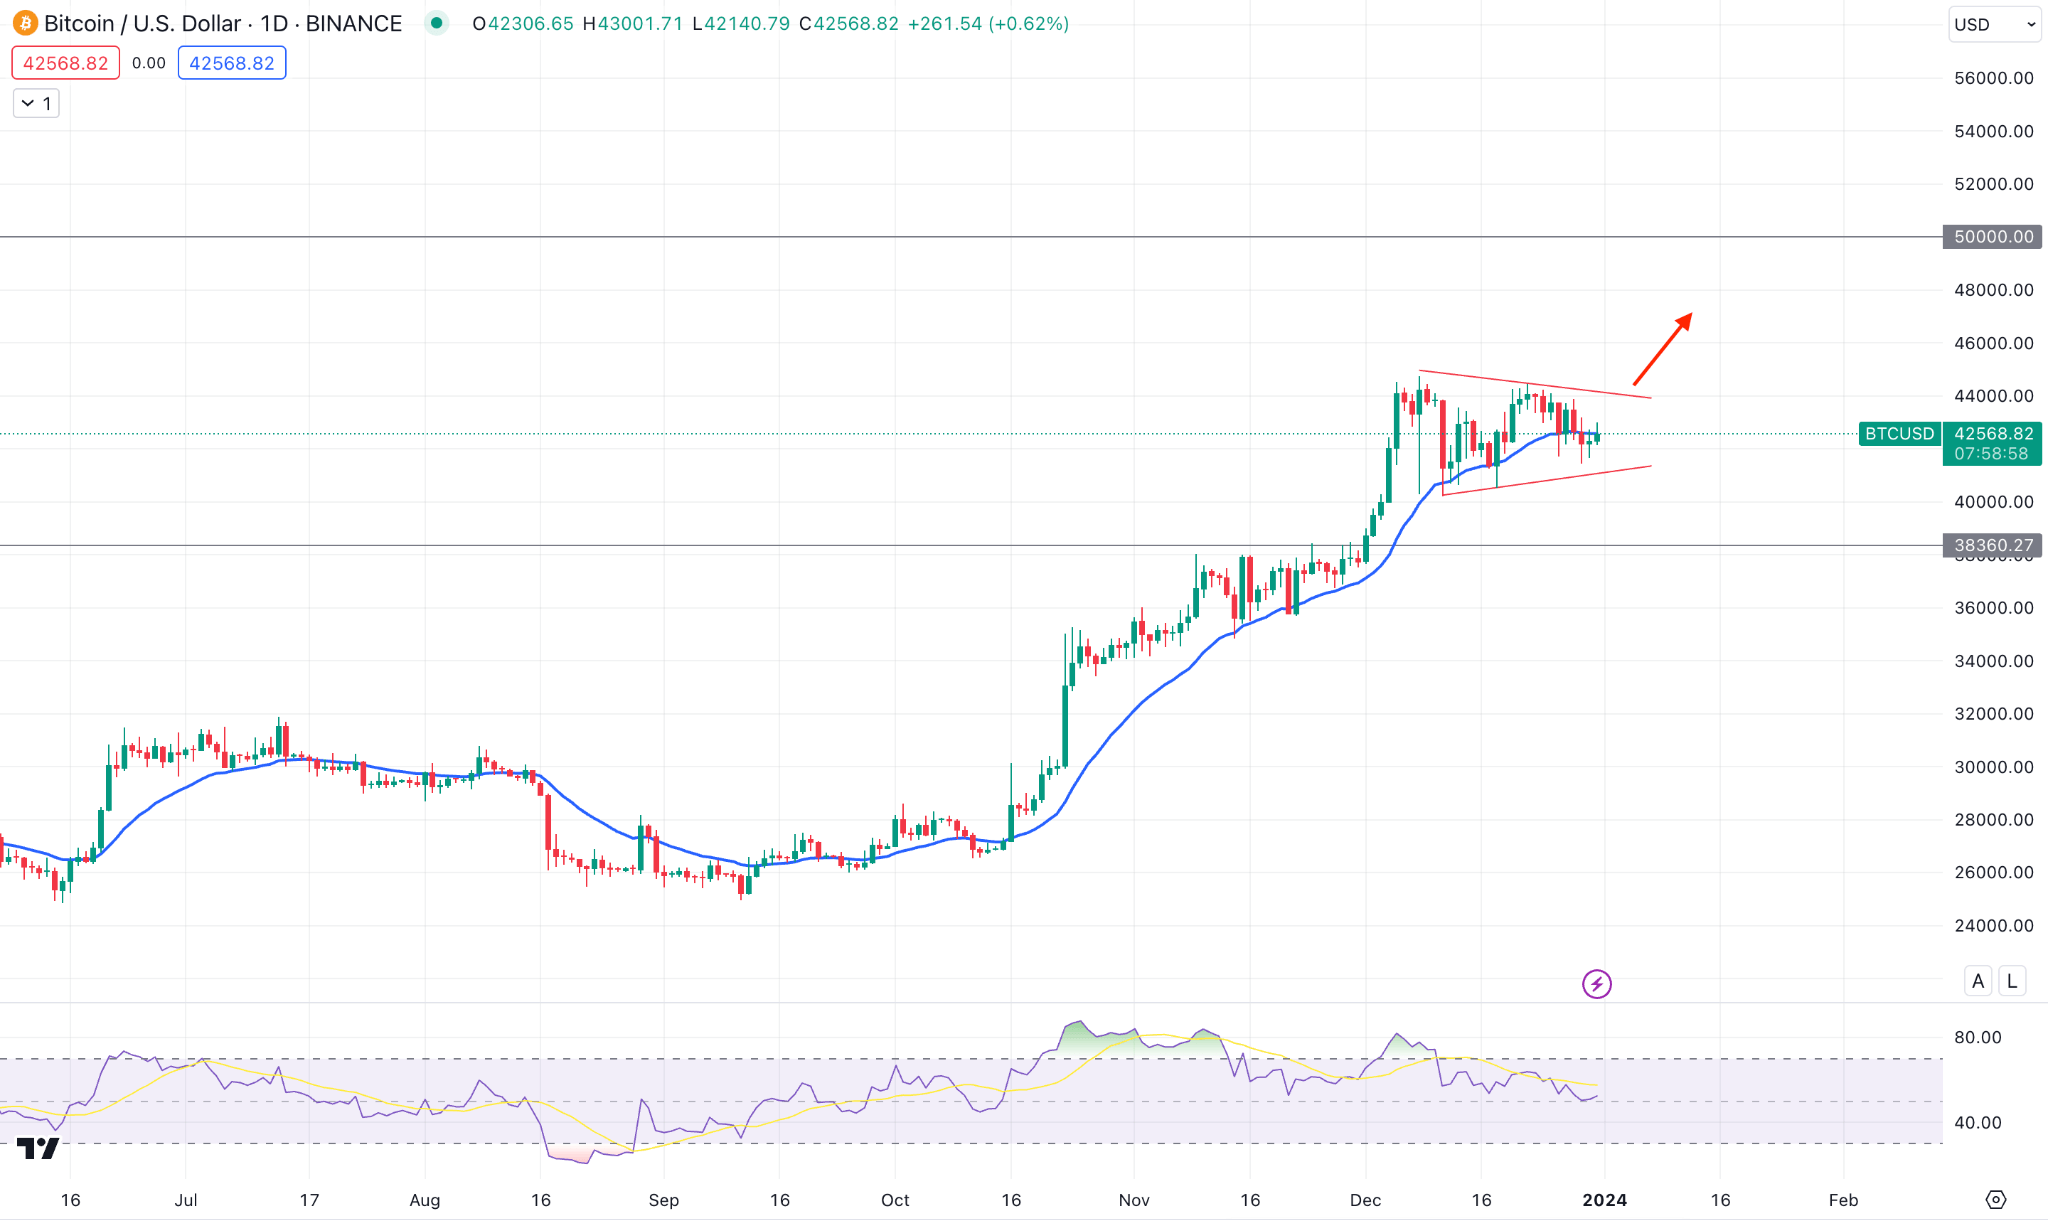
In the weekly candlestick, BTCUSD closed as an inside bar where the previous candlestick was bullish. In that case, a new weekly close above the previous week's high could be a potential long opportunity.
In the daily chart, the bullish pennant pattern is visible, where a daily close above the trendline resistance could be a long opportunity, targeting the 50,000.00 line.
Ethereum (ETHUSD)
Fundamental Perspective
Vitalik Buterin, an entrepreneur and visionary at Ethereum, has unveiled a revised blockchain-based platform roadmap emphasizing strategic and enduring improvements. These developments demonstrate Ethereum's ongoing effort to strengthen network security and optimize its protocol to create a more streamlined system.
Buterin is confronting the challenge of addressing vulnerabilities and unjust advantages that arise from centralization in Proof of Stake (PoS).
MEV (Maximal Extractable Value) is the focus of the recently updated "The Scourge" phase. It specifies the utmost value that miners are permitted to extract in addition to standard block rewards and gas fees. This phenomenon can potentially favor larger entities possessing greater resources, promoting centralization.
To mitigate these risks, Buterin's strategy entails investigating novel MEV mechanics and redistributing blocks.
Furthermore, this strategy reflects a community-wide agreement to de-prioritize "state expiry," recognizing the potential of stateless clients and other advancements in the more efficient management of blockchain state.
These advancements exemplify a purposeful and systematic advancement in the evolution of Ethereum, prioritizing timely and incremental enhancements over delaying extensive redesigns.
Technical Perspective
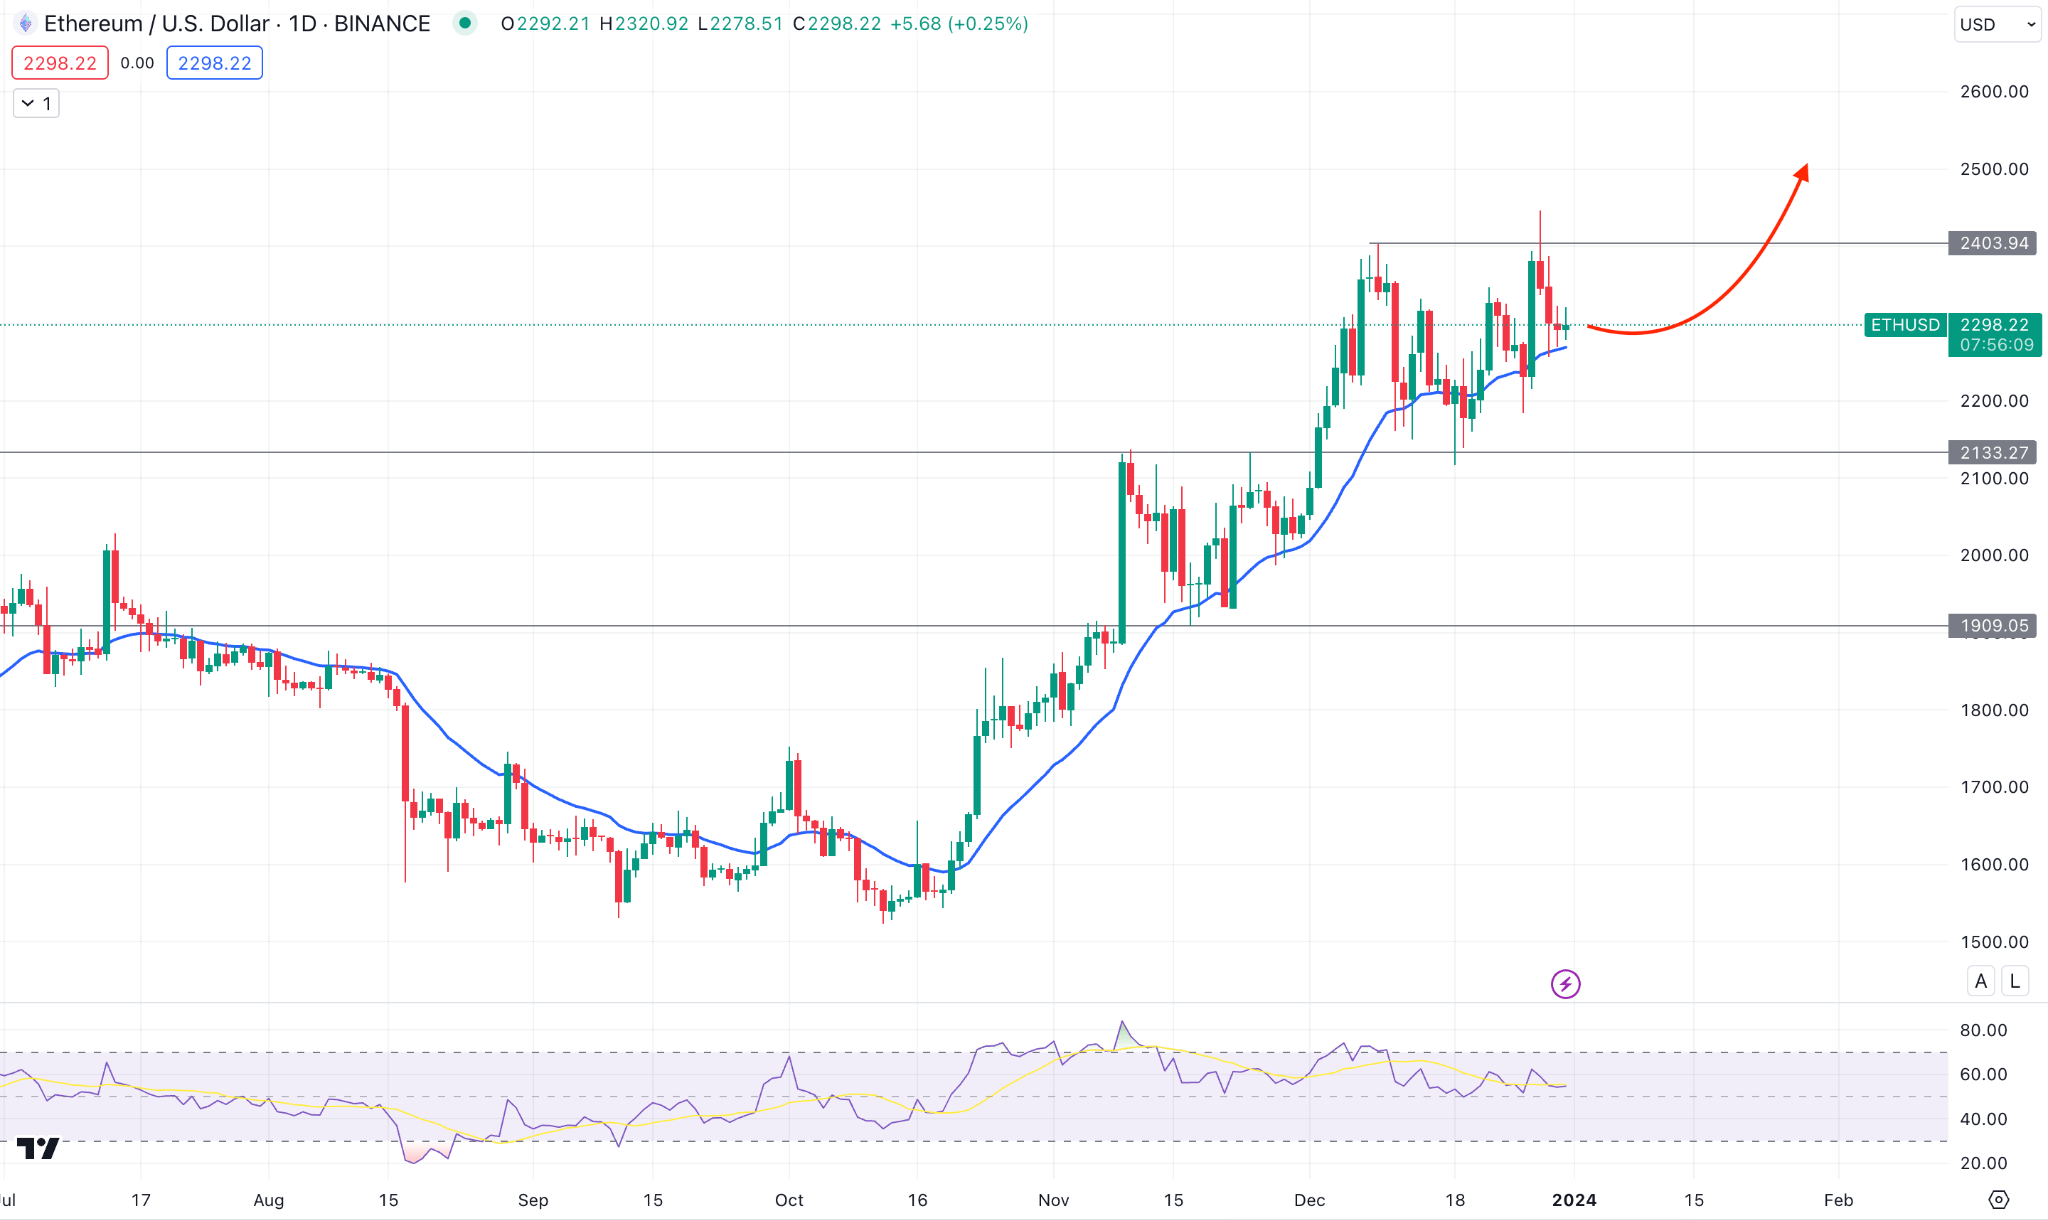
In the weekly ETHUSD chart, the recent candle shows a buy-side liquidity sweep as the weekly candle closed after making a bullish break and rebound from the existing range.
The daily chart also suggests a volatile market structure, where the 20 EMA works as an immediate support. An upward continuation could test the 25000.00 level as the long-term trend is bullish.
However, a bearish pressure with a daily close below the 2133.00 event level could limit the gain for this instrument.
Tesla Stock (TSLA)
Fundamental Perspective
Bloomberg reports that the electric vehicle (EV) manufacturer is preparing to introduce a revised Model Y directly from its manufacturing facility in Shanghai.
According to sources with knowledge of the plans, the organization is preparing these revisions in China to start mass production by the midpoint of the following year. Although the SUV underwent some modifications in October, such as adding ambient lighting and a new wheel design, the 2024 model is expected to feature more pronounced exterior and interior changes.
According to data from Experian, the Model Y ranked as the second most popular car in the United States during the third quarter of this year, accounting for 2.5% of all light vehicles sold.
As per the recent report, China's BYD is expected to surpass Tesla as the leading global manufacturer of electric vehicles, a shift that is probable to take place in the current quarter.
Technical Perspective
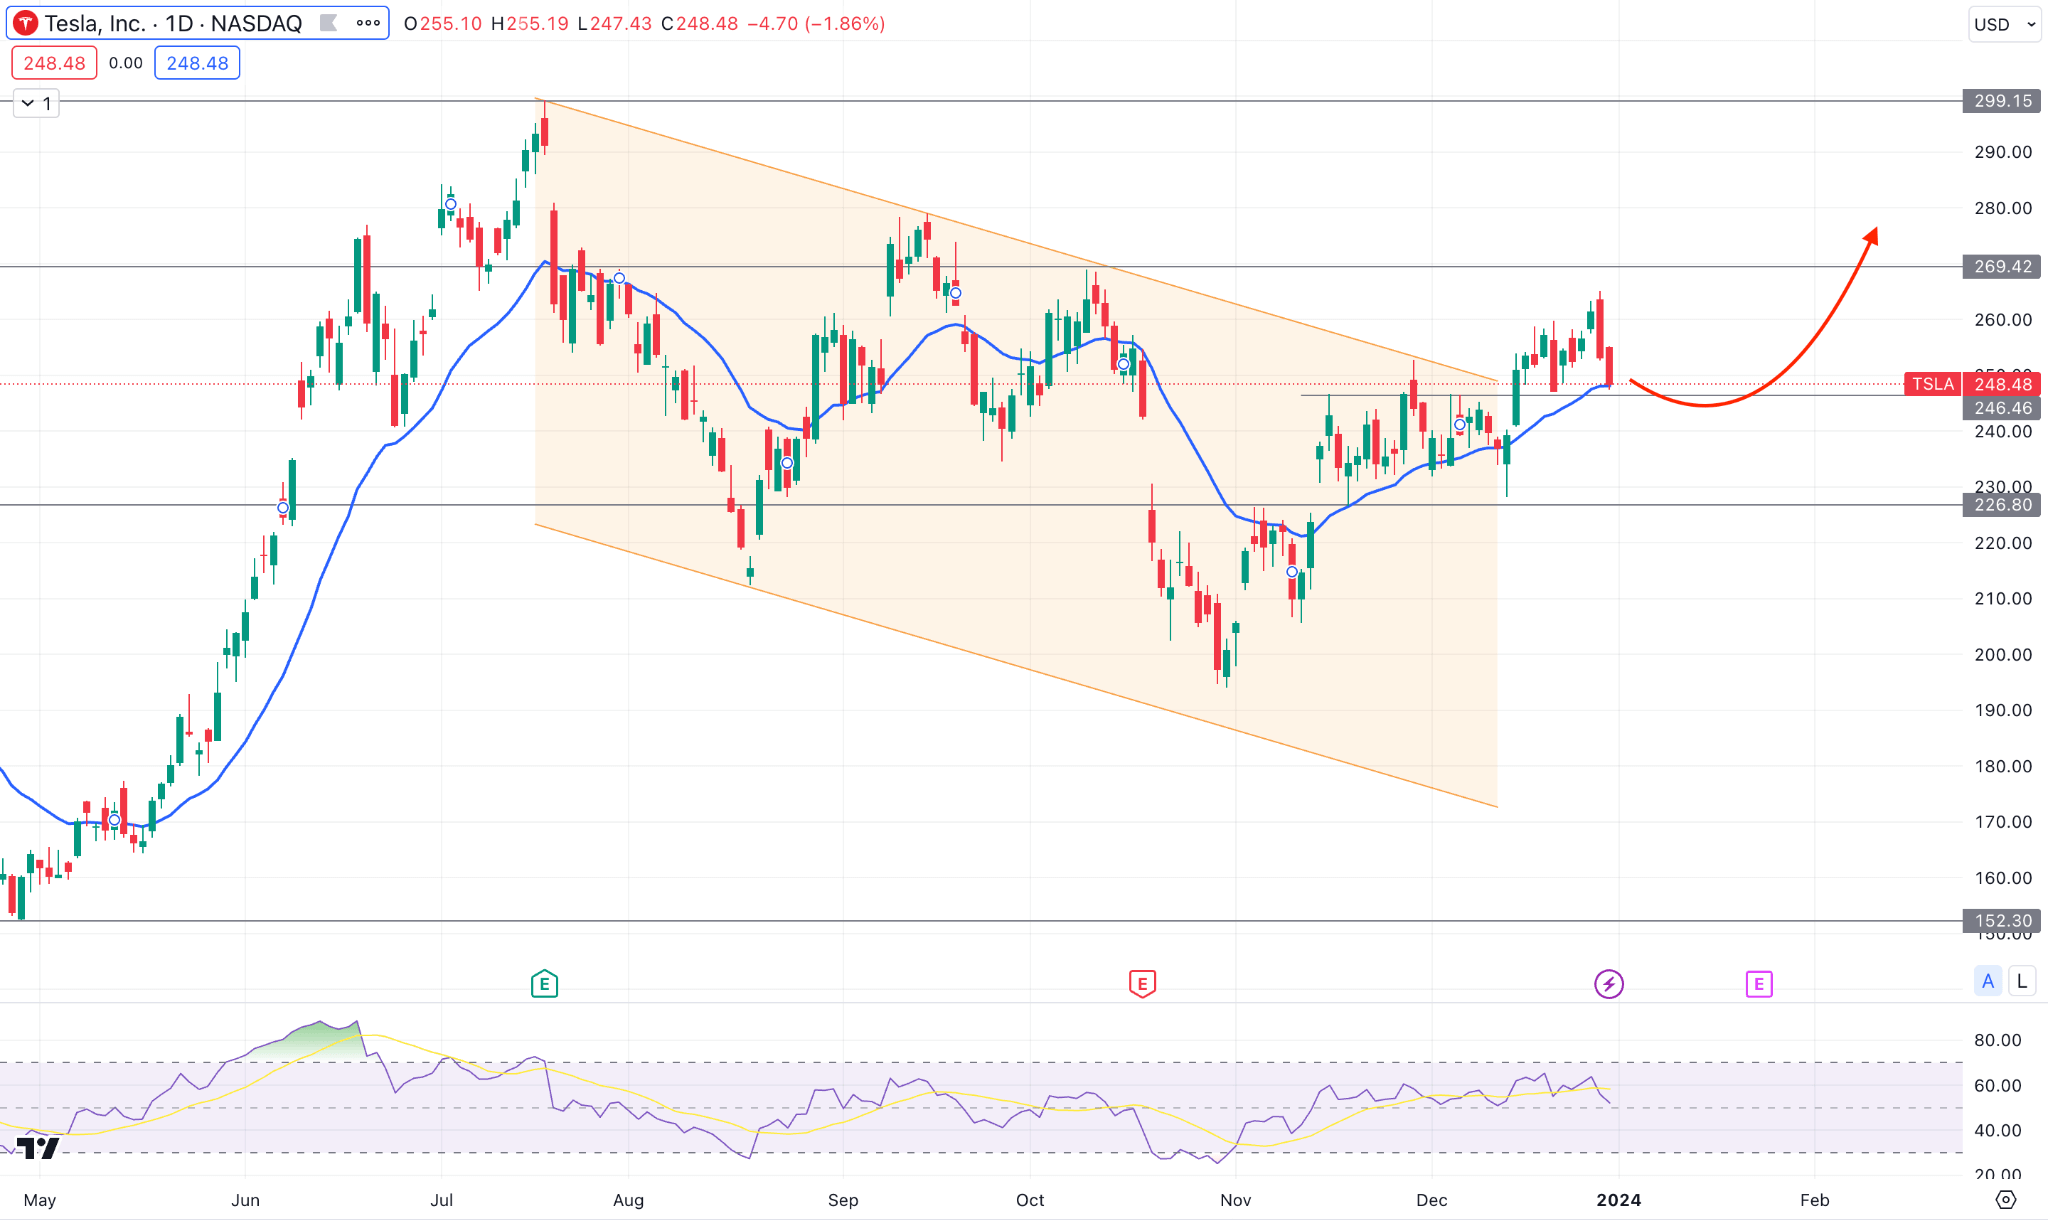
In the daily TSLA stock chart, the bullish channel breakout suggests a buying pressure, but the most recent candles suggest a corrective price action.
Although the dynamic 20 EMA works as a support, a bearish pressure below 226.80 could be a short opportunity. Moreover, an immediate rebound with a daily candle above the 269.42 level might resume the bullish trend, targeting the 299.15 level.
GOLD (XAUUSD)
Fundamental Perspective
The Chicago Purchasing Managers' Index (PMI) declined by 8.9 points to 46.9, reentering contractionary territory. Contrary to initial expectations, consensus projections had predicted a more moderate decrease to 51.
The PMI signifies a monthly contraction when it declines below 50, whereas an increase to above 50 indicates expansion. Analysts expect the broader nationwide PMI from the Institute for Supply Management (ISM) to exhibit a slight improvement, culminating in a 47.1 reading that remains in contractionary territory upon its release on Wednesday. The index would experience its fourteenth consecutive month of contraction at this time.
In addition to the manufacturing and services PMIs released by the ISM, investors can expect a deluge of labor market data to commence the year. This includes reports such as the Job Openings and Labour Turnover Survey (JOLTS), ADP, Challenger redundancies, and the December employment report, which is scheduled to be released on Friday and is the main event.
Overall, the Gold's price direction depends on how the US reports come, which could indicate the US Dollar's presence against the safe Haven Gold.
Technical Perspective
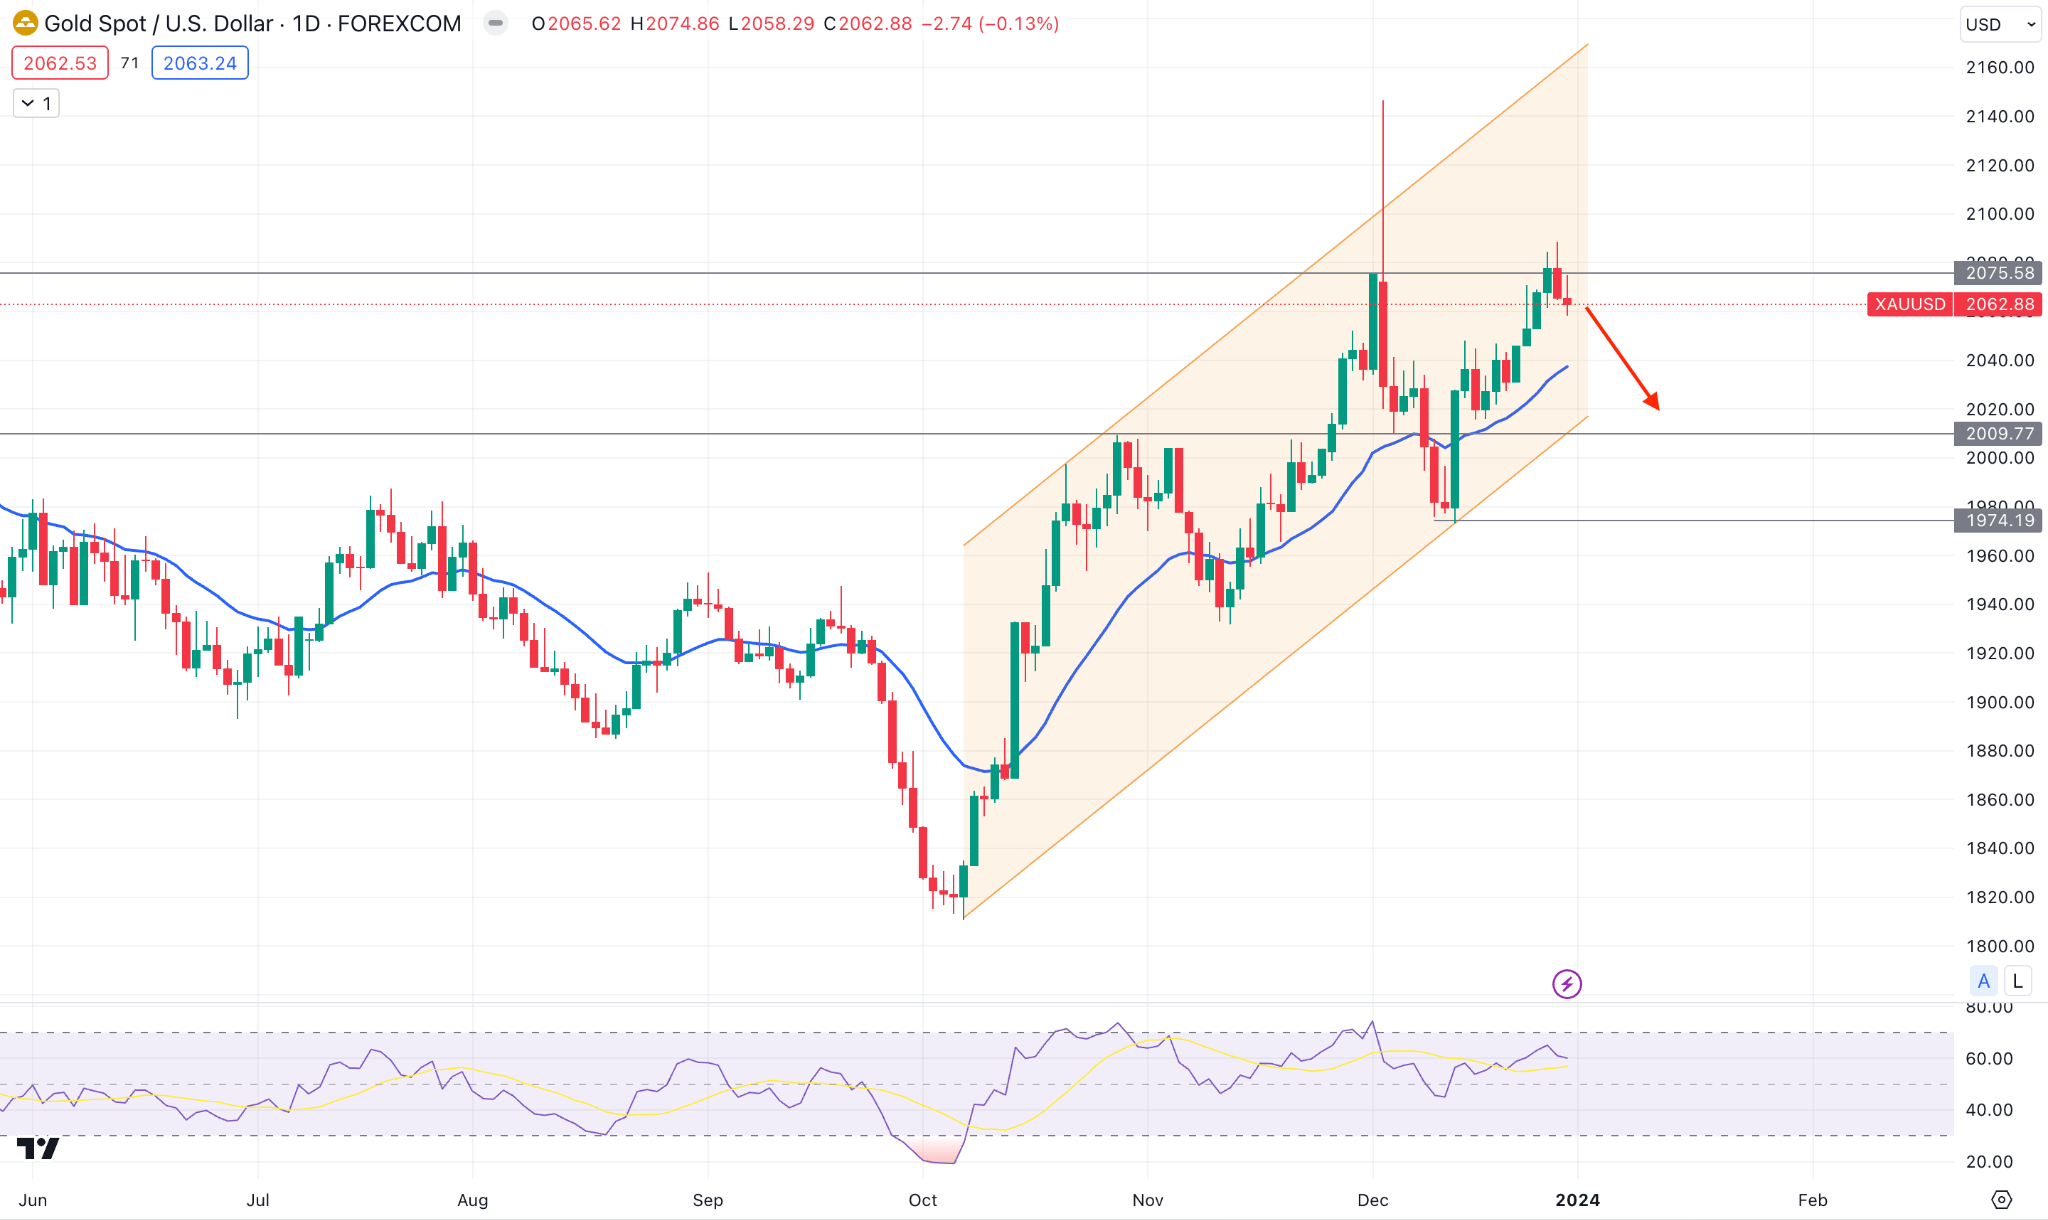
The daily XAUUSD price suggests a selling pressure due to the monthly shift, which could lower the price in the coming days. Although it the a short-term bearish opportunity, the long-term trend would be bullish as long as the price remains above the 2009.77 support level.
On the bullish side, the 2080.00 level could be the immediate barrier as buying pressure above this zone could extend the price to an all-time high.
WTI Crude Oil (USOUSD)
Fundamental Perspective
Oil prices are concluding 2023 at approximately 10% lower, following a two-year uptrend. Geopolitical tensions, production cuts, and central bank efforts to curtail inflation have contributed to this market decline, which has generated considerable volatility.
Following a 3% decline, oil prices have recently increased, particularly as more shipping companies prepare to traverse the Red Sea route. The route had been rendered inoperable by major corporations as a result of the Houthi militant group in Yemen conducting vessel targeting.
Currently, OPEC+ is engaged in a reduction of around 6 million barrels per day in output, corresponding to an estimated 6% of the worldwide supply. Nonetheless, during the initial six months of 2024, OPEC encountered a decrease in crude demand, which coincided with a decline in its worldwide market share resulting from output reductions and Angola's withdrawal as a member.
Technical Perspective
In the daily chart, the Crude Oil price trades bearish below the dynamic 20 day EMA, while the RSI shows a confluence bearish factor by remaining below the 50.00 line.
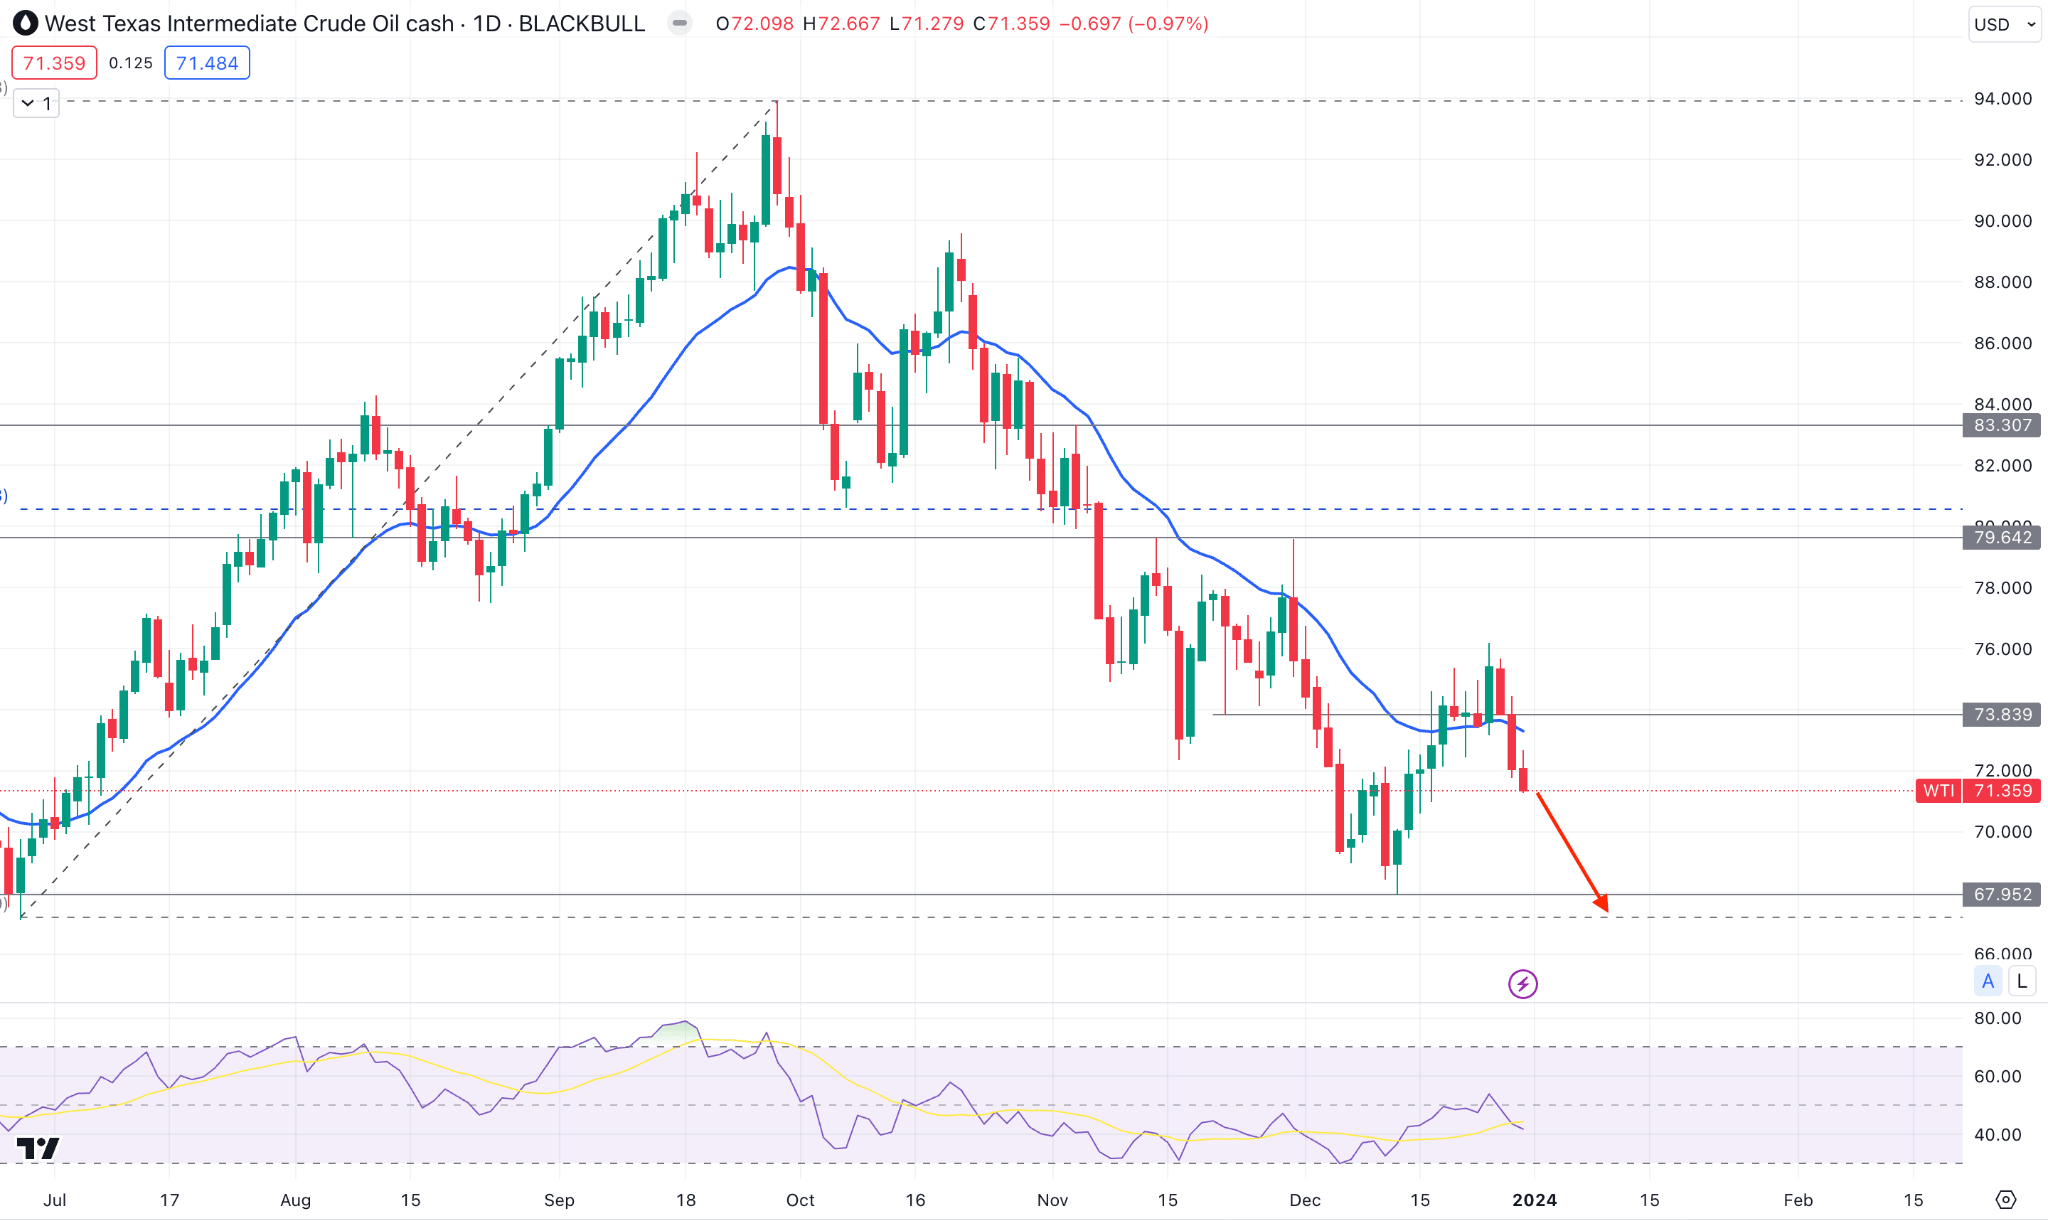
As the existing trend is bearish, a downside continuation is possible, where the primary aim is to test the 67.95 level.
On the contrary, a stable buying pressure with consolidation above the 74.00 level might increase the price towards the 80.00 area.


