


EURUSD
Fundamental Perspective
The Euro concluded the week as the least formidable competitor to the US Dollar. Despite weak demand for the US Dollar, depressing news from Europe capped the Euro's gains.
Federal Reserve chairman Powell adopted a prudently sanguine stance, proposing that interest rates may have reached their highest point before contemplating monetary tightening. While Powell did not provide an exact timeframe for interest rate adjustments, he alluded to the possibility of cuts occurring later in the year.
In the interim, the ECB decided to maintain interest rates unchanged and revised its downward growth projection for the fourth consecutive meeting. Considering the rate cut later in the year, President Christine Lagarde referenced advancements in tackling inflation-related concerns.
On the economic data, the US ISM Services PMI failed to meet expectations, although it continued to suggest growth. Moreover, the retail sales in the Euro Zone increased marginally, whereas the Producer Price Index (PPI) declined.
Investors should closely monitor the upcoming FOMC meetings, which could provide the upcoming price direction for the US Dollar Index (DXY).
Technical Perspective
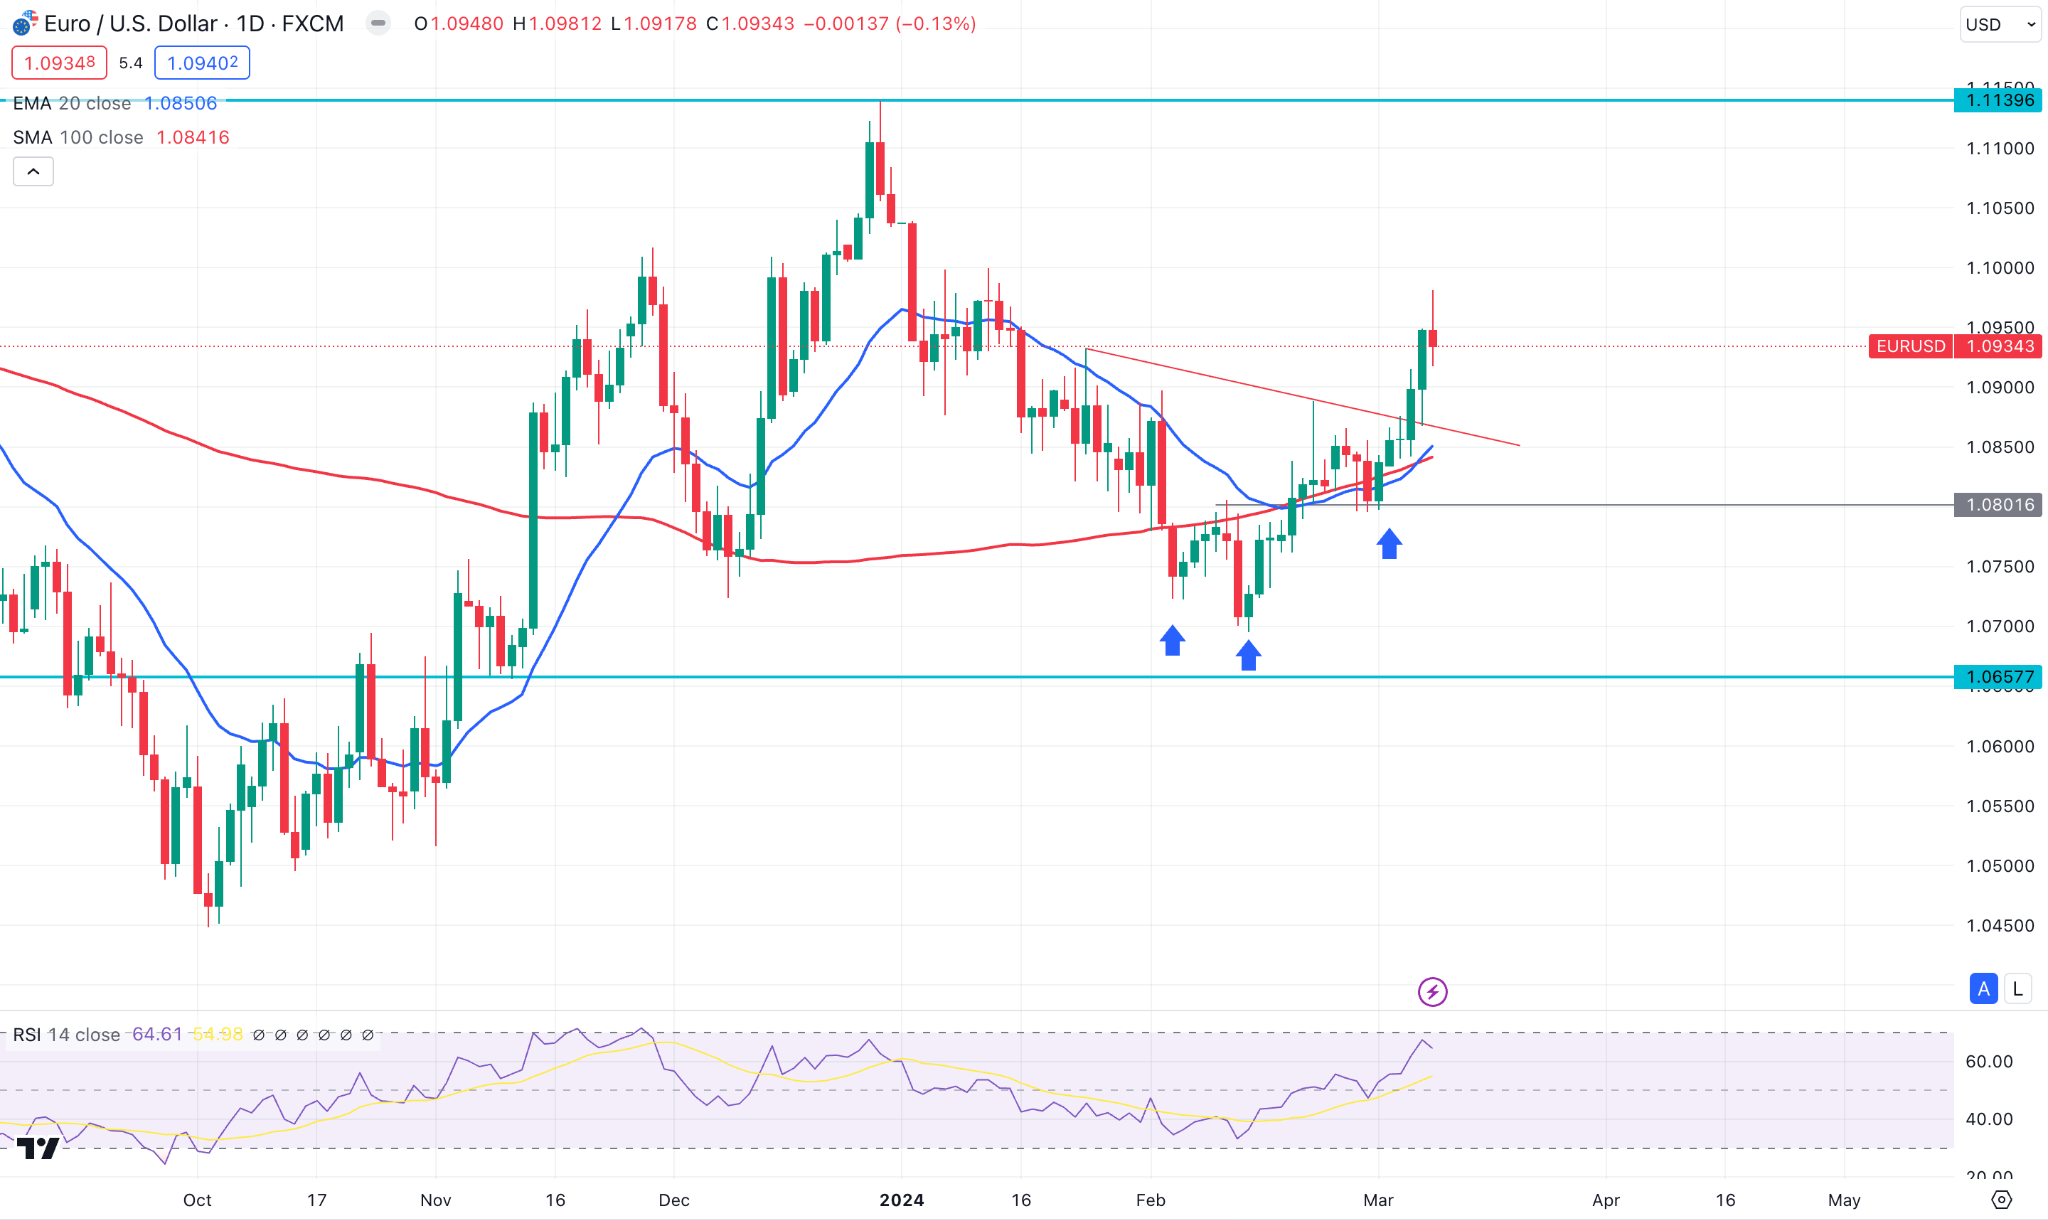
EURUSD posted a fresh bullish trend continuation signal from the weekly chart, as the recent price formed a bullish range breakout.
In the daily chart, the potential upward signal is visible from the Inverse Head and Shoulders pattern breakout, with a successful daily candle above the neckline.
Investors should closely monitor how the price corrects lower from the neckline support. A bullish rejection from the 1.0900 to 1.0850 area could be a potential long opportunity, targeting the 1.1100 level. However, a bearish pressure below the 1.0800 level with a daily candle might alter the current market structure at any time.
GBPJPY
Fundamental Perspective
Presently, the fiscal 2024 draft budget of the Japanese government is under process, amounting to the general-account expenditures of ¥112.57 trillion ($746 billion), the second-highest number ever recorded.
Significantly, the Bank of Japan (BOJ) is experiencing a surplus, which could influence the bank to change the interest rate. A possible escalation in interest rates would result in a reduction of the money supply surplus. Reducing interest rates would escalate the surplus, whereas maintaining rates would preserve the money supply.
Concerning interest rates and money supplies, the BoJ is currently in a favorable position.
On the other hand, the issuance of the labor market report in the United Kingdom is slated for Tuesday. Also, the UK will release its monthly GDP report for January, which includes industrial and trade figures, on Wednesday.
Technical Perspective
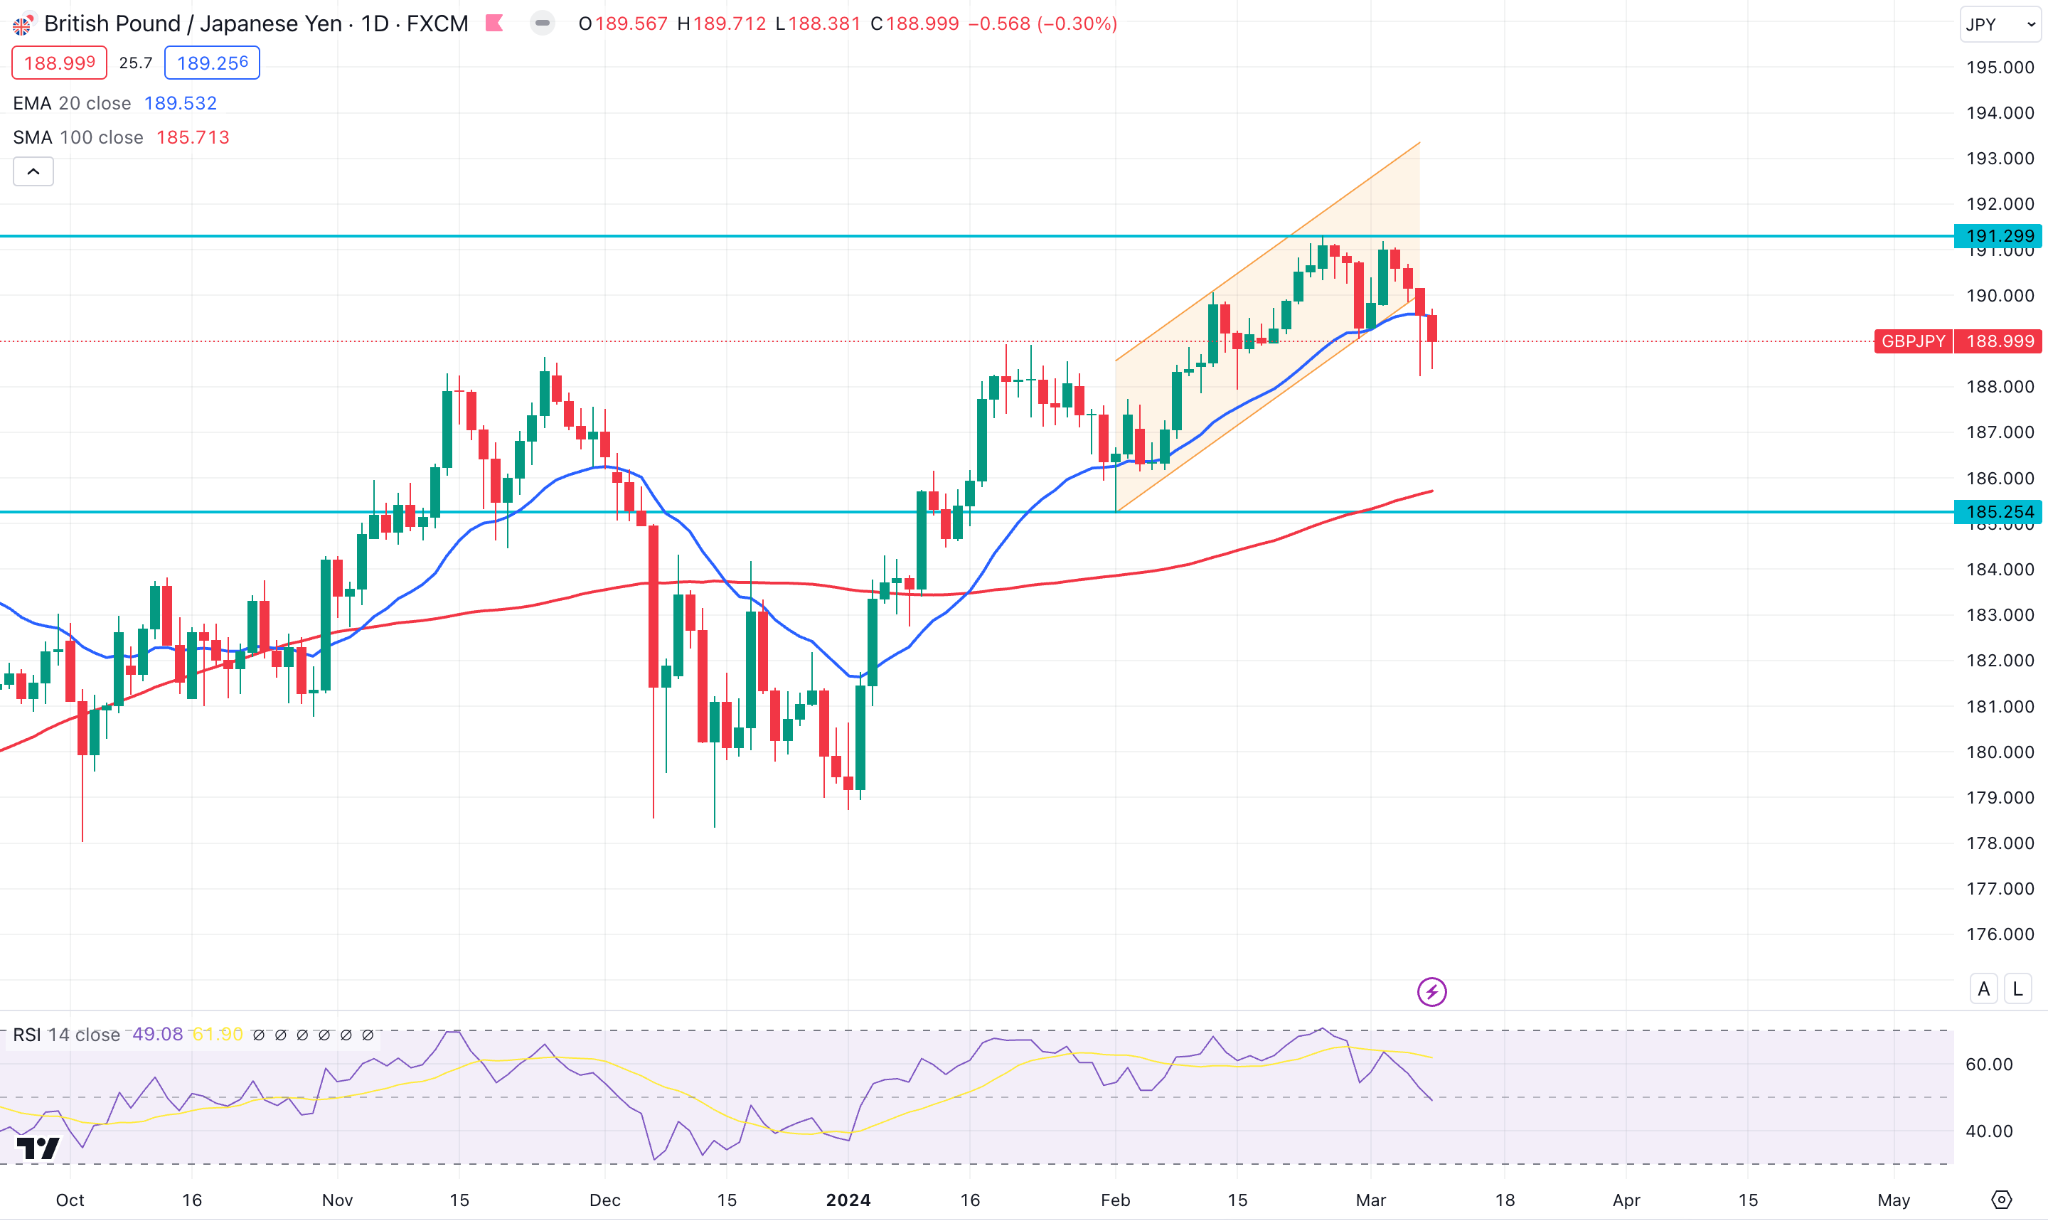
A sharp selling pressure has come in the GBPJPY price, showing a significant selling pressure in the weekly candle.
Moreover, the daily price closed below the dynamic 20 day EMA, while the 100 day SMA line is still untouched. The 14-day RSI moved to the 50.00 line after tapping to the overbought level.
In this context, an extensive downside correction is pending in this pair as long as the price trades below the dynamic 20 DMA. However, an immediate bullish recovery with a stable market above the 190.00 level could alter the current market scenario at any time.
Nasdaq 100 (NAS100)
Fundamental Perspective
The US economy has faced an increase in payrolls and the unemployment rate within a single month. Moreover, the household survey exhibited a significant lack of strength in February when compared to the establishment survey.
The report documented a rise of 334,000 unemployed individuals, bringing the cumulative number to 6.5 million. Moreover, February witnessed a significant surge of 174,000 in permanent job losses, suggesting a potential deceleration in the labor market.
In contrast, the Nonfarm Payrolls (NFP) report suggested that the job creation has been substantial. However, this discrepancy has endured for a considerable period.
For the stock market, the Nasdaq 100 reported another new high on Friday before closing lower with a 1.69%. Among upcoming crucial releases, earnings reports from Oracle Corporation (ORCL), Lennar Corporation (LEN), Adobe Inc (ADBE), and Dollar General Corporation (DG) are significant.
Technical Perspective
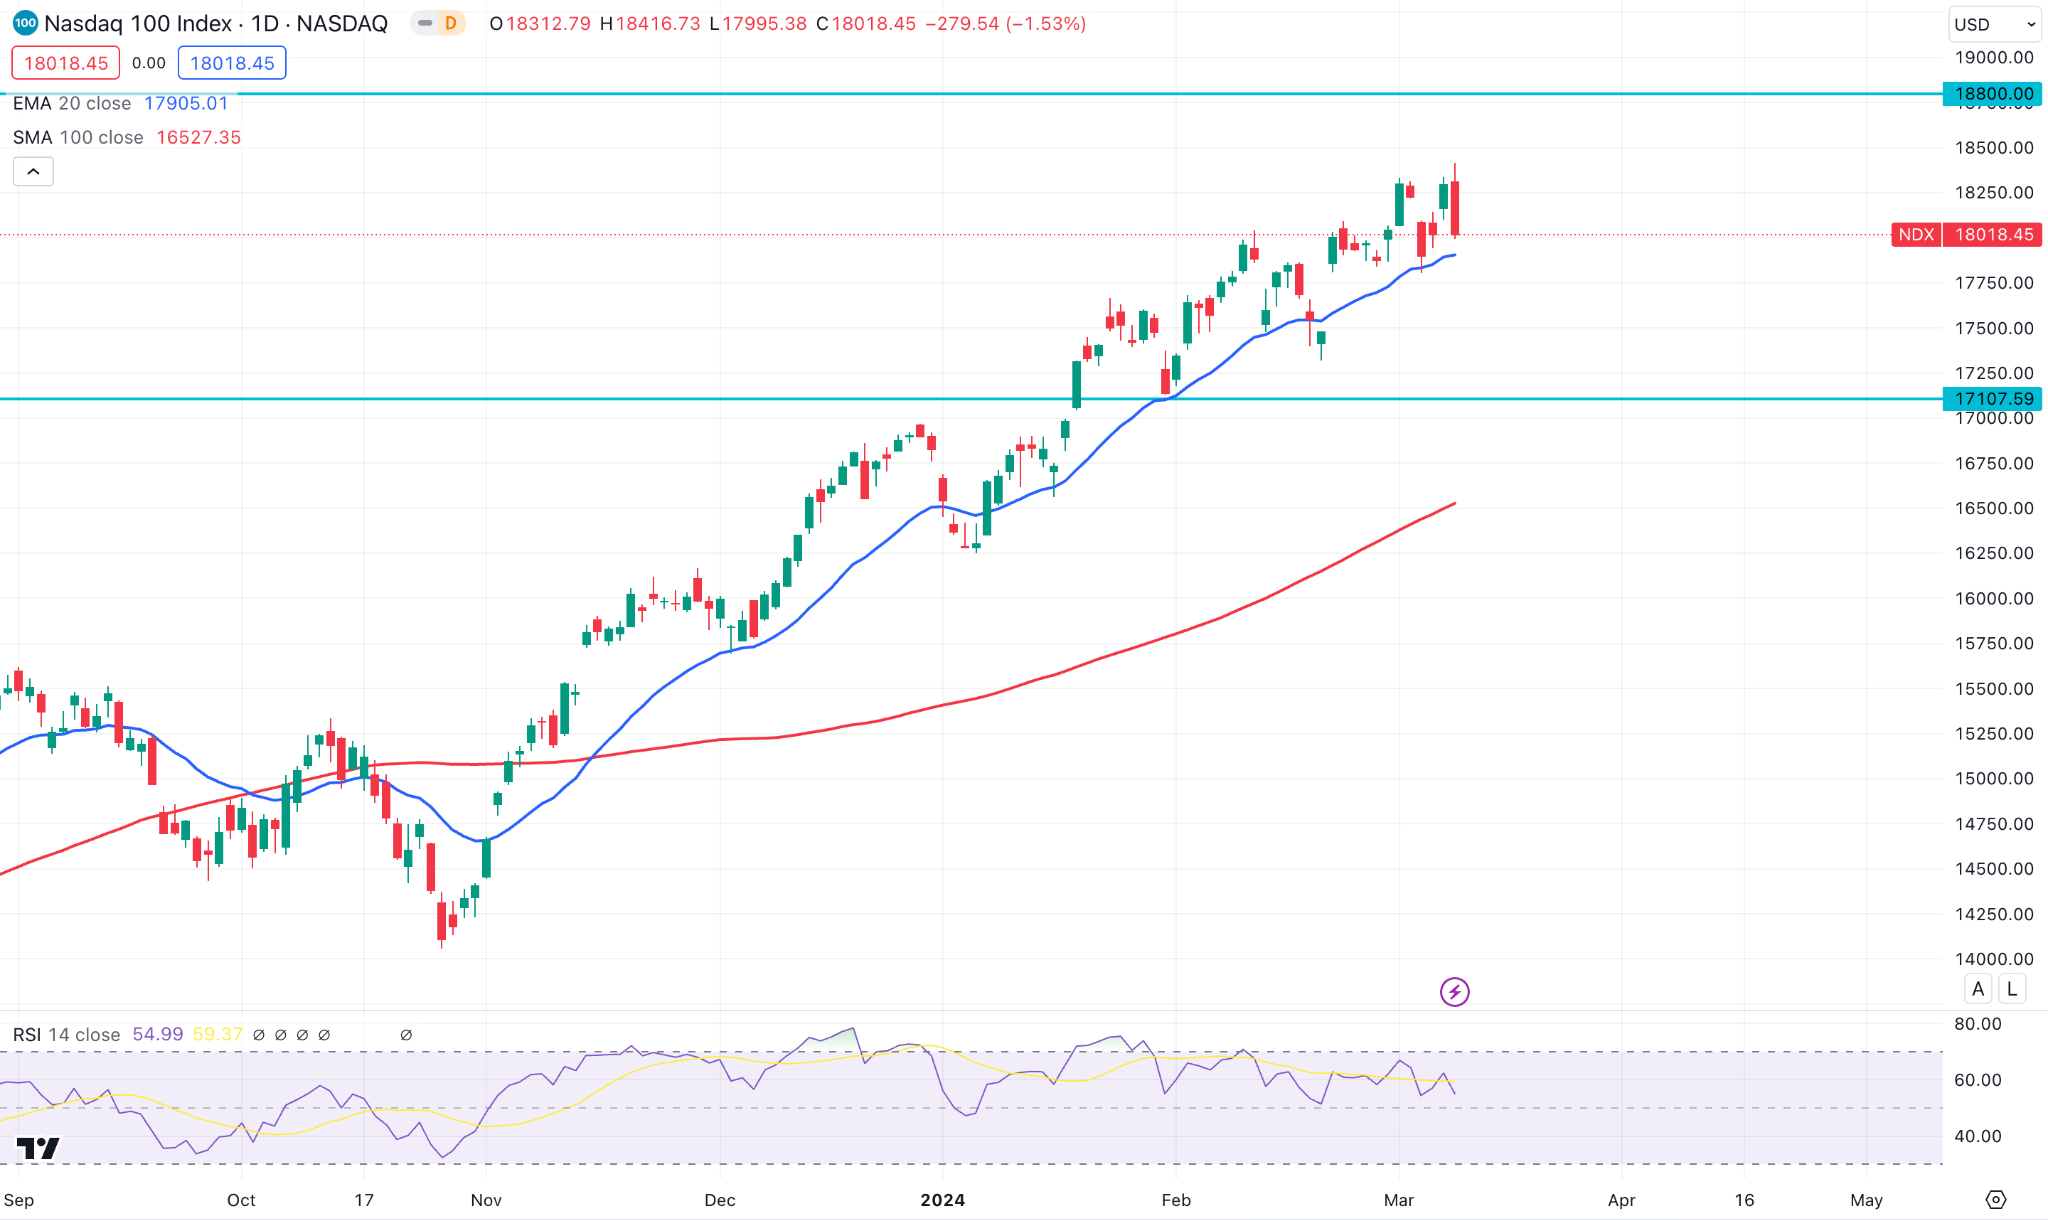
In the weekly NASDAQ 100 chart, the latest candle closed bearish but failed to overcome the last week’s low.
However, the daily price still trades above the dynamic 20 day SMA line, with no sign of a trend reversal. In that case, any bullish signal in this index from the dynamic line could be a long opportunity, targeting the 18800.00 level in the coming days.
On the other hand, a deeper discount could come towards the dynamic 100 day SMA line, but a solid break below this level is needed before forming a trend reversal.
S&P500 (SPX500)
Fundamental Perspective
The stock market, as gauged by the S&P 500 index (SPX), reached all-time highs once more last week. A gap was created on the SPX chart due to a customary single-day pullback, which was quickly filled the following day.
Low levels of equity-only put-call ratios continue to be a bullish sign for equities. A new relative low was reached for the standard ratio, whereas the weighted level has just reached its lowest point since November 2021. While there has been a marginal increase since then, substantial surges in these ratios would be required to indicate bearishness in the stock market.
A low Cboe Volatility Index (VIX) level is customarily regarded as a positive indicator for stock prices. A VIX increase is typically predictive of impending stock market difficulties. With upward slopes on the term structures of VIX futures and the Cboe Volatility Index, volatility derivatives favor equities.
Additionally, bullish sentiment is further supported by the fact that VIX futures are trading at a substantial premium to VIX.
Technical Perspective
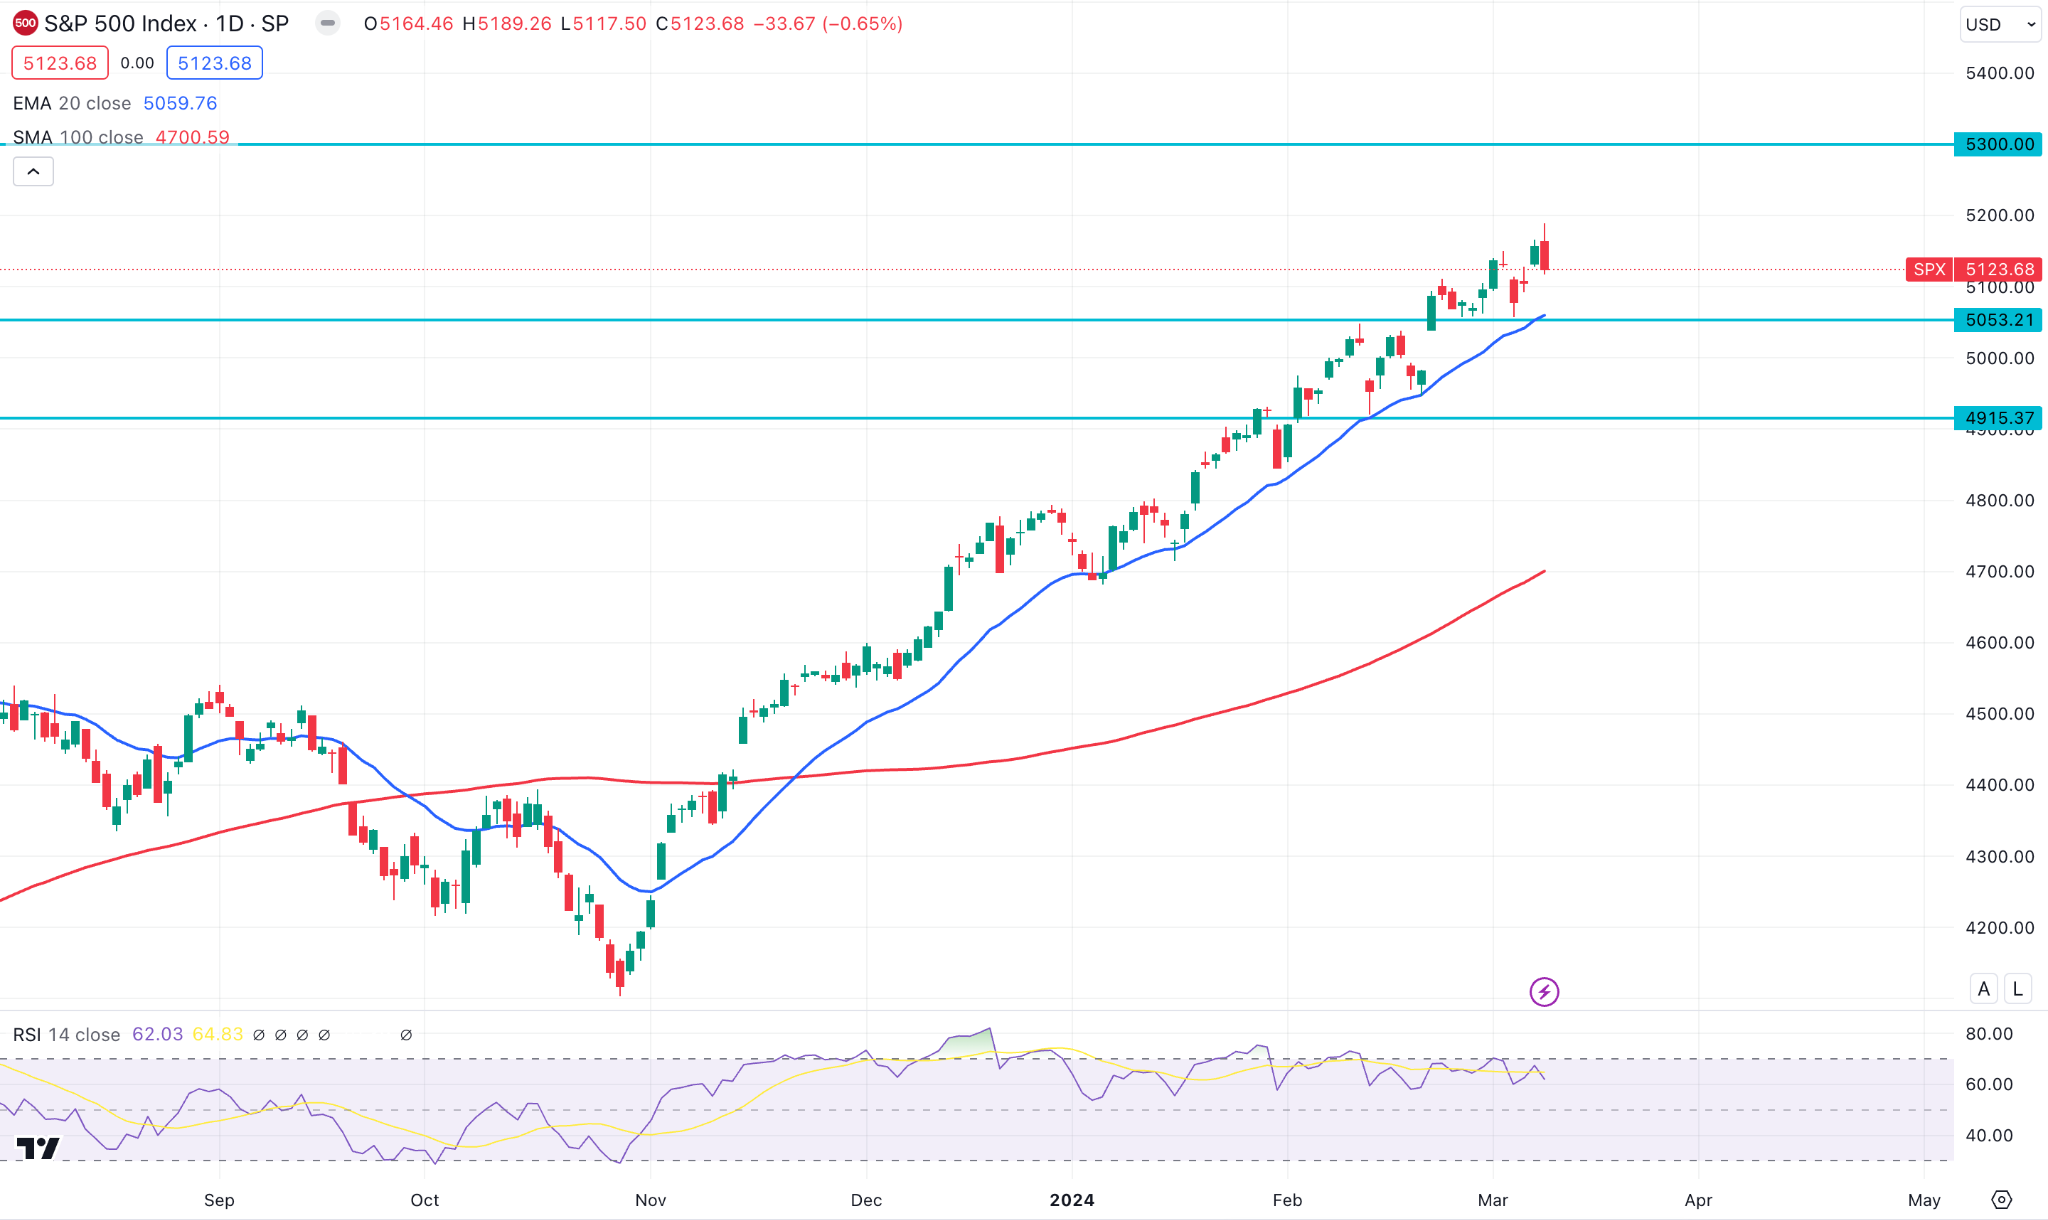
The S&P 500 weekly candle closed as an indecision bar, suggesting that more clues are needed before anticipating a trend. As the current market trend is bullish, an upward continuation is potent as long as the price trades above the dynamic 20-day EMA line.
On the bullish side, an additional bullish rejection from the near-term level could test the 5300.00 level. However, a successful break below the 5053.21 support level could be a strong reversal opportunity towards the dynamic 100-day SMA line.
Hang Seng Index (HK50)
Fundamental Perspective
The HK50 ended a corrective week, while the most recent candle on Friday was positive. This increase ensued after a lackluster session the day before.
PBoC governor Pan Gongsheng of China stated earlier in the week that the country aims to optimize monetary policy efficacy while maintaining reasonable yuan stability. Additionally, he hypothesized that the central bank could reduce the RRR further, given that it has already done so twice in 2023.
Despite the progress made on Friday, the index experienced its second consecutive weekly decline, diminishing by 1.4%. After the publication of China's CPI and PPI data, ongoing tensions over US-China chip access and a proposed US bill targeting biotech firms, could keep the market volatile.
Technical Perspective
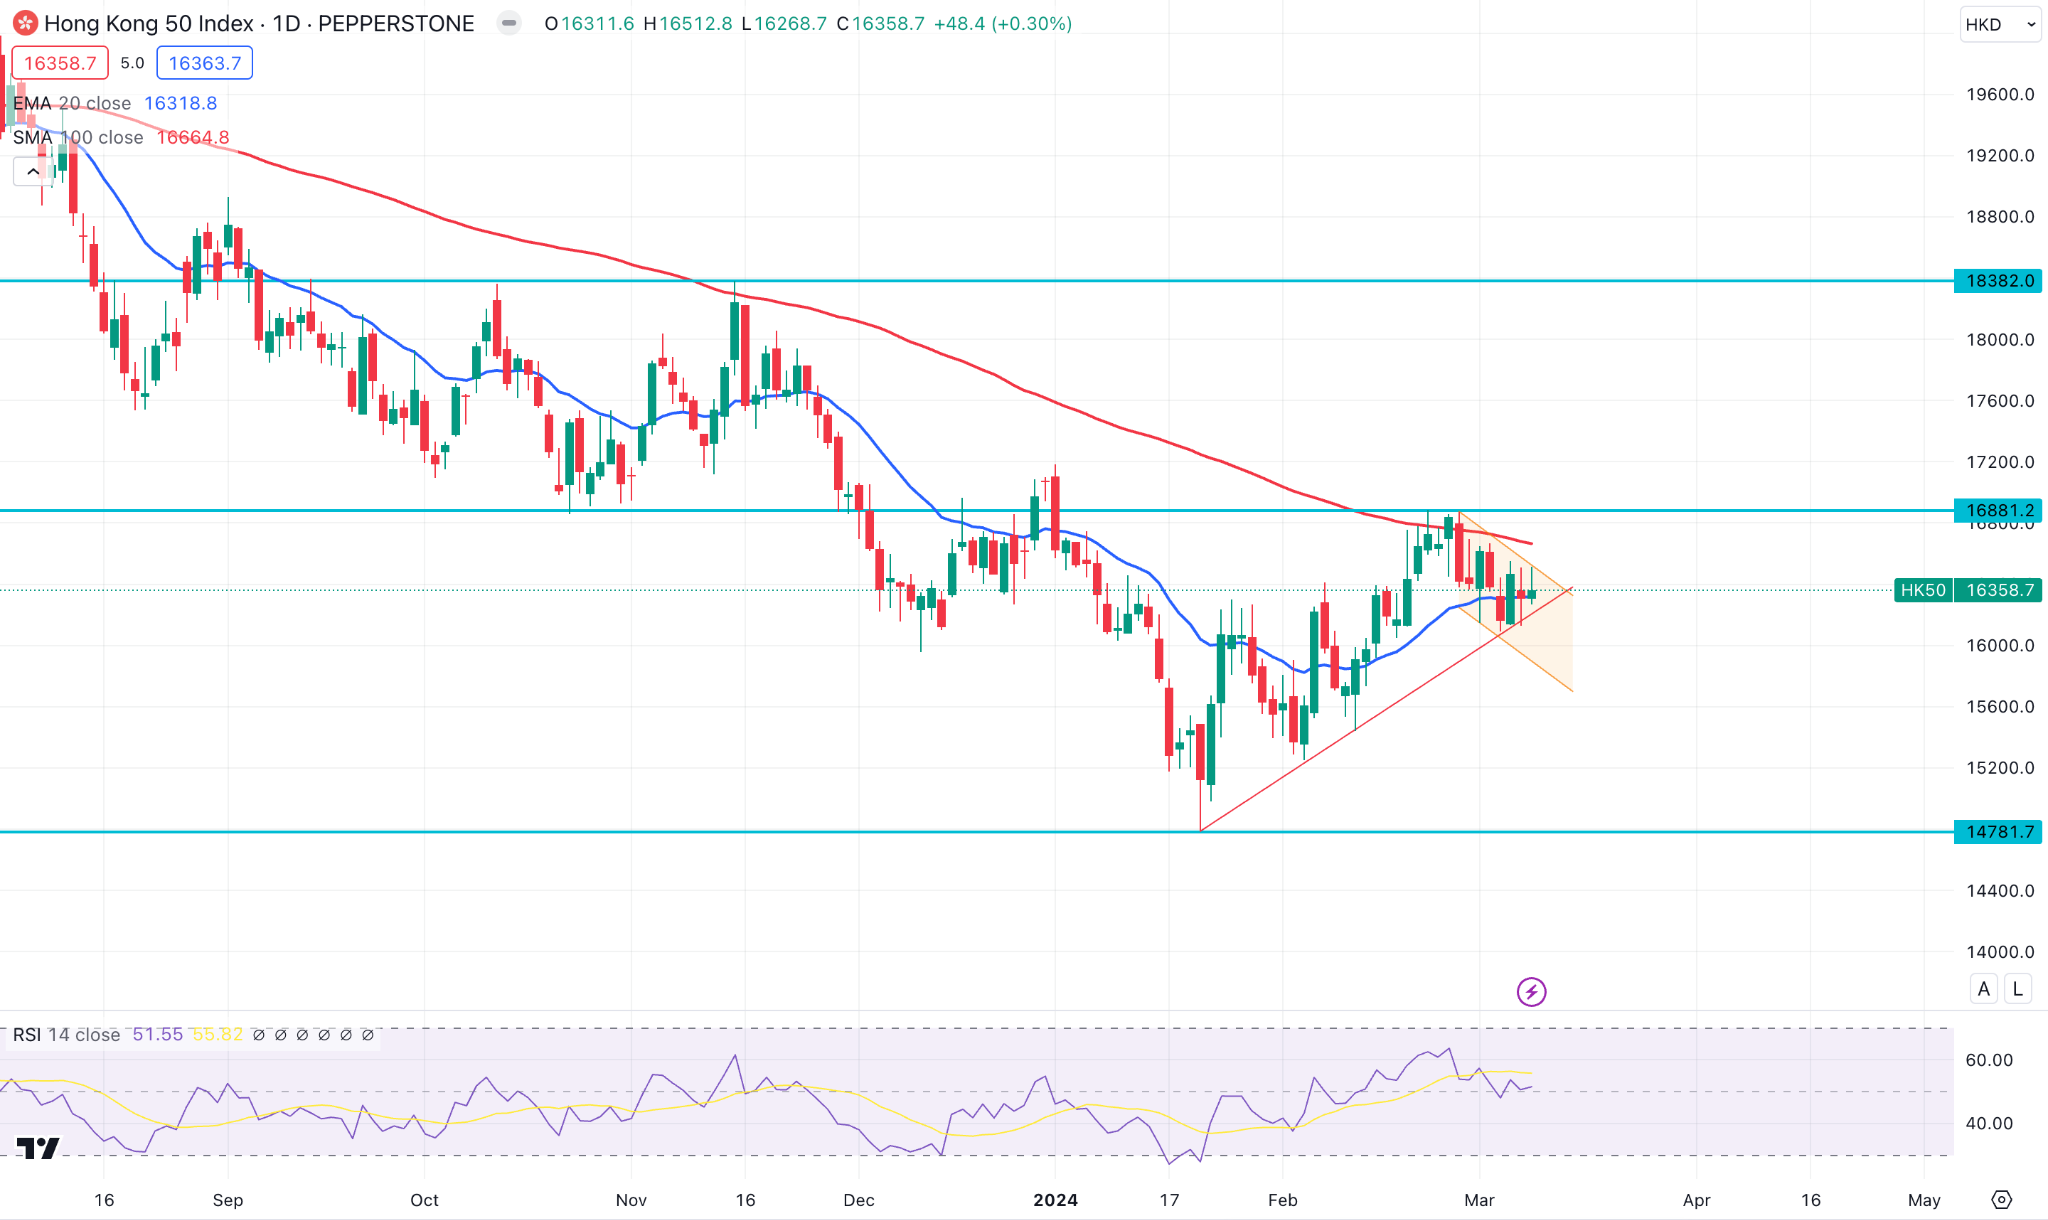
The weekly HK50 showed a bearish close after an inside bar, which could be a potential downside signal for this week.
However, the daily price trades above the dynamic 20-day EMA but below the 100-day SMA, which signals a corrective market momentum.
Based on this structure, a descending channel breakout with a stable market above the dynamic 100-day SMA could be a valid long signal targeting the 11800.00 resistance level. However, a high probable short opportunity might come after having a bearish daily close below the dynamic 20 DMA.
Bitcoin (BTCUSD)
Fundamental Perspective
Cathie Wood asserts that introducing the first spot exchange-traded funds (ETFs) has brought about a substantial paradigm shift for Bitcoin. While addressing a mainstream media audience, she reaffirmed her unwavering conviction regarding the trajectory of the preeminent cryptocurrency.
Wood underscored the tremendous attention and impetus produced by the spot ETFs, which prompted even ARK to reconsider its optimistic position on Bitcoin.
The corporation had previously established a price objective of $1 million per bitcoin by 2030. Nevertheless, the environment has changed.
She elaborated, referring to the regulatory approval from the U.S. Securities and Exchange Commission, "That target was reached prior to the SEC giving us the go-ahead, which I consider to be a significant turning point, and it has accelerated the schedule."
Given these recent developments, the initial objective of $1 million by 2030 now seems excessively pessimistic.
Technical Perspective
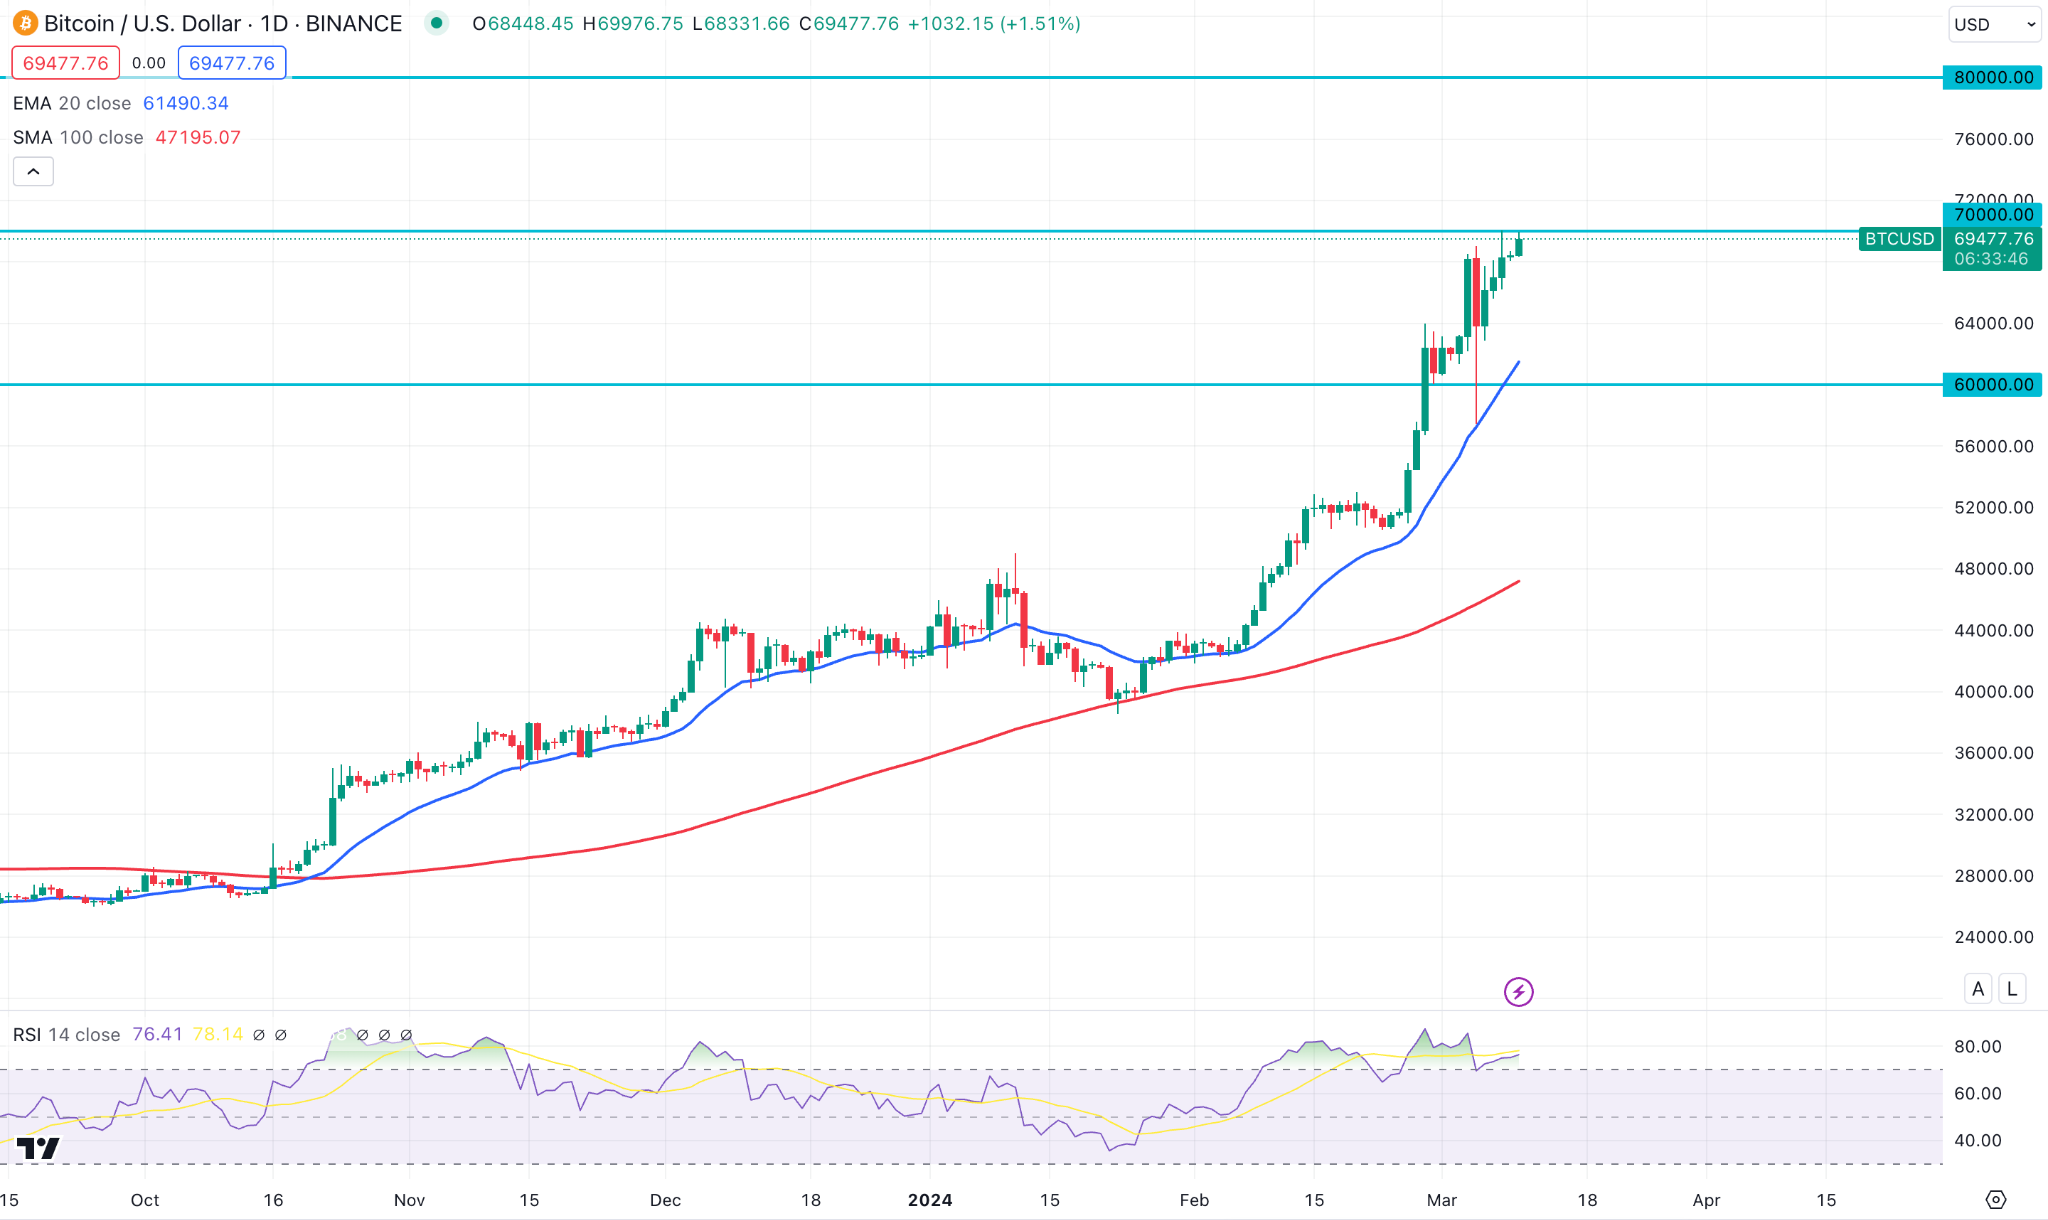
The latest weekly BTCUSD price showed massive buyers' presence in the market, suggesting a strong continuation signal in the coming days.
In terms of daily price, the 70,000.00 level is the crucial level to look at. A solid bullish break above this line could be a strong bullish signal in this pair, targeting the 80,000.00 level. However, any downside correction could be a long signal from the lower price until the price reaches the 60,000.00 psychological line.
Ethereum (ETHUSD)
Fundamental Perspective
As per the findings of IntoTheBlock, there has been a significant increase in network fees on the Ethereum network, which has not been observed since May 2022.
The principal catalyst for this surge is the growing speculative attention towards meme tokens, an emerging phenomenon that has recently garnered considerable momentum.
As a result of this surge in speculation, Ethereum has experienced its greatest transaction fees in nearly two years. In the previous week, ETH network fees surpassed $190 million, representing an annualized rate of over $10 billion for the first time since the beginning of 2022.
Furthermore, the fee-burn mechanism implemented by Ethereum has led to an approximate 33,000 ETH reduction in supply, equivalent to approximately $125 million.
Although some users have benefited from the increase in fees, it has decreased the accessibility of the network for the majority. In the past week, the average transaction fee on the mainnet of Ethereum ascended to $28, rendering specific types of transactions unfeasible.
Technical Perspective
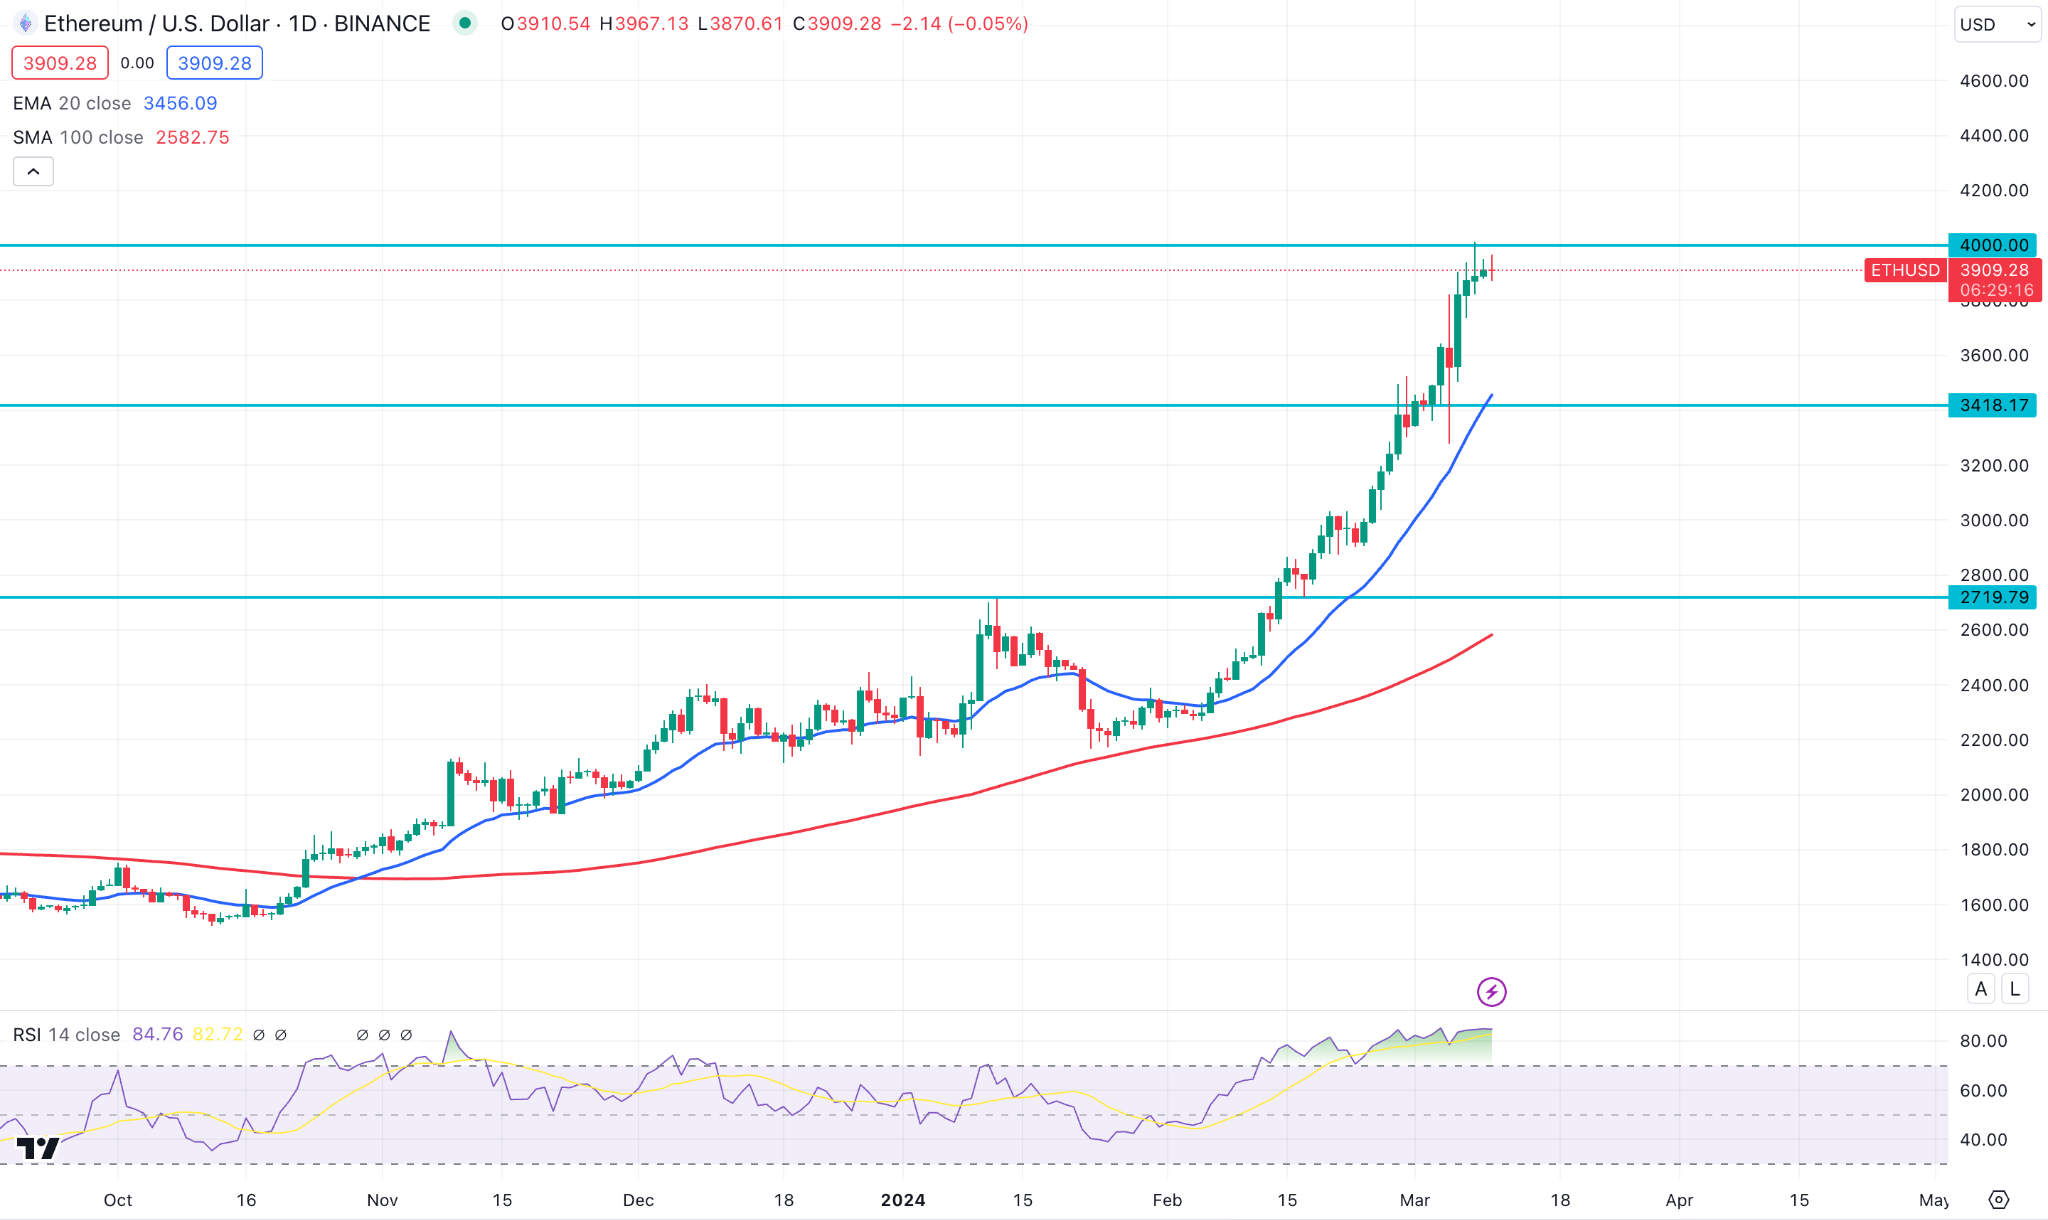
Ethereum (ETH) price reached the 4000.00 psychological level, with 5 consecutive bullish weekly closes.
In the coming days, investors should monitor how the price reacts in the 4000.00 psychological line. A daily candle above this level could increase the price towards the 5000.00 level.
On the other hand, a downside correction is pending, where the primary aim is to test the 3418.18 static support level.
Tesla Stock (TSLA)
Fundamental Perspective
Tesla stock (TSLA) peaked at $414 in early November 2021 but has since been entangled in a turbulent decline. Tesla is confronted with formidable obstacles in the form of headwinds that impede its path to new heights.
In prior earnings calls this year, even CEO Elon Musk has expressed concern regarding the effects of rising interest rates. However, individuals or entities with a minimum investment horizon of five years may find the current decline in the stock price to be an enticing opportunity to purchase.
The considerable untapped potential of Tesla in the electric vehicle (EV) sector is substantiated by its recent delivery of 1.8 million vehicles, a negligible proportion of the overall car sales.
Moreover, Tesla is also developing potentially lucrative revenue streams via its self-driving vehicle software and artificial intelligence capabilities. Notwithstanding transient challenges, investors who exercise tenacity and retain their Tesla shares will probably achieve ultimate success.
Technical Perspective
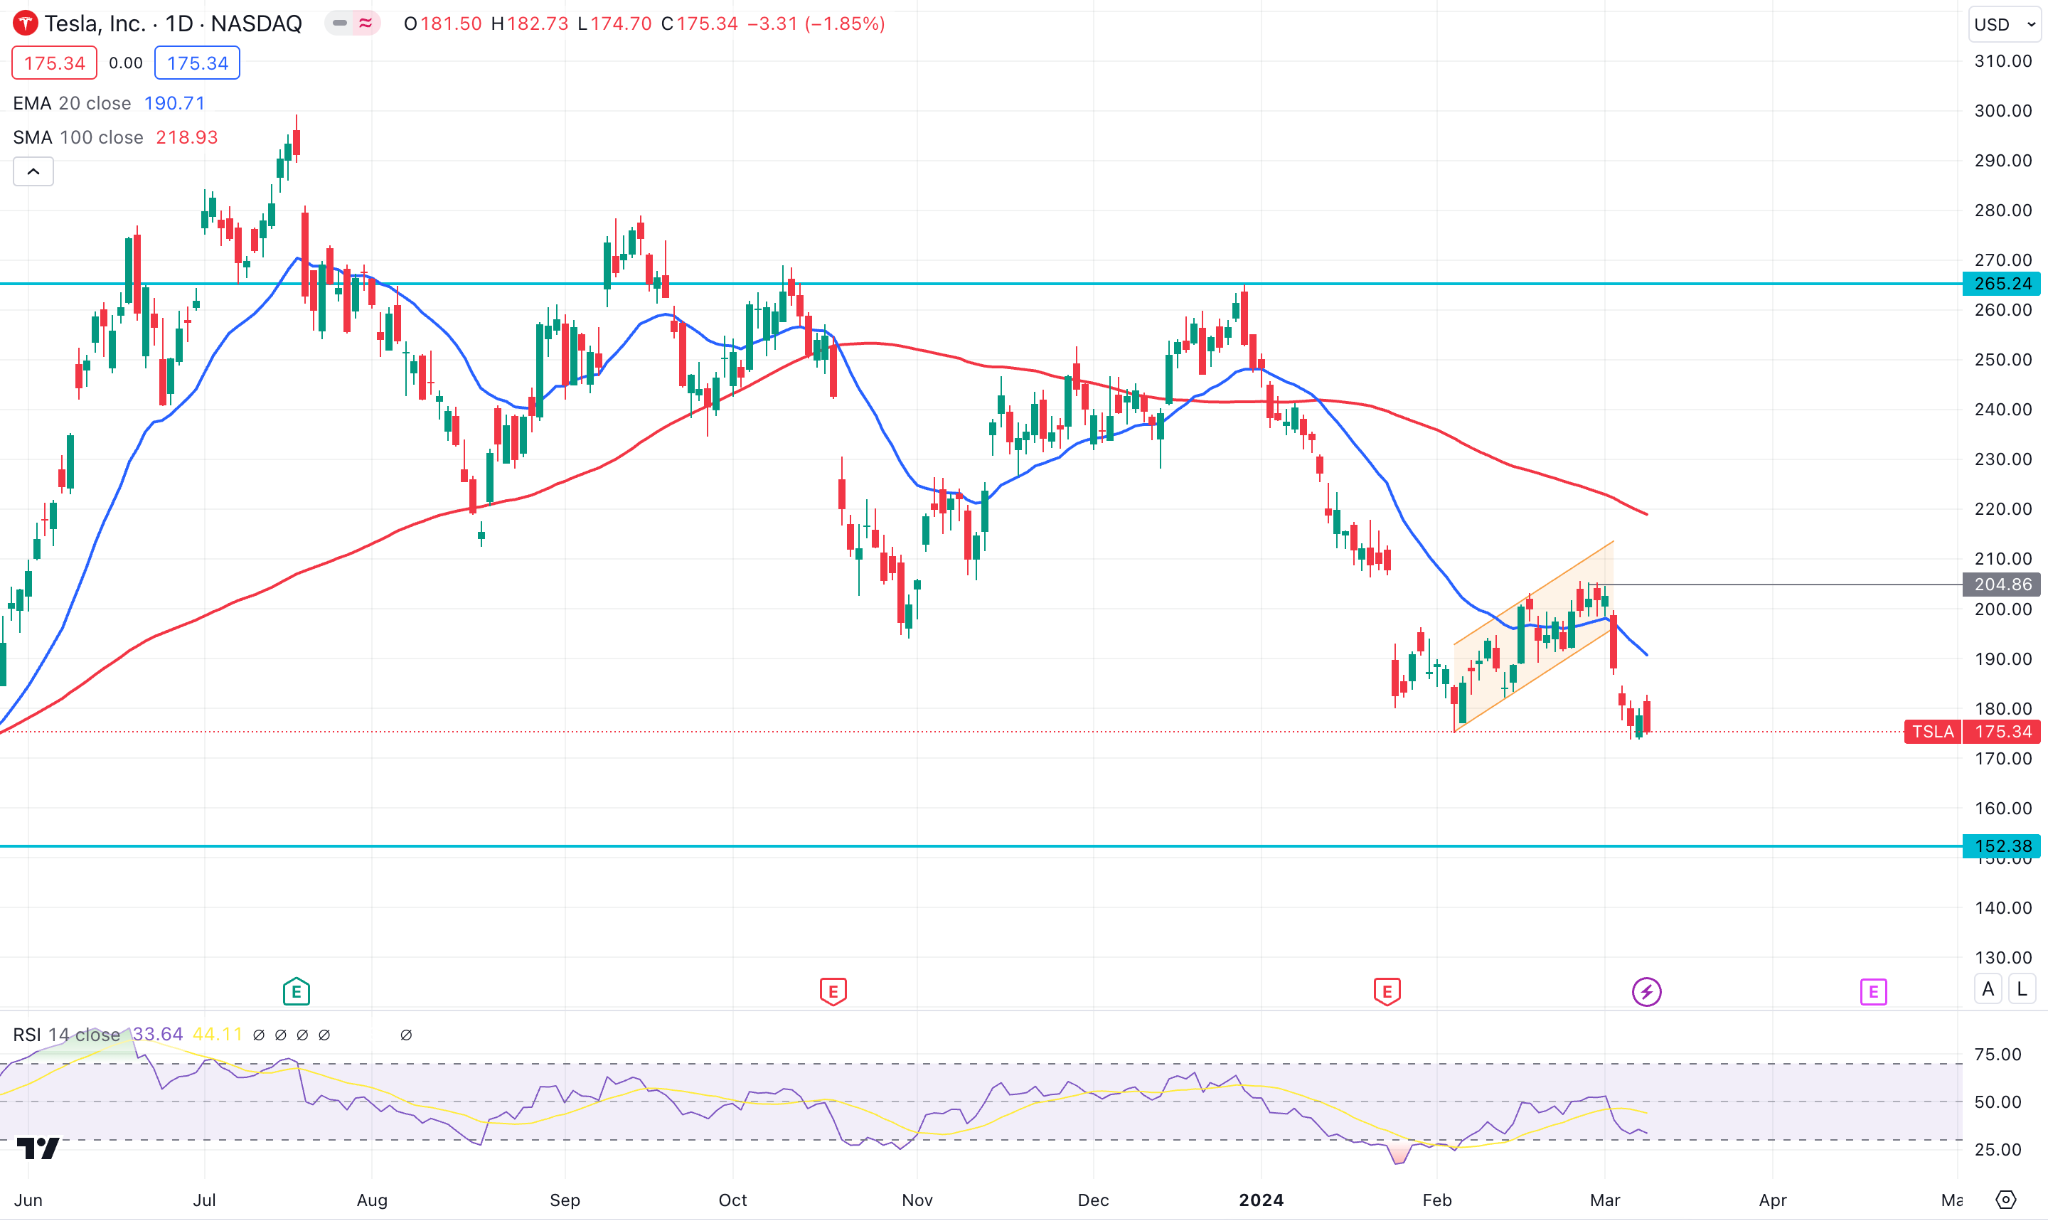
TSLA stock showed extensive selling pressure last week, suggesting the seller’s presence in the market.
In the daily chart, an ascending channel breakout with a stable bearish pressure below the dynamic 20-day EMA line could be a downside continuation signal. In this context, a bearish rejection from the 187.98 to 205.00 zone could be a valid short signal.
However, a strong bullish reversal from the 205.00 level could eliminate the bearish momentum and signal a bullish continuation.
Gold (XAUUSD)
Fundamental Perspective
Following a robust upward trend, gold continued its favorable momentum as the week began.
Tuesday's US data revealed that the ISM Services PMI for February fell marginally from 53.4 in January to 52.6. Inflation-indicating the Prices Paid Index experienced a decline from 64 to 58.6, whereas the Employment Index declined to 48.
Wednesday, Fed President Jerome Powell abstained from providing a specific timeframe for policy adjustments. But he did not exclude the possibility of a June rate cut. This dovish sentiment incited risk flows, which aided in the general frailty of the USD and bolstered the ascent of gold.
On the other hand, China exceeded market expectations by disclosing a wider trade surplus for January-February on Thursday. This information, in conjunction with the 10-year US yield falling below 4.1%, stimulated the buying pressure in XAUUSD.
In the upcoming data, the Federal Funds rate could be the most significant event to look at, where an early rate cut could initiate a US Dollar’s gain as “Buy on rumor and sell on actual”.
Technical Perspective
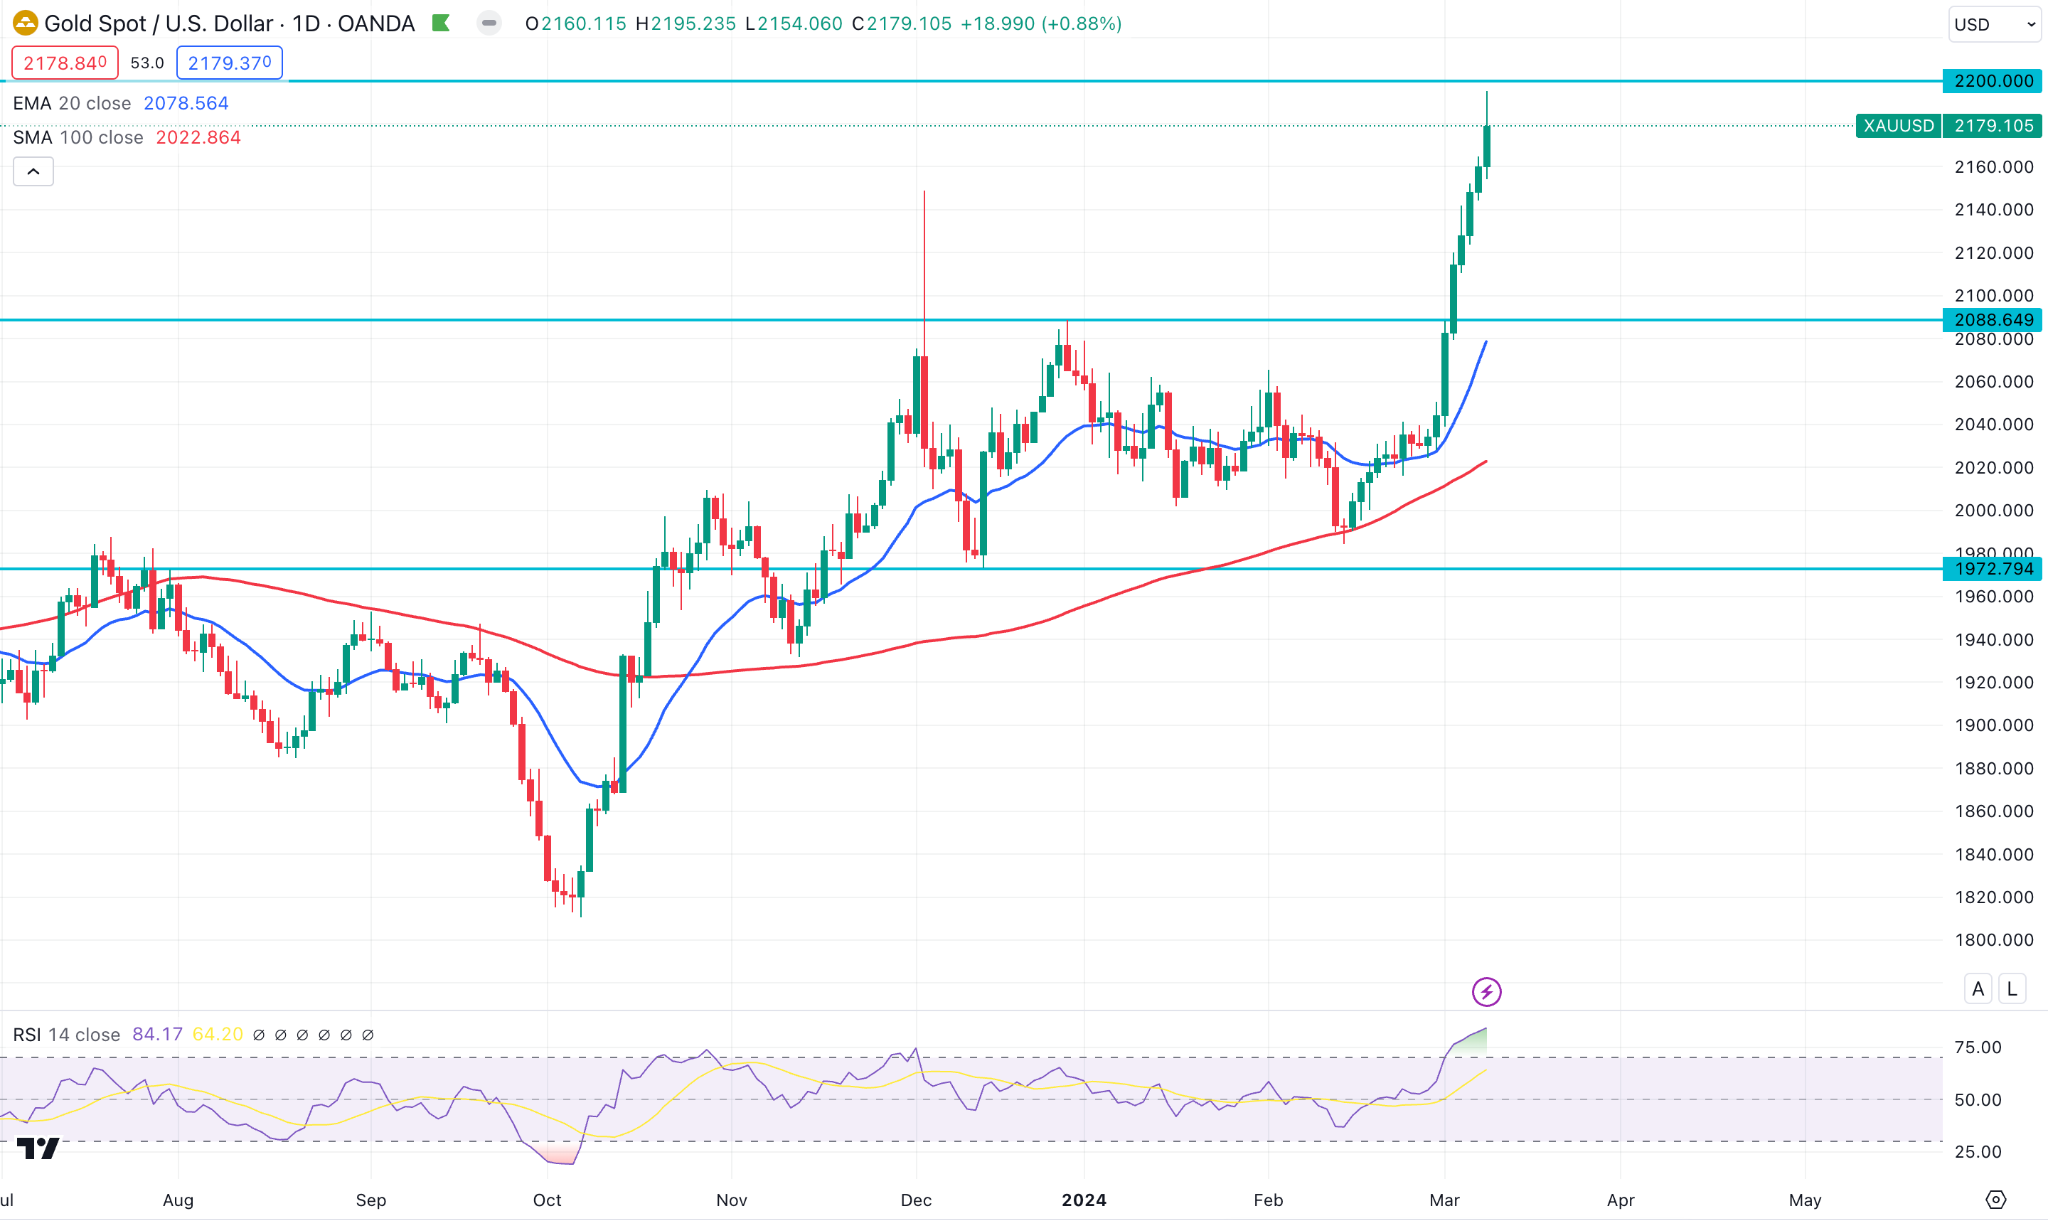
The XAUUSD price posted the largest weekly gain of the year, following the ongoing bullish pressure. However, the recent price hovers below the 2200.00 level, which would be a crucial price zone to look at.
Based on the daily outlook, an upward continuation is potent, where a daily close above the 2200.00 level could extend the momentum toward the 2230.00 level. However, a failure to break this line with a bearish exhaustion could alter the current momentum at any time.
WTI Crude Oil (USOUSD)
Fundamental Perspective
As a result of a decline in Russian crude oil exports, crude oil prices have been supported. According to data analyzed by Bloomberg on Vortexa, Russian crude exports decreased by approximately 230,000 barrels per day (bpd) during the week ending March 3.
Following OPEC+'s announcement on Sunday that it would extend ongoing crude production limits of around 2 million bpd until the end of June, crude prices gained support. After the second quarter, the group plans to resume crude production cuts "subject to market conditions progressively."
In contrast, OPEC's crude output increased by 110,000 bpd to 26.680 million bpd in February, as Iraq and the UAE pumped more than their mandates.
According to calculations by Bloomberg, Russia processed 5.44 million bpd of crude oil between February 15 and February 28, exceeding levels from the first half of the month by over 4%. Although subject to Ukrainian drone attacks on Russian oil processing and storage facilities, the infrastructure has since been restored to nearly full operational capacity.
Technical Perspective
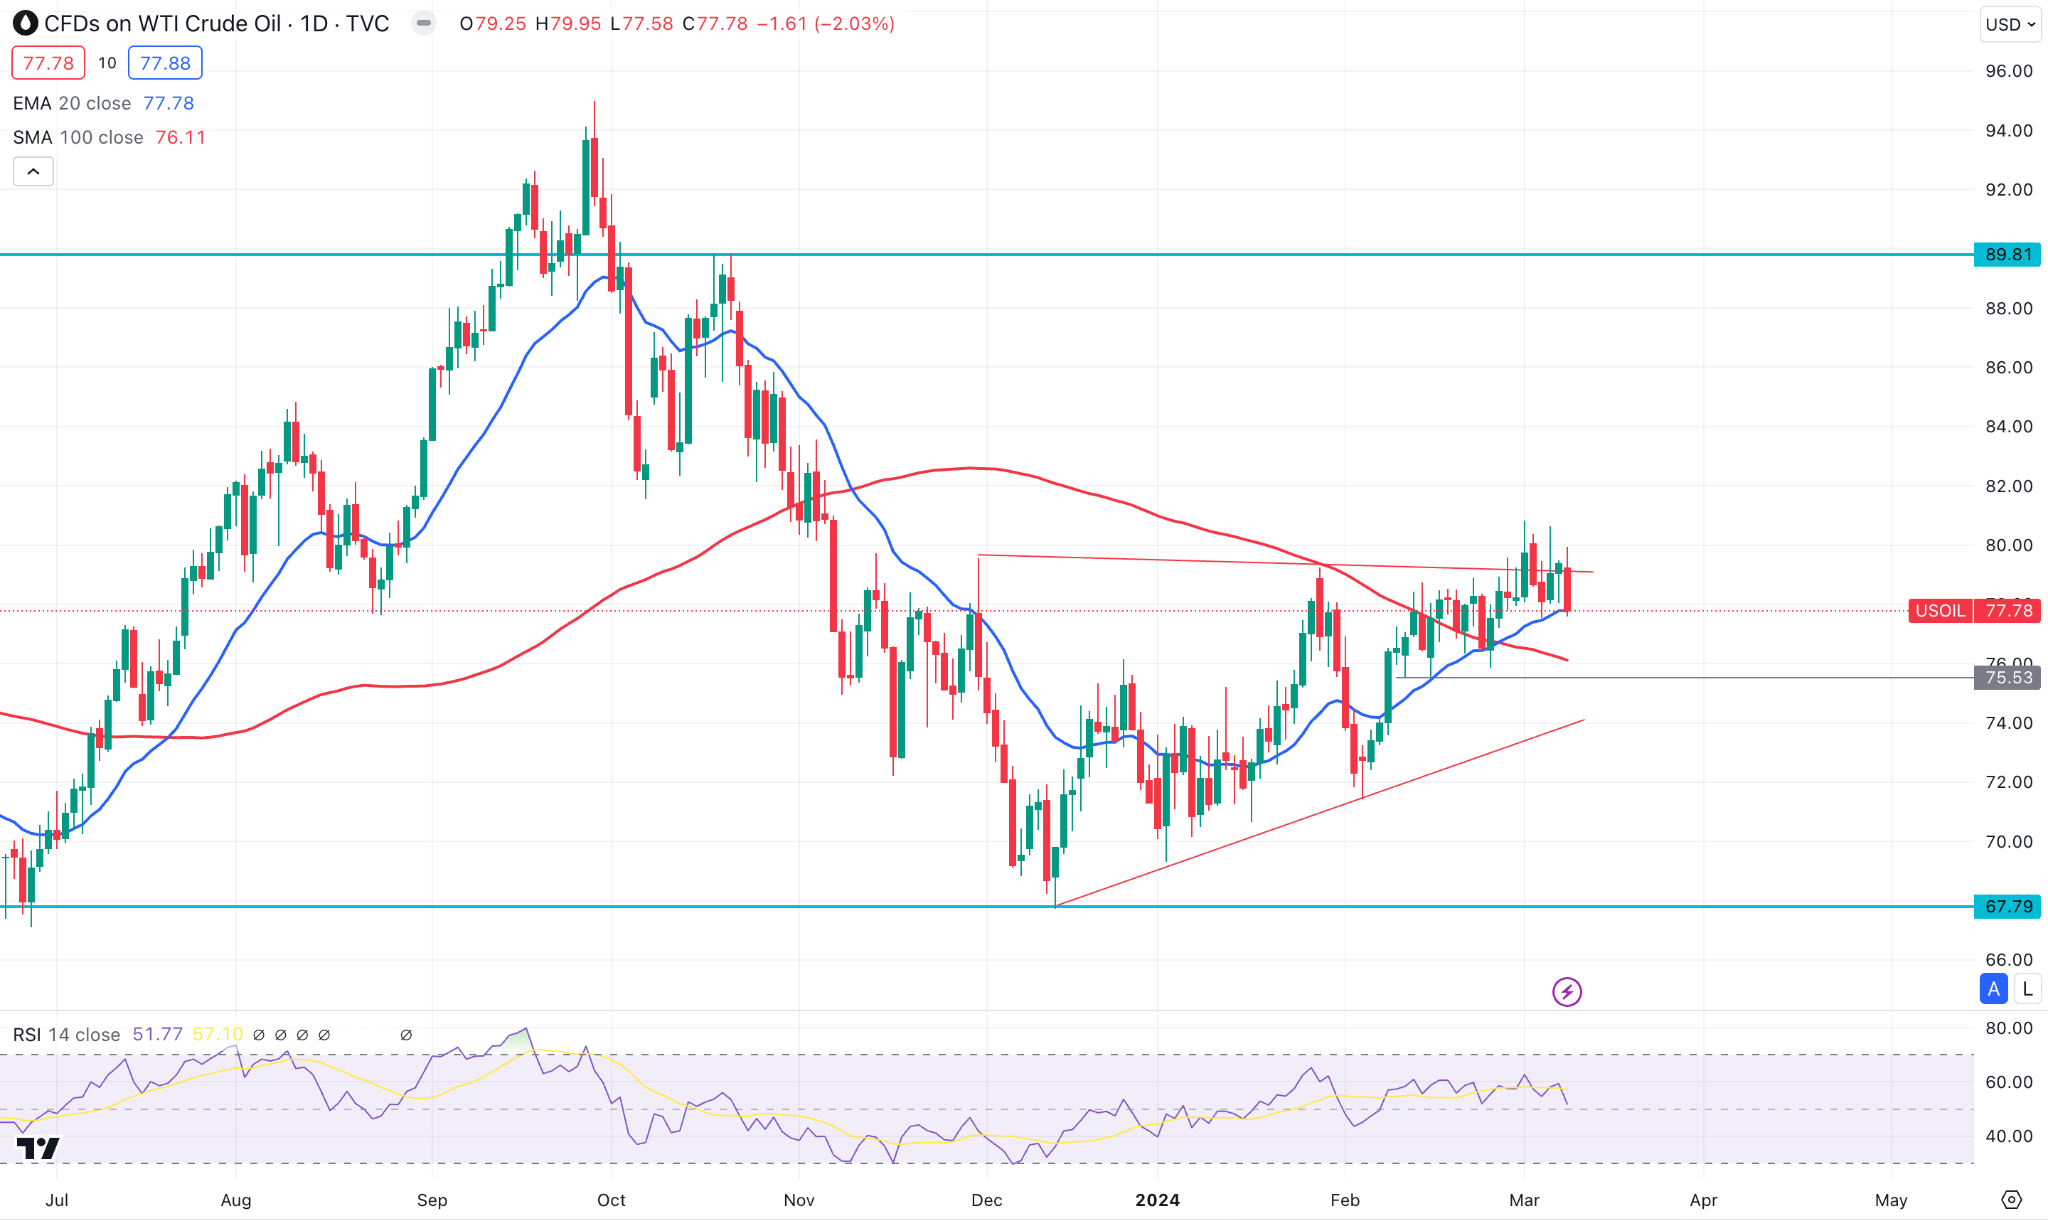
The WTI crude price trades within a symmetrical triangle formation in the daily chart, where the dynamic 20-day EMA is the immediate support. Moreover, the 100-day SMA moved below the current price, considering the confluence support to bulls.
In that case, a daily close above the 80.00 line could be a potential long opportunity, targeting the 89.81 resistance level.


