Oil prices are highly volatile, with the potential for large price swings driven by a complex interplay of supply, demand, and market sentiment. For traders and investors, understanding the key fundamental and technical drivers behind oil price movements provides critical insight into identifying opportunities and forecasting potential price trends.
Careful monitoring of key indicators such as OPEC policy, U.S. shale production, global demand growth, speculative market positioning, and technical indicators can help inform entry, exit and risk management decisions.
With myriad influences constantly reshaping the near- and longer-term outlook, it is essential to quickly adapt trading strategies and risk mitigation tactics. A comprehensive framework that takes into account a wide range of supply and demand dynamics, market psychology and technical price signals enables informed analysis.
For traders seeking to capitalize on volatility or investors managing oil-related assets, insight into the key factors driving oil prices is essential to navigating the commodity's turbulent price swings.
This report provides an overview of the key fundamental, sentiment and technical factors affecting oil. Careful analysis of these various forces shaping the outlook can help inform trading strategies.
Supply Side Factors
A. OPEC production quotas
Cuts to support prices, increases to capture market share
As a major oil producer, OPEC has significant influence over global supply and prices through its production quotas. Cutting production quotas aims to limit supply to support prices, while increasing quotas allows OPEC to pump more barrels and capture more market share.
OPEC's balancing act between supporting prices and maximizing production is an ongoing challenge. Coordinating policy among members such as Saudi Arabia, Iran and Venezuela with divergent agendas adds further complexity. Traders closely monitor OPEC meetings for signals of shifting supply dynamics.
Quota compliance also affects effectiveness. Cheating by members that exceed their quotas can dampen price gains despite announced cuts. Meanwhile, if quotas represent a real decline in supply from previous levels, large price spikes are possible.
OPEC's ability to influence prices has diminished with the growth of non-OPEC production such as US shale. However, the cartel still exerts significant influence through coordinated production adjustments. Careful analysis of changing quota levels and compliance is critical to assessing OPEC's shifting supply/demand balance.
B. US shale oil production
Increased shale output can put downward pressure on prices
The boom in U.S. shale oil production over the past decade has significantly increased global supply and put downward pressure on prices. Advances in horizontal drilling and hydraulic fracturing have unlocked huge reserves in shale basins such as the Permian and Bakken. Rapid productivity gains allowed shale companies to ramp up production at low breakeven costs.
At its peak in 2019, U.S. shale was pumping nearly 13 million barrels a day, accounting for about two-thirds of domestic crude oil production. When prices collapsed amid the COVID demand shock, shale companies quickly cut spending. But shale can ramp up production relatively quickly as prices recover.
The EIA estimates that U.S. shale production will average 9.2 million bpd in 2023, up nearly 500,000 bpd from 2022. More shale volumes add to supply, which, all else equal, puts downward pressure on prices. However, shale companies are maintaining capital spending discipline rather than maximizing near-term production. How shale responds to price signals will be an important factor influencing the supply/demand balance going forward.

C. Global inventories
Rising inventories point to oversupply and lower prices
Oil inventories provide important insight into real-time supply and demand dynamics. When inventories rise over time, it signals oversupply conditions that can put downward pressure on prices. Conversely, falling inventories indicate undersupply and upward price momentum.
In 2022, total OECD commercial oil inventories fell by more than 300 million barrels from January through October as demand outpaced supply. But the trend reversed in November as economic headwinds intensified. EIA estimates that OECD inventories rose by 27 million barrels in November, the first monthly increase since March.
Looking ahead to 2023, the EIA forecasts that OECD commercial crude inventories will increase by an average of 200,000 barrels per day. Inventory builds are expected in the US and Europe as higher production offsets weaker demand growth. OPEC+ supply policies also have a significant impact on inventories. Cutting production quotas to target inventory draws has been a mainstay of cooperation efforts.
All else equal, expectations for OECD stock draws in 2023 point to looser market balances. However, the trajectory can change quickly depending on economic developments that influence consumption versus production trends. Close monitoring of inventory flows is essential to gauge the shifting dynamics between oversupply and undersupply conditions.
Declining stockpiles indicate tightening supply
- Inventory drawdowns in crude oil and refined products indicate a shortage of supply relative to demand. This market tightness is pushing prices higher.
- OECD commercial inventories have declined significantly from historic highs in 2020. But current levels are still above the 5-year average.
- When production lags consumption, inventories are drawn down to fill the gap. This is not sustainable in the long run.
- The OPEC+ supply cuts aimed to normalize the inflated inventories after COVID by keeping production low. This has supported inventory drawdowns.
- US crude inventories recently hit their lowest level since December 2018, reflecting strong demand and tight domestic supply.
- If stockpiles continue to decline, it will signal that the market may be heading toward an acute supply shortage without a countervailing response such as more production.
- Monitoring inventory trends provides important insights into the real-time balance. Declines suggest upside price risks from tightening balances. Inventory builds point to downside risks.
In summary, the drawdown of excess inventories points to tighter supply/demand balances and upward price momentum in the near term. But it's not a sustainable path longer term without supply responses.

Global Oil supply forecast 2023
OPEC+ oil supply fell by 1.2 mb/d in July to its lowest level in almost two years, as Saudi Arabia voluntarily cut production. The group's output stood at 50.7 mb/d, down more than 2 mb/d since the start of the year. Although non-OPEC+ production rose by 1.6 mb/d to 50.2 mb/d over the same period, the pace of improvement is expected to be modest for the rest of the year.
The expansion was led by the United States, Brazil and Guyana, whose combined July exports rose more than 15% year-on-year to over 9 mb/d, adding to the supply of light, low-sulphur crude from the Atlantic Basin.
Despite declines from OPEC and Russia, the EIA forecasts that global liquid fuels production will increase by 1.4 million bbl/day in 2023, driven by robust growth from non-OPEC countries. This global oil supply outlook incorporates Saudi Arabia's August statement that it will extend its voluntary 1 million bbl/day cut to September. We expect Russian production to average 200,000-300,000 bbl/day lower in 2023 than in 2022 and then to remain flat in 2024.
In its World Oil Market Outlook, the EIA now forecasts that world liquid fuels production will increase by 1.7 million bbl/day in 2024, up from a 1.2 million bbl/day increase projected last month. Despite ongoing cuts through 2024, OPEC crude oil production could still increase by an average of 0.6 million bbl/day in 2024, driven by higher UAE targets and increased Iranian and Venezuelan volumes.
Non-OPEC countries are the main drivers of projected global production increases in the EIA's latest oil market outlook. They estimate that non-OPEC supply will increase by 2.1 million bbl/day in 2023 and 1.2 million bbl/day in 2024. Strong growth is expected from non-OPEC producers excluding the U.S., adding 1.3 million bbl/day of supply in 2023 and 500,000 bbl/day in 2024. Brazil's production is expected to increase by 500,000 bbl/day from 2022 to 2024 as FPSO volumes increase. EIA estimates also show robust gains for Canada, Guyana, and Norway in 2024.

Demand Side Factors
A. Global economic growth
Higher GDP growth increases oil demand
The pace of global economic expansion is a key driver of crude oil demand. Periods of accelerating global GDP growth lead to increased energy consumption, boosting demand for fuels such as gasoline, diesel and jet fuel.
As economies industrialize and incomes rise, this leads to greater mobility and transportation activity, further increasing oil demand. The transportation sector accounts for more than half of total global oil consumption.
Conversely, downturns in economic activity and growth lead to declines in energy consumption. Weaker manufacturing, trade flows and consumer spending reduce demand for crude and refined products.
The COVID-19 pandemic and political restrictions severely impacted global oil demand in 2020, with consumption falling by a record 8.6 million bpd from 2019 levels. The economic recovery in 2021 and 2022 reversed most of these losses.
However, high inflation, rising interest rates, and other headwinds have created uncertainty about the path of global growth in 2023. The EIA forecasts that oil demand will increase by 1.9 million bpd this year, but growth could slow further if conditions deteriorate.
Over the long term, the expansion of emerging markets will be the main driver of oil demand growth. But in the current environment, slower expected growth in developed economies such as the U.S., Europe and China will be key for oil markets. Weaker GDP growth forecasts point to downside risks for crude consumption.
B. Emerging markets
Rising consumption in China, India boosts demand
Emerging markets, particularly China and India, have become the central pillar of global oil demand growth. Rapid population growth, urbanization, and industrialization are driving strong increases in energy consumption.
China overtook the United States as the top importer of crude oil in 2017. Its demand has doubled over the past two decades and currently stands at around 14 million bpd. India's oil demand has also risen to over 5 million bpd and is expected to continue rising.
Emerging Asia now accounts for more than 35% of total global oil consumption. As rising incomes allow for more car ownership and air travel, demand is expected to continue to soar.
However, China's zero-COVID policy and weakness in the property sector will weigh on growth in 2022. Slowing demand in India due to high inflation also creates uncertainty.
Nevertheless, the EIA still forecasts that China and India will account for nearly 60% of global oil demand growth through 2023. Expansion may moderate, but remains robust overall.
Oil markets are now heavily dependent on emerging markets to drive further consumption growth. Any sustained slowdown in mega-economies such as China and India would significantly dampen crude demand and put downward pressure on prices. Their outlook will be crucial for the supply-demand balance.
C. Seasonal factors
Northern hemisphere winter increases heating oil demand
Demand for crude oil has a distinct seasonal pattern linked to weather and holiday activities. This can influence price movements at different times of the year.
During the Northern Hemisphere winter, colder temperatures significantly increase demand for heating oil and other distillate fuel products. In the U.S., winter heating oil demand can be 30-50% higher than summer lows. Natural gas consumption also increases for heating purposes.
Meanwhile, warmer weather in the summer months spurs greater gasoline consumption for leisure and holiday travel. U.S. gasoline demand peaks around the Fourth of July and Labor Day weekends. Jet fuel consumption also spikes.
Seasonal demand spikes can strain supplies, leading to tighter balances and higher crude oil prices. The market is expected to tighten before winter, but cold snaps or heat waves can still cause volatility.
The COVID-19 pandemic disrupted many typical seasonal demand patterns. Lockdowns reduced transportation fuels normally used for summer road and air travel. Working from home reduced winter heating fuel use.
While the effects of the pandemic have subsided, seasonal factors remain essential to analyzing real-time changes in crude oil demand. Expectations of colder weather drive winter price gains, while increased summer driving spurs rallies ahead of holiday weekends. Tracking seasonal effects provides important signals.
Global Oil Demand Forecast 2023
According to the IEA, global oil demand reached a new all-time high of 103 million barrels per day (mb/d) in June 2022, with a possible new peak in August. After months of below-average data, the OECD revised up its demand estimates for May and June, with overall consumption set to resume growth in Q2 2023 after two quarters of contraction. Despite lingering concerns about the economic outlook, Chinese demand also exceeded expectations, rising to new highs. Global oil demand is now on track to increase by 2.2 mb/d this year to reach 102.2 mb/d, the highest annual level on record. With the post-pandemic recovery largely over and the energy transition accelerating, growth rates are expected to moderate to 1 mb/d by 2024.
Switching to new feedstocks, power outages and high temperatures forced many operators to reduce run rates, leaving refineries struggling to keep up with surging demand. Fierce competition in the diesel and gasoline markets has pushed refining margins to multi-month highs. As refiners replace lost OPEC+ barrels with lighter, sweeter grades, high-sulfur fuel oil prices have tightened sharply. Despite nagging competition from cheap LNG and weak Chinese teapot activity, high-sulphur fuel oil rose above North Sea Brent benchmarks in Rotterdam for the first time in 28 years.
The result has been rapidly falling crude and product inventories. In July, oil inventories fell for the third consecutive month, with OECD industry inventories more than 100 million barrels below the 5-year average. With Saudi Arabia and Russia continuing to curb supply, the market balance is expected to tighten further in the fall, at least through September. OPEC+ has a spare capacity buffer of 5.7 mb/d, giving the alliance ample room to increase production later this year. Additional supplies of heavy, high-sulphur crude would allow refiners to increase throughput and ease product market tightness. However, maintaining the group's current targets could trigger a 1.2-2.2 mb/d inventory draw in Q4, which could further push prices higher.
Global Oil Inventories Forecast 2023
The EIA predicts that global oil inventories will shift from a build in the first half of 2023 to a draw by the end of the year, putting upward pressure on global oil prices. In the first half of 2023, global oil inventories are forecast to average a build of 600,000 bpd, while the EIA expects global inventories to average a draw of 400,000 bpd in the second half of the year.
The EIA projects a slight inventory build in 2024, which puts some downward pressure on the 2024 oil price forecast.
How will supply and demand dynamics affect oil price forecasts?
OPEC's supply/demand outlook suggests that oil prices could remain elevated through the end of the year. In its latest report, OPEC kept its oil demand forecast unchanged, projecting demand growth of 300,000 bpd in the second quarter, 1.3 million bpd in the third quarter and 2 million bpd in the fourth quarter.
OPEC lowered its 2024 demand estimate by 100,000 bpd to 101.01 million bpd, indicating a significant gap if supply remains at current levels of 97.31 million bpd. As Saudi production cuts take effect, July output is seen at 836,000 bpd below June levels.
The OPEC declines will be partially offset by record U.S. production, which the EIA expects to rise by 1.276 million bpd. In addition, the agency reported that global oil demand hit an all-time high of 103 million bpd in June, warning of a year-end inventory drawdown.
Oil Price Prediction for 2023, 2025-2030
Oil Price Predictions from Agencies and Banks
EIA - 2023 Oil Price Forecast: Brent $83, WTI $77
The EIA forecasts Brent to average $86/bbl in 2H23, peaking at $88/bbl in Nov/Dec and holding near that level in Q1 2024. Oil prices begin to fall in Q2 2024 as supply growth leads to some rebuilding of global oil inventories. The EIA sees Brent averaging $86/bbl in 2024.
OPIS(Oil Price Information Service) - 2023 Oil Price Forecast: Brent $95-96, WTI $90
OPIS sees WTI reaching $90/bbl in 2023, with Brent potentially reaching $95-96/bbl. How much higher depends on China's successful reopening and whether the Western world avoids a deep recession.
Reuters - 2023 Oil Price Forecast
Oil prices are expected to rise modestly in 2023 as a slowing global economic backdrop and China's COVID-19 outbreak, which threatens demand growth, offset supply tightening from Russian sanctions, according to a Reuters poll conducted in early 2022.
The survey of 30 economists and analysts predicted Brent would average $89.37/bbl in 2023, about 4.6% below the $93.65 consensus in the November survey. The global benchmark averaged $99/bbl in 2022.
WTI is expected to average $84.84/bbl in 2023, versus the November consensus of $87.80.
BCA Research - Oil Price Forecast 2023
BCA forecasts average Brent prices of $115/bbl in 2023 with upside potential. This is partly based on their expectation that the CCP will successfully move away from the zero COVID policy after the chaotic reopening of the economy. They expect Chinese oil demand to fall by 500k bpd in January. Thereafter, demand rebounds in late Q1 and for the rest of the year as consumers increase domestic and overseas travel/spending, with suppressed 2022 oil demand rising 70k bpd above 2022 levels in 2023.
Infrastructure Capital Advisors - 2023 Oil Price Forecast: $80-100/bbl
ICA expects oil to trade between $80 and $100 during the continuation of the war in Ukraine, adding that "oil demand could pick up if China lifts its zero-COVID lockdown policy."
Goldman Sachs - 2023 Oil Price Forecast
Goldman is broadly bullish on commodities, predicting they will be the best-performing asset class in 2023, returning 43% to investors.
In their 2023 Commodities Outlook report, the strategists also said that Q1 performance could be more muted than other quarters this year due to an expected economic slowdown.
Morgan Stanley - 2023 Oil Price Forecast: Brent $90
Morgan Stanley forecasts Brent to reach $90 in 2023, assuming the OPEC+ alliance plays a role in rebalancing markets next year. They expect supply to grow 30% faster than demand by 2023 as Russian production fully normalizes and conventional (Brazil, Norway, Guyana) and unconventional (U.S., Canada, Argentina) projects come online.
Citigroup - 2023 Oil Price Forecast: Brent $80, WTI Midland $75
Citi sees oil demand growth of around 1.2-1.3 million bpd next year. Their base case is a doubling of supply growth in 2023, much of it from the Western Hemisphere - U.S., Brazil, Canada, Guyana, Argentina, maybe Venezuela, and even Mexico. Citi sees oil prices staying flat in 2023.
ING - Oil price forecast 2023
ING also released a bullish oil price forecast for 2023.
The Dutch bank said shrinking Russian supply and OPEC+ cuts mean the global oil market is expected to tighten in 2023. ING expects the deficit to widen further this year, signaling that oil prices should move higher from current levels.
ING currently forecasts ICE Brent prices to average $104/bbl in 2023, but added uncertainty is very high on its oil forecast given the geopolitical dynamics and global economic trajectory.
Oil Price Forecast for the Next 5 Years (Mid and Long term)
The Energy Information Administration (EIA) takes a conservative view in its Annual Energy Outlook, forecasting relatively low oil prices through 2050:
2025 - Brent forecast to average $61/bbl, WTI $58/bbl
2030 - Brent $73/bbl, WTI $70/bbl
2035 - Brent $80/bbl, WTI $77/bbl
2040 - Brent $87/bbl, WTI $84/bbl
2045 - Brent $91/bbl, WTI $88/bbl
2050 - Brent $95/bbl, WTI $92/bbl
The EIA outlook is based on projections of slowing growth in energy demand and continued growth in oil production, especially from shale. However, many analysts consider these estimates to be conservative.
Consultancy Wood Mackenzie forecasts much lower oil prices by 2030 if fuel consumption declines in line with emissions targets to limit climate change:
- 2030 - Oil prices could fall to $40/bbl
- WoodMac sees peak oil demand likely in the late 2020s
Wallet Investor, a financial modeling site, provides these oil price forecasts:
- 2025 - WTI forecast at $102/bbl, Brent at $112/bbl
- 2030 - WTI at $129/bbl, Brent at $146/bbl
LongForecast, which uses statistical modeling, also sees higher oil prices than the EIA outlook:
- 2025 - WTI forecast at $94/bbl, Brent at $102/bbl
- 2030 - WTI at $102/bbl, Brent at $129/bbl
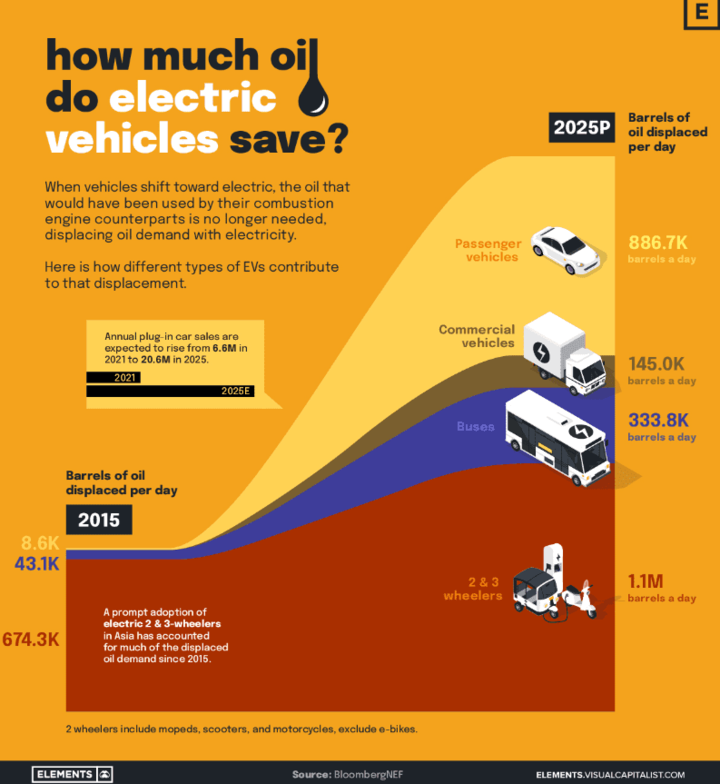
Key factors that could push oil prices higher include tighter supply due to underinvestment, higher demand if EV adoption is slow, and geopolitics. Lower prices could result from a recession affecting demand, a faster transition to renewables and EVs, and more supply sources like Iran returning to the market. Most experts say there is still a lot of uncertainty around long-term price forecasts.
What causes oil price volatility? Understand the factors behind oil market instability.
Market Sentiment
A. Geopolitical risks
Supply disruptions from conflicts support prices
The ongoing war between Russia and Ukraine has severely disrupted crude oil and product flows, creating huge uncertainty about supply adequacy. Fears of further cuts from Russia are fueling volatility.
- Negotiations on the Iran nuclear deal could eventually allow more than 1 million bpd of Iranian oil to return to global markets. But complex dynamics make progress fragile and perpetuate uncertainty.
- Conflicts in Libya, Nigeria and Iraq threaten significant production outages, fueling fears of supply shortages.
- Attacks on infrastructure in Saudi Arabia, the UAE, and shipping lanes such as the Bab el-Mandeb Strait periodically unsettle markets.
- Ongoing geopolitical flashpoints and the risk of new disruptions cloud the outlook. Threats of supply disruptions, even if they do not materialize, create a risk premium.
- The market sentiment is highly sensitive, with participants quick to bid up prices on any supply uncertainty.
- Managing geopolitical risks remains critical to stability and avoiding excessive volatility.
B. US dollar strength
Stronger dollar makes oil more expensive for holders of other currencies and dampens demand
The appreciation of the U.S. dollar against major currencies is a notable headwind for oil demand and prices. When the dollar strengthens, it makes dollar-denominated commodities like oil more expensive for buyers using other currencies.
In 2022, the dollar reached its highest level in two decades against a basket of currencies. This reduces purchasing power abroad and weighs on consumption. Areas such as Europe, Japan, India and emerging markets are particularly affected.
A strong dollar also encourages oil stockpiling, as weaker currencies make oil cheaper to buy. This dynamic can temporarily add to the downward pressure on prices.
However, the dampening effect of a stronger dollar on oil demand is often gradual. Large currency moves take time to have a significant impact on consumption patterns. In some cases, countries may subsidize fuel to protect consumers.
Meanwhile, the rally in the dollar increases the purchasing power of U.S. consumers for oil imports and supports domestic demand. But the relatively inelastic nature of US oil consumption limits the upward impact on prices.
Overall, a rising dollar tends to be bearish for oil prices. It is a phantom source of supply, with a demand-suppressing effect similar to an increase in actual inventories. Still, dollar strength alone rarely triggers major oil declines without other fundamental drivers.
C. Speculation and market positioning
Increased speculative long positions can inflate prices
Speculative trading activity and investor positioning are important sentiment drivers in the oil markets. If speculative long positions increase significantly, it can push prices beyond levels justified by underlying fundamentals.
Speculators help provide liquidity in the market. But excessive speculative buying, driven by bullish sentiment rather than physical demand, creates the risk of an unsustainable disconnect.
This phenomenon was evident during the oil price spikes of 2008 and later in 2022. Investors piled into crude oil futures and options contracts to profit from the upward momentum. Their outsized long bets became partially self-fulfilling, pushing prices higher despite ample supply.
When the speculative fever finally breaks, an abrupt wave of long liquidation can accelerate sharp price declines. This volatility highlights the risks of markets dominated by financial players rather than physical oil buyers and sellers.
Regulators try to limit excessive speculation through position limits and margin requirements. But it is difficult to track all market activity in today's vast, complex oil derivatives market.
Overall, while some speculation is healthy, extended positioning distortions driven by sentiment rather than fundamentals tend to sow the seeds of future volatility. Monitoring positioning is key to gauging price dislocations.
Technical Analysis
A. Price chart patterns
Trend lines, support/resistance for entry/exit points
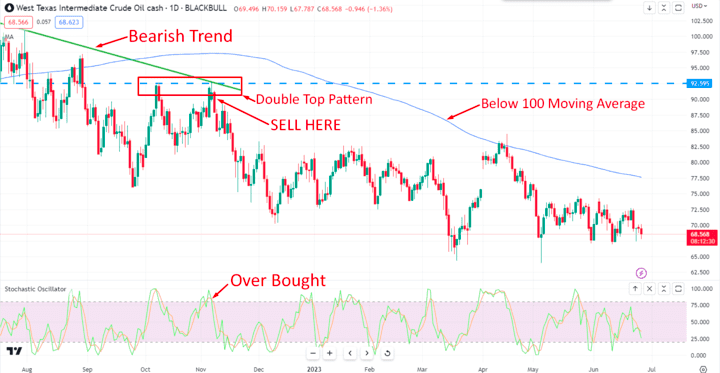
Traders closely study price charts and technical indicators for clues to market psychology and future direction. Chart patterns such as trend lines, support/resistance levels, moving averages, etc. are used to identify entry and exit points.
- Upward or downward trends represent sustained bullish or bearish sentiment momentum. Traders look to buy at support breaks in uptrends and sell at resistance in downtrends.
- Horizontal support and resistance levels reflect areas of buyer/seller concentration. Breaks above or below them signal shifts in sentiment and potential new trends.
- Chartists look for patterns such as double tops, head-and-shoulders, triangles, and flags that may precede trend reversals. These indicate that bulls or bears are losing conviction.
- Momentum indicators such as MACD and RSI help identify overbought/oversold conditions and price divergences that warn of sentiment extremes.
- Major moving averages such as the 50-day and 200-day provide dynamic areas of support/resistance and define bull/bear trends. Crossovers signal shifts in sentiment.
Of course, technicals only measure market psychology, not fundamentals. But chart patterns reflect the real supply/demand dynamics of the futures markets. Combined with fundamentals, technicals help guide trading decisions.
B. Indicators
MACD, RSI to gauge momentum and overbought/oversold conditions
- The Moving Average Convergence Divergence (MACD) indicator shows the relationship between two moving averages and their convergence/divergence. Crossovers can signal momentum shifts in bullish or bearish sentiment.
- The Relative Strength Index (RSI) measures the magnitude of recent price changes to identify overbought (above 70) or oversold (below 30) conditions. Extremes can indicate buyer/seller exhaustion and impending sentiment reversals.
- The Slow Stochastic Oscillator shows where current prices stand in relation to recent highs and lows. Readings above 80 indicate overbought conditions, while readings below 20 indicate oversold conditions.
- The Money Flow Index (MFI) uses price and volume data to measure buying and selling pressure. A high MFI indicates bullish sentiment, while a low MFI indicates bearish sentiment.
- Moving Average Ribbon overlays multiple moving averages to assess sentiment trends. Clustering indicates consistent sentiment, while dispersion reflects uncertainty.
- On-Balance Volume monitors cumulative flow to see if buyers or sellers are dominating. Rising OBV indicates bullish sentiment while falling OBV signals bearishness.
These indicators help traders confirm or anticipate shifts in market psychology and sentiment. Combined with other technical and fundamental analyses, they provide valuable complementary insights.
C. Volume analysis
Rising volume on price breaks indicates stronger moves
- Volume indicates the overall level of market participation behind a price breakout. High volume on a break above resistance or below support confirms the momentum and commitment behind the change in sentiment.
- Low volume on such breaks indicates a lack of conviction and possible exhaustion. The move may not be sustained without significant participation.
- Volume spikes at chart tops can mark blow-off tops where bullish sentiment reaches a euphoric extreme. Huge volume drops often precede reversals.
- Strong upward price action coupled with rising volume indicates solid bullish momentum. Sustained downward price action with heavy volume indicates that bearish flows are dominant.
- Volume trends aid in the analysis of accumulation/distribution patterns. Rising prices on rising volume generally reflect bullish accumulation. Falling prices on rising volume signal distribution as bears take control.
- Comparing price action on up/down days to the accompanying volume provides insight into changing sentiment and conviction.
- Changes in volume activity signal transitions between enthusiasm, urgency, fear and disinterest among market participants.
Overall, volume analysis is crucial for confirming sentiment-driven price movements and assessing the market's evolving psychology and participation levels. Traders watch volume activity closely for insights.


Recent History of Oil Prices: Causes and Effects of Volatility Since 2010
After reaching record highs of over $140 per barrel in 2008, oil prices fell sharply during the global recession, bottoming out below $40 in 2009.
A period of stability followed, with prices fluctuating between $80 and $120 until 2014. This was supported by strong emerging market demand and restrained OPEC supply.
Prices collapsed from mid-2014 due to rising US shale production and OPEC's decision not to cut production. Brent crude fell below $30 in 2016.
An OPEC-led agreement to curb supply helped stabilize and support prices around $50-70 through 2017-2019.
The COVID-19 pandemic crashed oil demand in 2020, sending prices below zero at one point. Brent fell below $20 a barrel.
In 2021, recovering demand and production cuts pushed prices back above $80. Russia's invasion of Ukraine caused a spike above $120 in 2022.
Oil price volatility has major implications for producers, consumers, and the global economy. High prices can stifle economic growth and lead to demand destruction.
Final
Forecasting future oil price movements requires a multi-layered analytical framework that encompasses both fundamental and technical factors.
On the fundamental side, analysts must monitor key oil supply and demand drivers across regions, as well as OPEC policy, inventory levels and other market equilibrium factors. Geopolitical risks, global growth forecasts, currency movements, and macroeconomic trends also play an important role.
However, market psychology and sentiment often diverge from core fundamentals. Technical analysis provides insight into traders' evolving perceptions through metrics such as price action, volatility, volume, momentum oscillators and chart patterns.
By synthesizing supply/demand forecasts, macro fundamentals, real-time market structure shifts and technical indicators, it is possible to predict potential price ranges. But flexibility is key as complex fundamentals and sentiment constantly evolve. Models must be adaptable.
Ultimately, oil price forecasting requires an interdisciplinary synthesis of macro fundamentals, market microstructure analysis, sentiment measures, statistical models and geopolitical inputs. This provides a robust framework for anticipating potential price movements while maintaining agility.