


EURUSD
Fundamental Perspective
Next week, the European Union is set to release its inflation figures on Tuesday, featuring the Harmonized Index of Consumer Prices (CPI) for August, which is anticipated to remain consistent with the previous period's readings. The most recent Pan-European inflation rate stood at 0.3%, and investors are anticipating a similar outcome. Inflation continues to be a persistent concern, and any significant deviation from the expected figures could prompt investors to seek safer investment options.
On the United States front, the upcoming week places a spotlight on the activities of the Federal Reserve (Fed). It is widely anticipated that the Fed's Federal Open Market Committee will maintain the US benchmark interest rate at its current level of 5.5%. However, apprehensions about inflation persist, leaving markets prepared for potential rate hikes as the year draws to a close.
Thursday will bring the release of US jobless claims data, while Friday is scheduled to unveil the preliminary Purchasing Manager Indexes (PMI) for manufacturing and services sectors in the European Union. Later in the day, the United States will release its own PMI data, creating a noteworthy day for economic data publication.
Technical Perspective
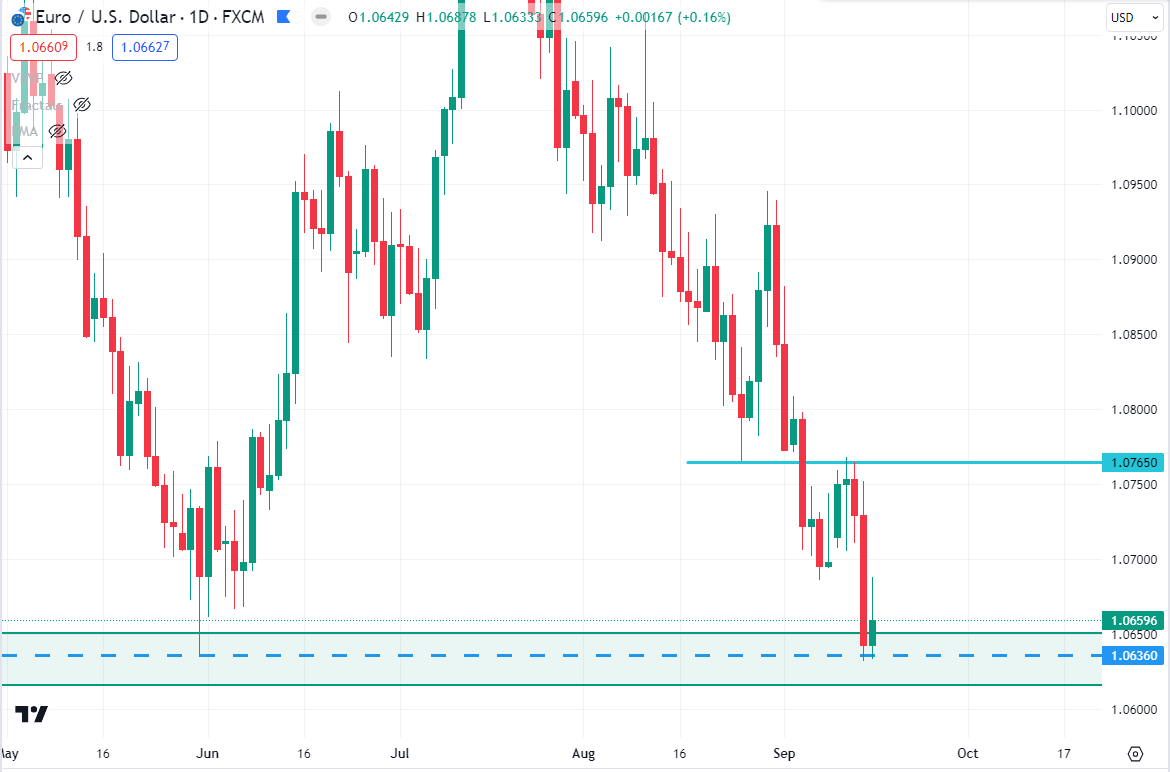
Source: tradingview.com
EURUSD has finally hit its May 31st low after an impulsive bearish momentum. The price is currently trading around the 1.0659 area after bouncing from the 1.0636 psychological support level. As per the current price action, EURUSD may retrace higher towards the 1.0765 price area before continuing further downside in the coming days.
GBPJPY
Fundamental Perspective
The British Pound (GBP) has encountered challenges in sustaining its upward momentum relative to the Japanese Yen (JPY) in recent times. The GBP/JPY pair has displayed signs of weakness, notably gravitating towards the 50-day Simple Moving Average (SMA) after relinquishing its grip on the significant 186.00 level at the end of August.
Back in January of 2023, the GBP/JPY pair had reached its lowest point for the year, hovering around the 156.00 mark. Since then, the GBP has exhibited commendable resilience in capitalizing on the weakening of the JPY, resulting in the Guppy's year-to-date gains still standing at approximately 17.50%.
Technical Perspective
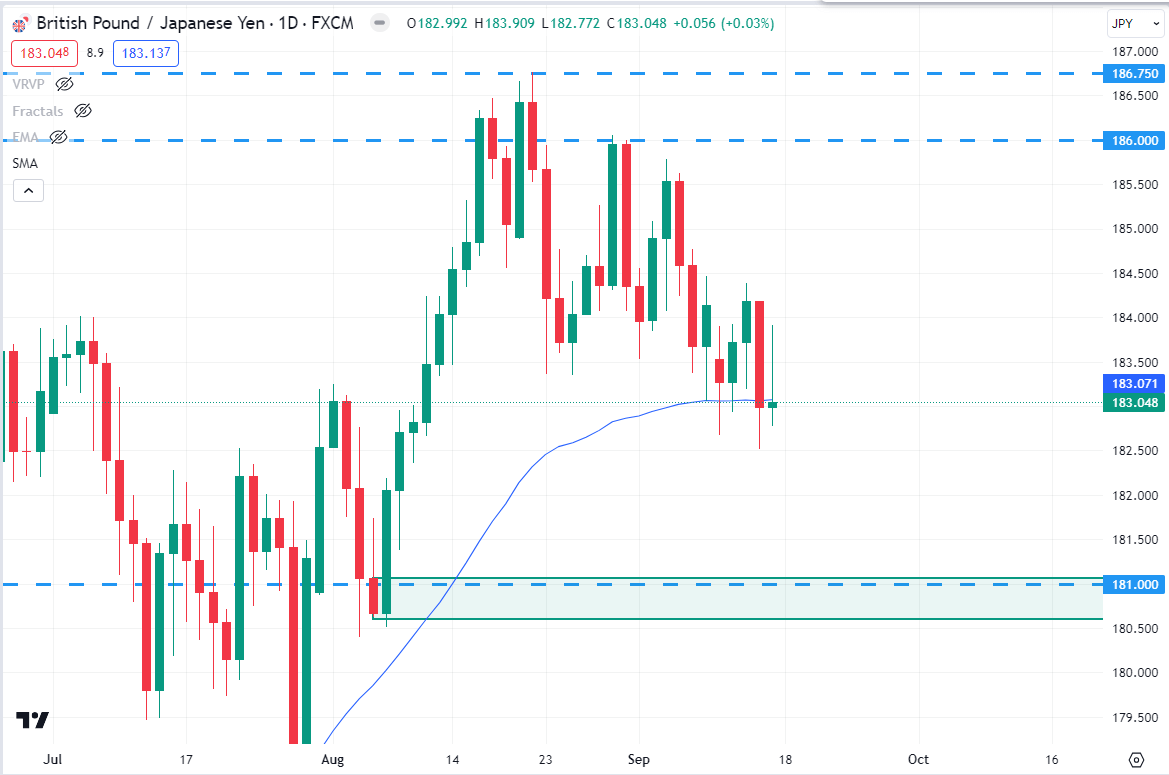
Source: tradingview.com
GBPJPY is currently trading around the 183.07 price area and trying to push further downside. After an impulsive bullish momentum, the price has found resistance around the 186.75 - 186.00 price area. As per the current price action context, GBPJPY may continue further lower towards the 181.00 demand zone, before continuing further higher in the days ahead.
NAS100
Fundamental Perspective
The NAS100, representing the Nasdaq 100 index, faces an intriguing week ahead. Recent economic data and technological advancements continue to drive the tech-heavy index. Favorable earnings reports from leading tech companies have boosted investor confidence, although rising inflation remains a concern.
The Federal Reserve's monetary policy decisions, especially any hints of tightening, will be closely watched. Geopolitical tensions, including trade issues and global supply chain disruptions, may also impact the NAS100.
Technical Perspective
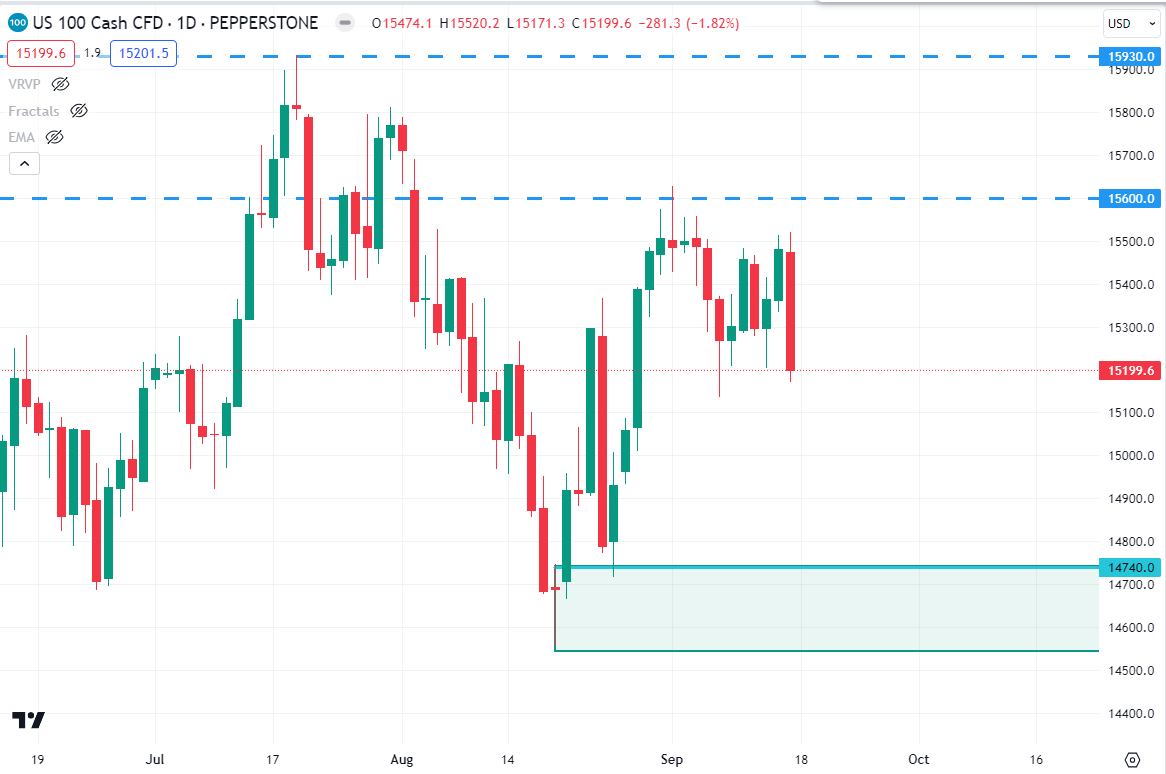
Source: tradingview.com
NAS100 is currently trading around $15199.6 price area and trying to push to the downside. After facing strong resistance around the $15930.0 - $15600.0 psychological area, the bears regained momentum and pushed the price down to the $14550.0 price area. However, after an impulsive bearish move, the price has retraced to $15600.0 - $15930.0 price area again. As per the current price action context, if the price can break below the $15208.6 neckline level with a daily bearish candle, NAS100 may continue towards $14740.0 price again in the days ahead.
SP500
Fundamental Perspective
The S&P 500 (SP500) faces an eventful week. Recent economic data paints a mixed picture, with robust corporate earnings contrasting with concerns about rising inflation and the potential for Federal Reserve tightening.
Geopolitical factors, including trade tensions and global supply chain disruptions, remain significant influences. The index's technical analysis reveals strong support at around $4356.00 and resistance at $4520.00 making these key levels to watch for potential market movements.
Investors should closely monitor central bank statements and any developments on the fiscal policy front, as they will shape market sentiment. In this complex environment, staying flexible and being prepared to adjust strategies will be essential for navigating the week ahead successfully.
Technical Perspective
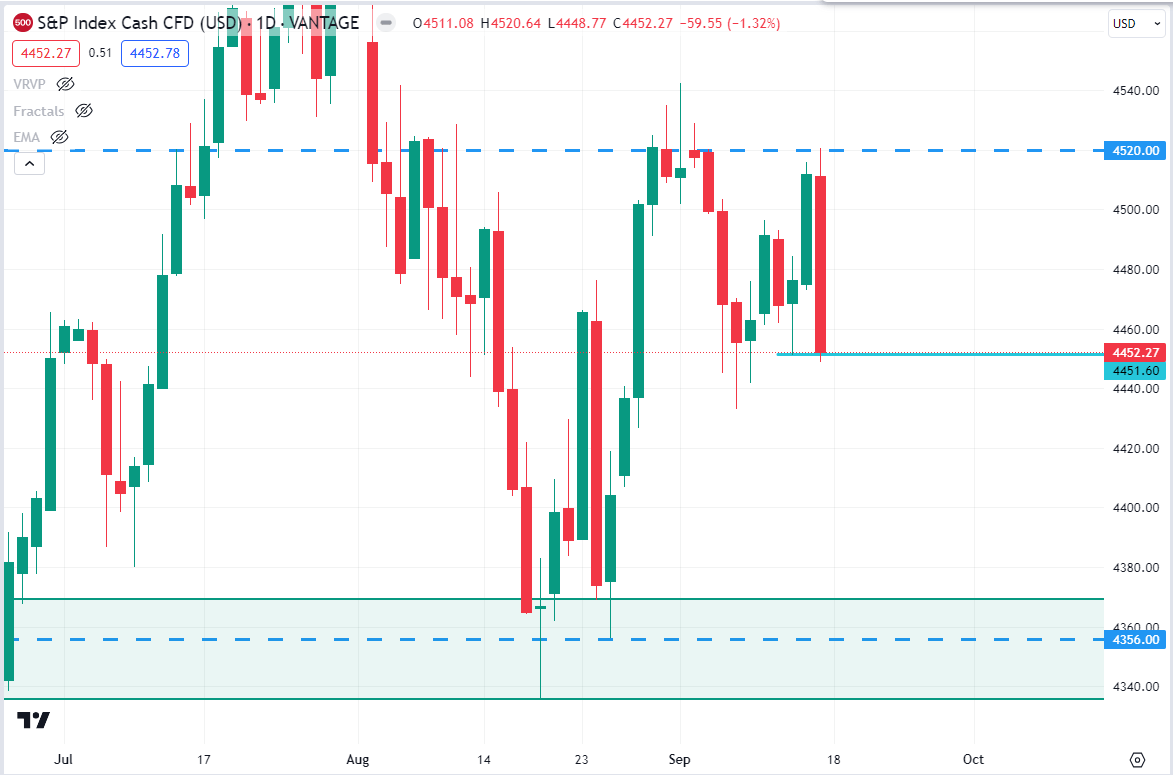
Source: tradingview.com
SP500 is currently trading around the $4452.30 price area after rejecting the psychological resistance level $4520.00 area. So, if the price can have an impulsive daily bearish candle close below the $4451.60 neckline, SP500 may continue its bearish momentum further towards the $4356.00 support level again in the coming days.
HK50
Fundamental Perspective
The outlook for the Hong Kong Hang Seng Index (HK50) in the week of September 17, 2023, to September 22, 2023, hinges on several key factors. Recent economic data from China, as a major influence on the HK50, suggests a stabilizing growth trajectory, which could provide support for the index. Geopolitical tensions remain a concern, with any escalations potentially impacting market sentiment. Additionally, the Federal Reserve's monetary policy decisions and global market trends will likely exert influence.
Technical Perspective
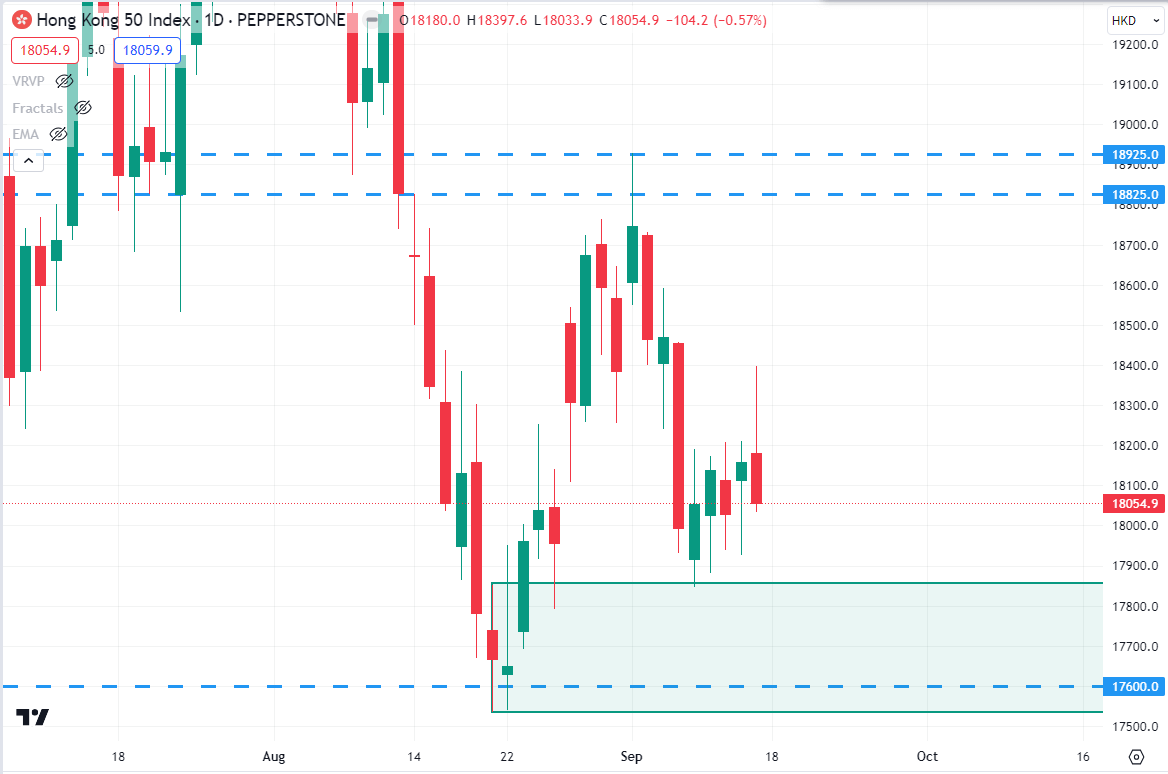
Source: tradingview.com
HK50 has faced strong resistance around the $18925.0 - $18825.0 price area and pushed down below the $18200.0 psychological level. The price is currently residing around $18054.9 price area and trying to continue downside. So, if the price can have a daily bearish candle close below the $18032.0 area, the bears may push the price down toward the $17600.0 support level again in the days ahead.
Bitcoin (BTC)
Fundamental Perspective
The price of Bitcoin (BTC) has successfully regained support above the $26,000 mark and is currently poised to make a decisive move beyond $27,000, potentially breaking free from a multi-week consolidation range. A noteworthy shift in market sentiment is indicated by the pronounced decline in risk signals into the 60 range.
As this upward momentum continues, it is reasonable to anticipate the emergence of profit-taking pressure around key levels such as $27,400 and $28,000. However, this ascent appears to be a preparatory phase leading up to the challenge of breaching the psychological barrier at $30,000. Should this materialize, Ethereum (ETH) prices may also exhibit a similar trajectory.
Technical Perspective
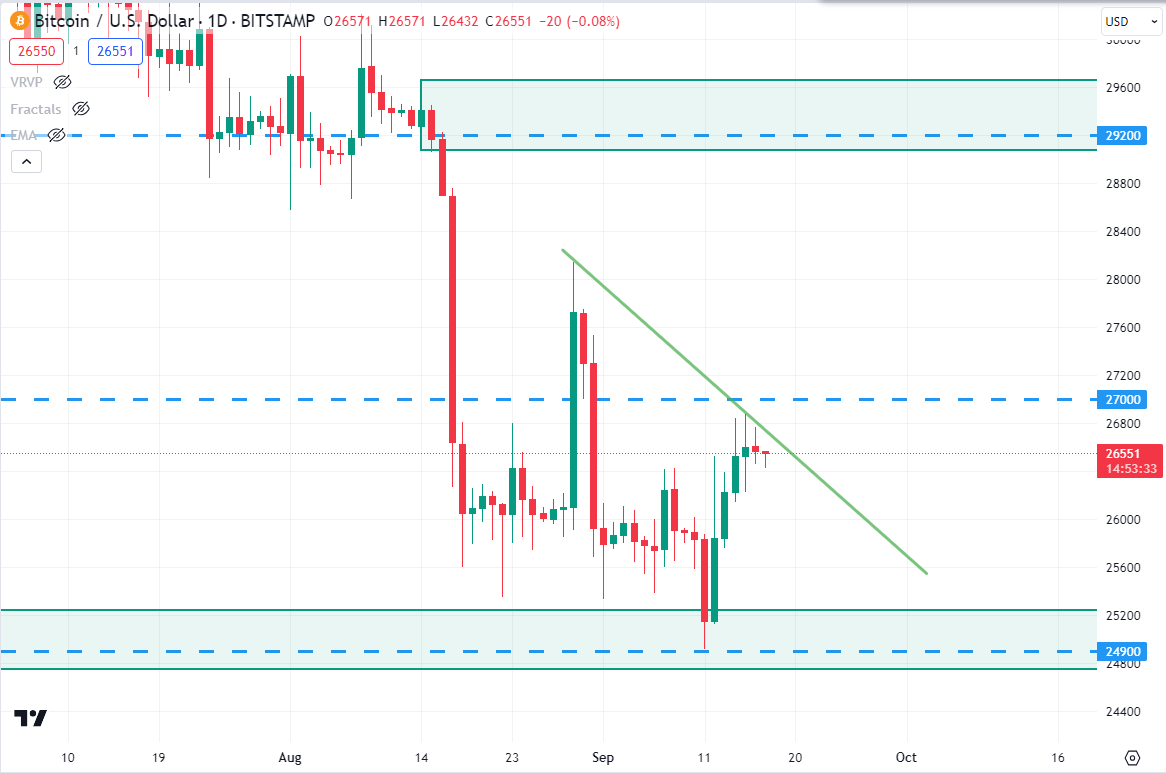
Source: tradingview.com
BTC is currently trading around $26558 price area and trying to move further higher. However, the price is currently facing strong resistance at the bearish trend line. So, if the price can break above the bearish trend line and has a daily bullish candle close above the $27000 price area, the bulls may continue upward toward the $29200 supply zone in the coming days.
Ethereum (ETH)
Fundamental Perspective
The launch of the Holesky testnet holds significant implications for the Ethereum blockchain, representing a significant stride towards realizing the ETH 2.0 vision. This development, in essence, ushers in a blockchain that augments the scalability and security features available to the Ethereum community.
Scalability, in this context, pertains to the heightened capacity for testing infrastructure and implementing upgrades in more demanding scenarios. Consequently, developers are poised to encounter a more streamlined process when conducting tests on the Holesky testnet. This proactive approach serves to detect and address any scalability issues on the testnet before they potentially manifest on the mainnet, ultimately safeguarding user experiences. Ethereum core developer Parithosh Jayanthi has emphasized the necessity of deploying a larger validator node on the testnet as compared to the mainnet, as elucidated in a statement provided to CoinDesk.
Technical Perspective
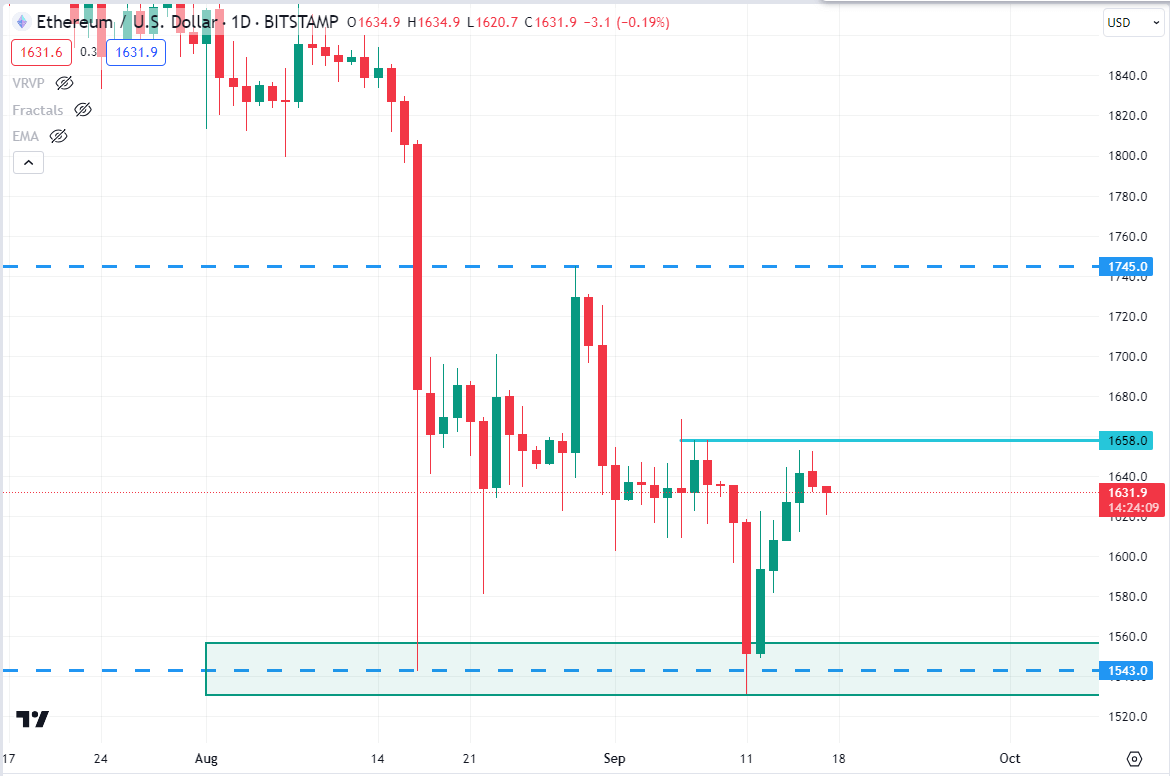
Source: tradingview.com
ETH price reached Aug 23rd’s low again last week. However, the bears failed to break below the $1543.0 support level and pushed higher again. As per the current price action, if the price can break above the $1658.0 resistance level with a daily bullish candle, the bulls may continue higher toward the $1745.0 area in the days ahead.
Tesla (TSLA)
Fundamental Perspective
In the upcoming week, Tesla Inc. (TSLA) faces a dynamic landscape. Recent developments include Tesla's robust vehicle delivery figures, signaling strong demand, and continued progress in their gigafactory expansion plans worldwide. However, supply chain challenges, particularly in semiconductor procurement, remain a concern.
Furthermore, the broader market sentiment, influenced by macroeconomic factors and global energy trends, can impact TSLA. Traders should remain attentive to these dynamics and consider potential shifts in the electric vehicle industry landscape as they navigate the week ahead.
Technical Perspective
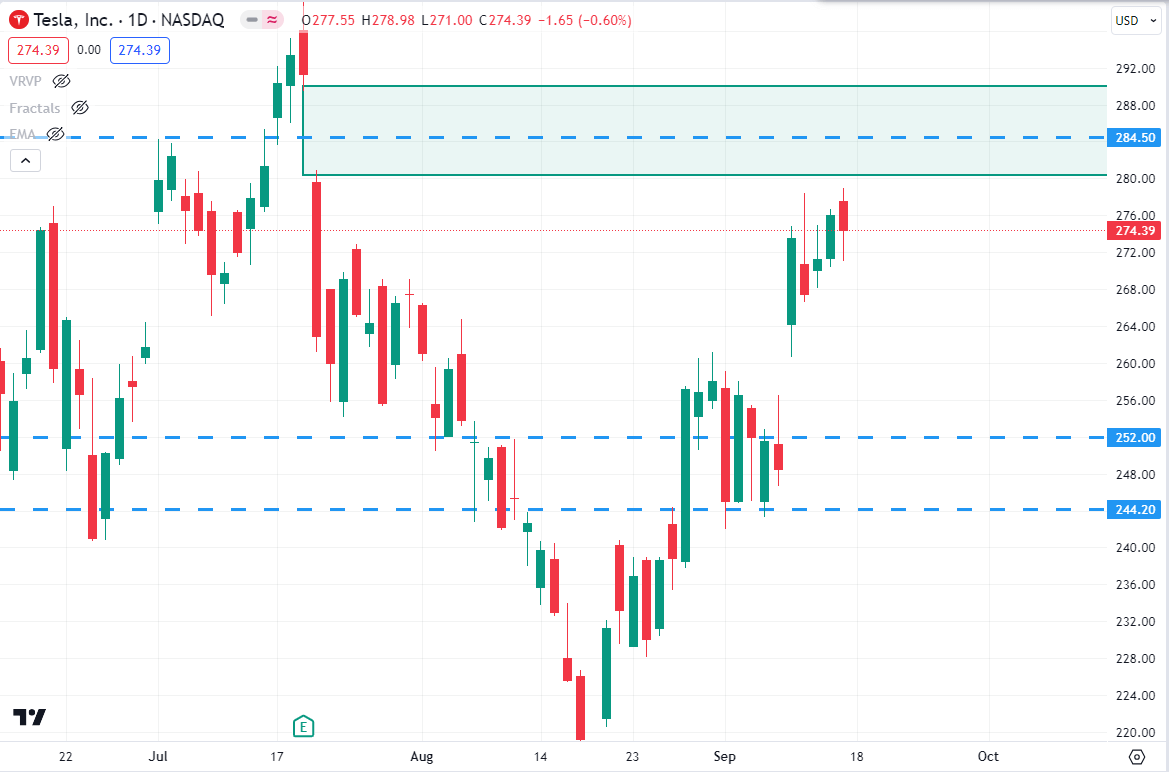
Source: tradingview.com
TSLA stock price found support around the $244.20 - $252.00 price area and pushed higher last week. The price is currently residing around the $274.40 price area and trying to climb further upward. So, if the price climbs further higher towards the $284.50 resistance level and has a bearish candle close below it, the bears may push the price down towards the $252.00 - $244.20 price area in the coming days.
GOLD (XAUUSD)
Fundamental Perspective
Gold exhibited a noteworthy resurgence, catalyzed by the decision of the European Central Bank (ECB). Despite implementing a 25 basis point rate hike that pushed rates to historic highs, market dynamics were shaped by indications that this move might constitute the final step in the present tightening cycle. Consequently, this prompted market participants to take action, resulting in a decline in the Euro and Eurozone yields. This development proved beneficial for Gold, allowing it to sustain its position above the $1,900 threshold.
Technical Perspective
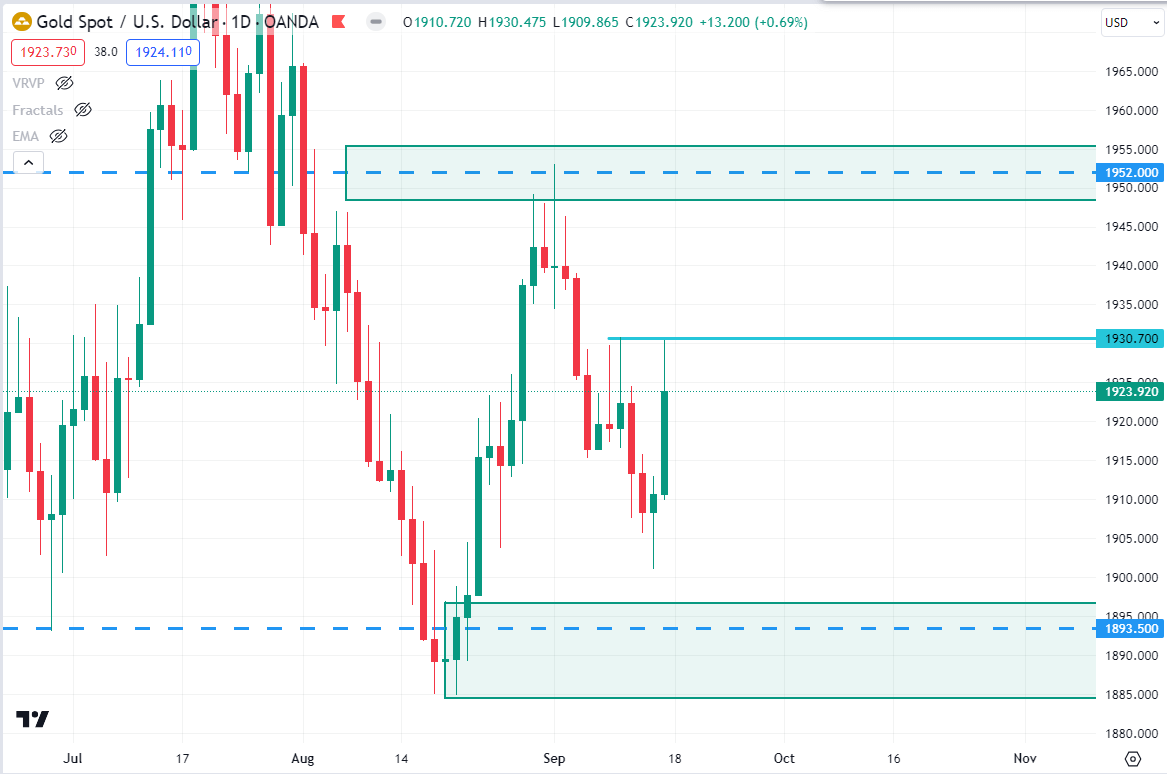
Source: tradingview.com
GOLD is currently trading around the $1923.92 price area after rejecting the $1930.70 event level. So, if the price rejects the $1930.70 event level again and has a bearish candle close, the bears may push the price down toward the $1893.50 support level in the days ahead.
OIL (WTI)
Fundamental Perspective
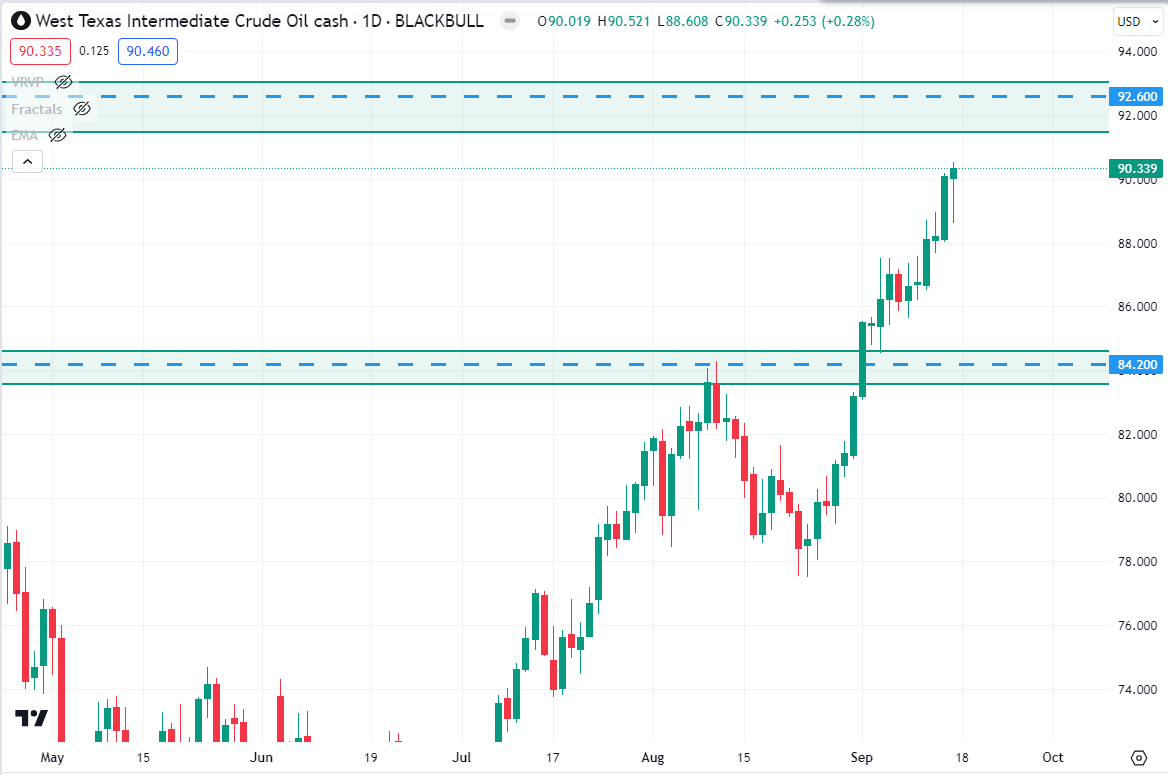
West Texas Intermediate (WTI) crude oil, a benchmark for US oil prices, exhibited a degree of hesitancy during Friday's trading session. It briefly dipped to $88.60 per barrel before staging a rebound and approaching the significant threshold of $90 per barrel. The US crude oil market is currently poised to conclude the fourth consecutive month in positive territory, with prices having surged by nearly 40% from the year's lows, which were situated around $64.50.
Technical Perspective
Source: tradingview.com
WTI continued its bullish run towards November 2022’s high. The price is currently trading around the $90.33 price area and may hit the $92.60 psychological key level. So, if the price reaches $92.60 and rejects with a daily bearish candle close, the WTI price may retrace the downside toward the $84.20 support level in the coming days.
GAS
Fundamental Perspective
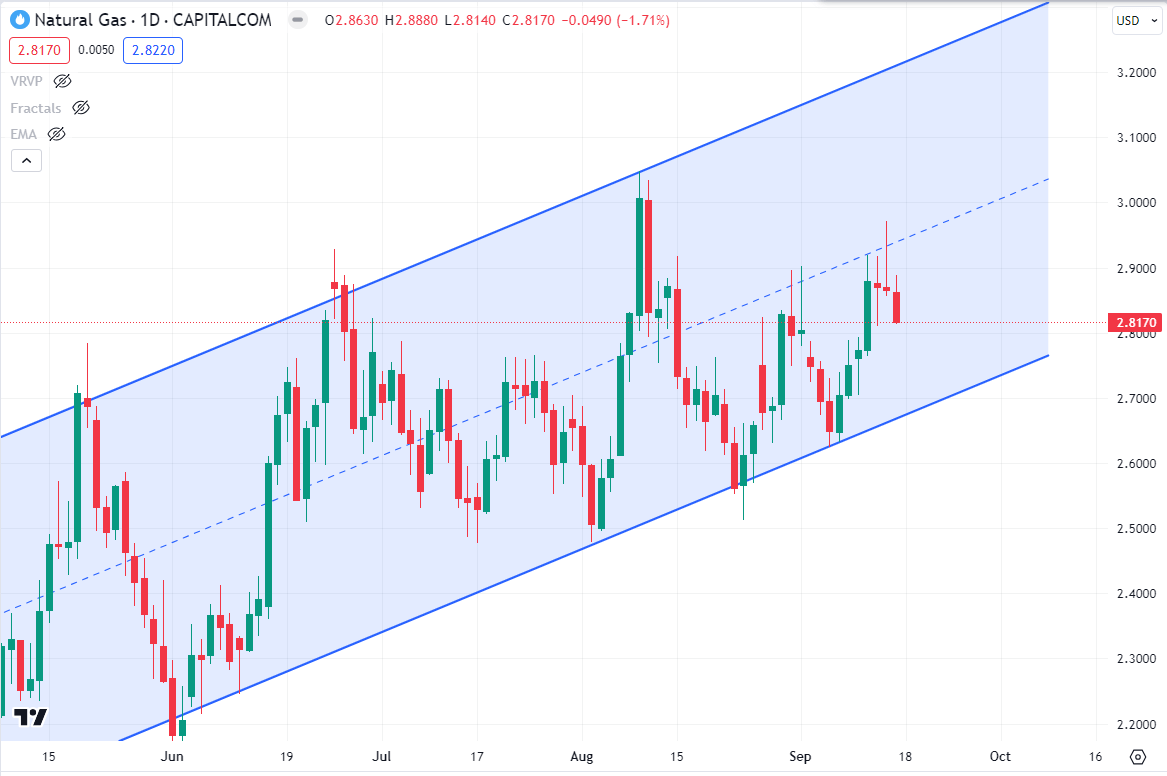
Natural Gas prices are experiencing a downward trajectory following a morning marked by conflicting reports. As of the time of this writing, it remains uncertain whether the Troll field, Norway's largest gas field, will resume operations on Saturday or possibly not until Tuesday at the earliest. This confluence of news has exerted downward pressure on Natural Gas prices, primarily due to persistently subdued demand conditions. The recent European Central Bank meeting witnessed significant downward revisions in growth forecasts for the eurozone, indicating that the gas-dependent region is likely to require even less LNG than initially anticipated.
Furthermore, the United States has been witnessing a rapid buildup in gas storage levels, with data from the Energy Information Administration (EIA) on Thursday revealing an increase from 33 billion to 57 billion cubic feet in gas storage. Meanwhile, Europe is entering the upcoming winter season with relatively higher temperatures expected in the coming weeks. Consequently, the likelihood of shortages appears to be increasingly remote.
Technical Perspective
Source: tradingview.com
GAS is still following its bullish channel and currently trading around $2.8170 price area. After bouncing from the bullish channel’s support, the bulls pushed the price higher but failed to continue over the $2.900 price area. As per the current price action context, the price may retrace to the downside towards the bullish channel’s support again. So, if the price comes to the bullish channel’s support and bounces with an impulsive daily bullish candle, the GAS may continue its bullish momentum toward the bullish channel's resistance in the days ahead.


