Is deciphering cryptocurrency charts similar to cracking a complex code to you? Are you yearning to unlock the hidden patterns and trends critical to profitable trading? Get ready to embark on a thrilling journey as we unravel the secrets of reading cryptocurrency charts like a seasoned pro!
Understanding chart analysis is the ultimate superpower in the exciting world of cryptocurrencies, where fortunes are made. It's not just about tracking the rise and fall of prices but delving deeper into the intricate web of data to uncover the underlying trends, support and resistance levels, and potential breakout opportunities.
On the bright side, we are here to demystify the fear of cryptocurrency charts. In this captivating guide, we will walk you through the art of reading and analyzing these charts, equipping you with the skills to navigate the crypto market confidently. Let us dive in!
Understand Cryptocurrency Metrics
To understand crypto charts effectively, it is crucial to grasp the underlying metrics that shape them. Let us explore the essential metrics that often go hand in hand with market capitalization:
a. Price
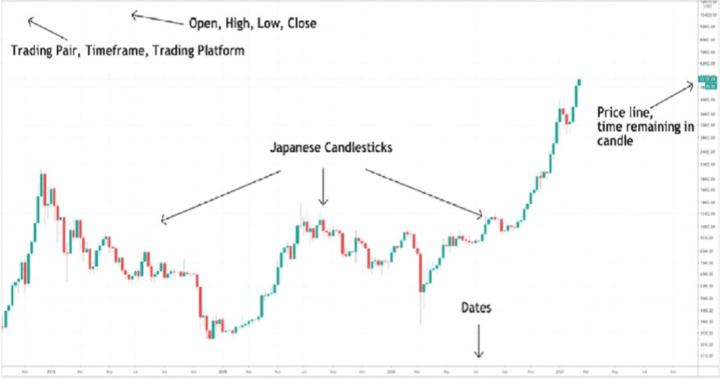
Closing Price: The closing price represents the value of a cryptocurrency at the end of a specific period, be it a day, an hour, or even a minute. It acts as the anchor for each period on the chart.
High, Low, and Opening Prices: These three metrics provide valuable insights into the price range during a given period. The high price indicates the peak value reached; the low price represents the lowest point. The opening price marks the starting point for that period.
Volume: Volume is the lifeblood of the cryptocurrency market. It represents the total number of coins traded during a specific period. In addition, it indicates the level of market activity and can give you a sense of the market's liquidity.
b. Market Capitalization
Market capitalization plays an essential role in gauging the overall size and liquidity of the crypto market. Important metrics to look out for in market capitalization include:
Calculation: Market capitalization is determined by multiplying the current price of a cryptocurrency by its circulating supply, which represents the total number of coins available in the market.
Significance: Market capitalization provides a holistic view of a cryptocurrency's size and its position within the market. It is a benchmark for comparing different cryptocurrencies and understanding their relative value.
The Power of Market Capitalization
Market capitalization acts as a measure for assessing the cryptocurrency market's overall size, liquidity, and maturity. Here's why it's such a crucial metric:
- Size of the Market
Market capitalization allows you to gauge the scale of the crypto market. Cryptocurrencies with higher market capitalization are generally considered to have a larger presence and more established networks. They often attract greater attention from investors, regulators, and the media.
- Liquidity
Liquidity refers to the ease with which a cryptocurrency can be bought or sold without significantly impacting its price. Market capitalization provides a rough estimate of the liquidity of a cryptocurrency. Higher market capitalization generally indicates greater liquidity, making trading larger volumes of crypto coins easier without causing significant price fluctuations.
c. Market Dominance
Market dominance is calculated by expressing a specific cryptocurrency's market capitalization as a percentage of the total market capitalization of all cryptocurrencies combined. Market dominance provides insights into a specific cryptocurrency's relative size and influence within the broader market. It helps you assess which crypto coin holds a more substantial market share and has a greater impact on overall market dynamics.
Becoming Familiar with Chart Types and Indicators
To confidently navigate crypto charts, it's essential to acquaint yourself with various chart types and indicators. These charts and indicators are designed to help you make an informed choice before entering any trading position. Let’s consider these chart types and indicators:
i. Candlestick Charts
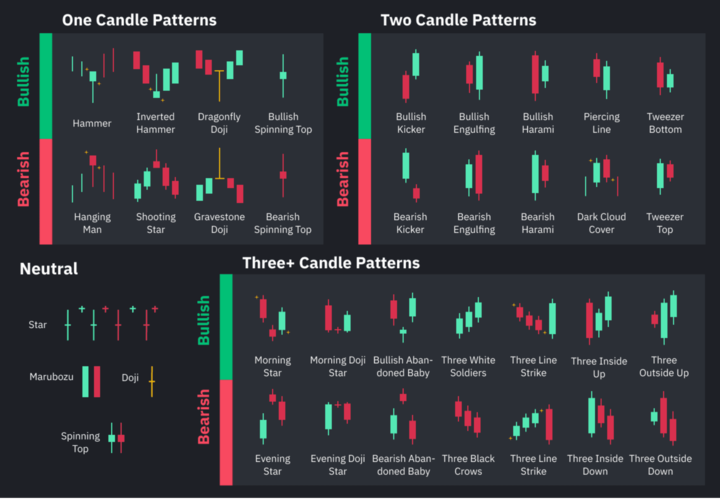
Candlestick charts provide a visual representation of price movements during a specific period. Each candlestick displays that period's opening, closing, high, and low prices. These charts are powerful tools for identifying trends and gauging market momentum. Each candlestick can be classified as "bullish" or "bearish."
Bullish Candlesticks: A bullish candlestick indicates an upward trend in price. The opening price is usually lower than the closing price. It is usually depicted as colored green or white.
Bearish Candlesticks: Conversely, a bearish candlestick signals a downward trend in price. The opening price is higher than the closing price. The candlestick is often depicted as colored red or black.
Observing the patterns formed by consecutive bullish and bearish candlesticks lets you gain insights into the sentiment and potential future direction of a coin’s price.
ii. Line Charts
Line charts are the most straightforward type of chart, plotting the price of a crypto coin over a specific time. Each point on the chart represents the closing price of the cryptocurrency for that period. It is imperative to mention that line charts help you identify the broader trends that may span weeks, months, or even years.
In addition, they can reveal whether a cryptocurrency is in an upward trend (bullish) or a downward trend (bearish). By understanding the long-term trend, you can gain insights into cryptocurrency sentiment and make more informed investment decisions.
iii. Technical Indicators
In addition to understanding different chart types, you must familiarize yourself with the arsenal of technical indicators. These powerful tools provide valuable insights into market trends, support and resistance levels, and the speed of price movements. They are:
Convergence Divergence Indicator (MACD): The MACD is a popular momentum indicator that reveals the relationship between two moving averages. It consists of two lines: the MACD line and the signal line. The MACD line represents the difference between a short-term and a long-term moving average, while the signal line is a moving average of the MACD line. The crossing of these lines can indicate potential trend changes or reversals.
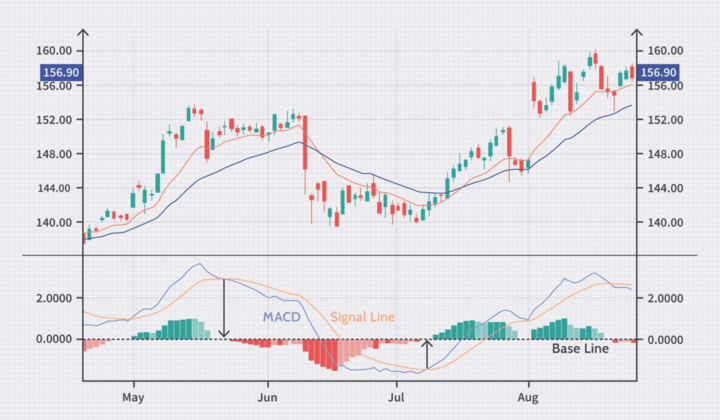
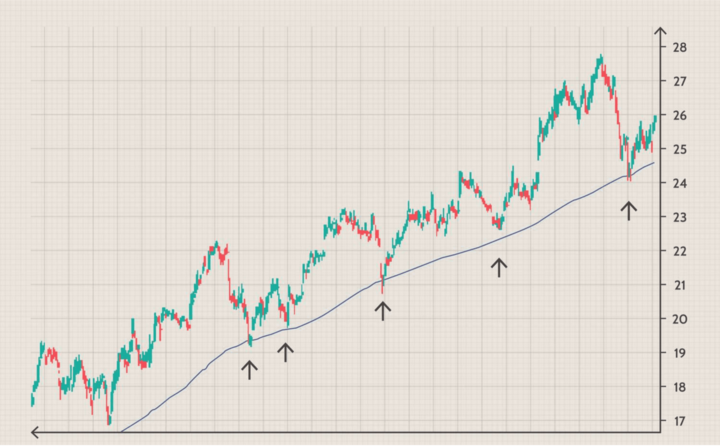
Moving Averages: These are powerful tools for identifying trends and support/resistance levels. They calculate the average price over a specified period and plot it on the chart. Commonly used moving averages include the simple moving average (SMA) and the exponential moving average (EMA). Short-term moving averages respond quickly to price changes, while long-term moving averages provide a smoother representation of the overall trend.
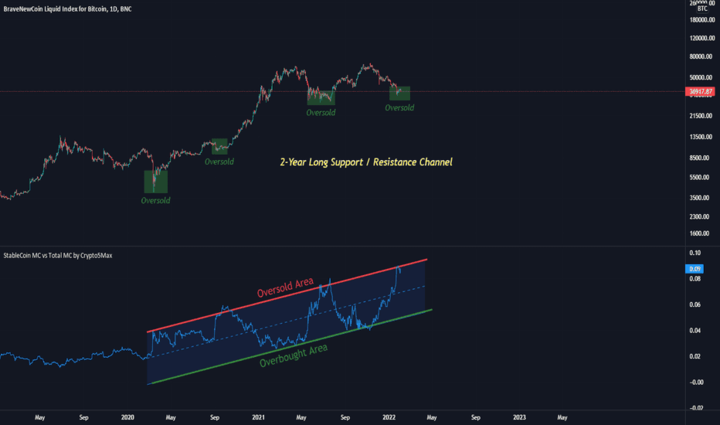
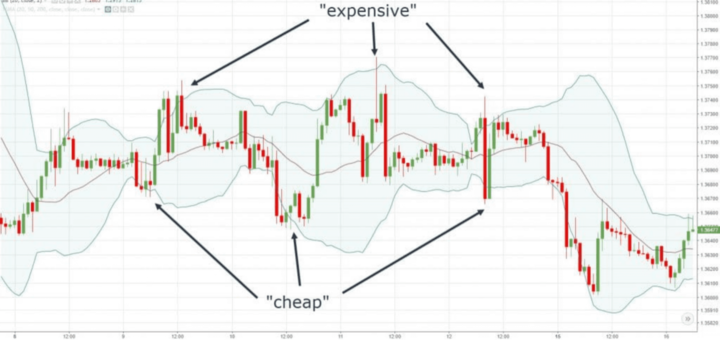
Bollinger Bands: Bollinger Bands consist of three lines: the middle band (a moving average) and the upper and lower bands, representing standard deviations from the middle band. Bollinger Bands help identify volatility and potential price breakouts. The price may be overbought when it reaches the upper band, signaling a potential reversal. Conversely, when the price hits the lower band, it may be oversold, suggesting a possible upward movement.
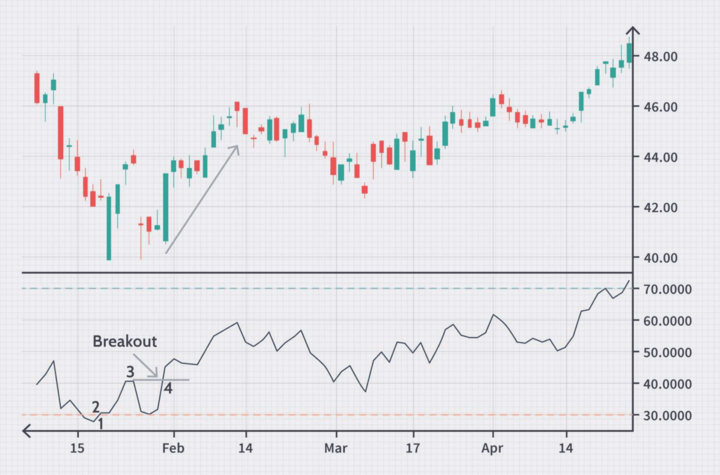
Relative Strength Index (RSI): The RSI is a widely used oscillator that measures the speed and change of price movements. It oscillates between 0 and 100, indicating overbought conditions when it approaches 70 or above and oversold conditions when it dips to 30 or below. The RSI can help identify potential trend reversals, divergences, and areas of price exhaustion.
Identifying Key Elements of Charts
To better understand charts and when to enter a trading position, other important considerations are the key elements of the chart. These elements are sometimes overlooked as they play no role in trades. However, they are vital to helping you analyze your trading positions and the market. Let's consider these elements:
A. Time Frames
Crypto charts offer a range of time frames, each displaying price data over a specific duration. The most common time frames include minutes (such as 1-minute or 5-minute), hours (such as 1-hour or 4-hour), days (such as daily or 3-day), weeks, months, and even years.
The appropriate time frame depends on your trading strategy, goals, and personal preferences. For example, day traders in short-term trades may prefer shorter time frames, like minutes or hours, as they provide more detailed price movements. On the other hand, swing traders focusing on medium-term trades might opt for daily or weekly time frames to capture broader trends.
Long-term investors seeking to hold assets for months or years may rely on monthly or yearly time frames to identify significant market cycles. Consider the time you can dedicate to analyzing charts. Shorter time frames require more frequent monitoring and faster decision-making, while longer ones allow a more relaxed approach.
B. Trends
Trends represent the general direction in which prices are moving. Understanding the three primary types of trends is fundamental:
Uptrend: An uptrend occurs when the price forms higher highs and higher lows over an extended period. It signifies a bullish market, with buyers dominating and driving prices upward.
Downtrend: A downtrend occurs when the price forms lower lows and lower highs over an extended period. It signifies a bearish market, with sellers in control and pushing prices downward.
Sideways Trend: A sideways trend occurs when the price moves within a relatively narrow range, neither forming significantly higher nor lower lows. It indicates a period of market indecision or consolidation.
To identify and confirm trends, expert traders use various tools and techniques:
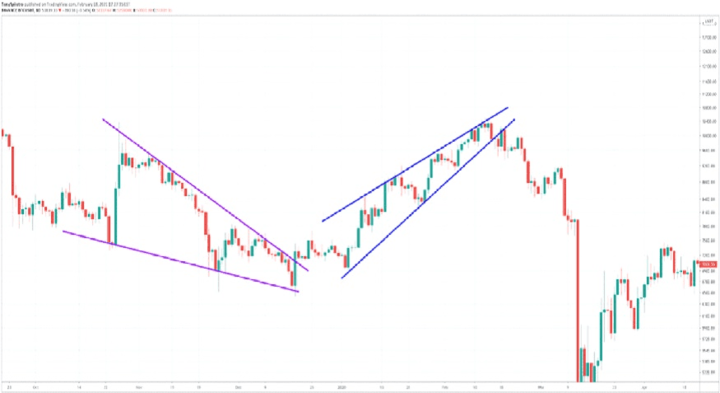
Trend Lines: Trend lines are diagonal lines drawn on a chart connecting significant swing highs or lows. An uptrend is confirmed when an ascending trend line connects higher swing lows, while a downtrend is confirmed when a descending trend line connects lower swing highs. Trend lines act as dynamic support or resistance levels, guiding traders in identifying potential entry or exit points.
Channels: Channels are formed by drawing parallel trend lines around price movements. An uptrend channel includes an ascending trend line connecting higher swing lows and an upper trend line connecting higher swing highs. Conversely, a downtrend channel comprises a descending trend line connecting lower swing highs and a lower trend line connecting lower swing lows. Channels help define the boundaries within which prices move, providing traders with potential price targets and trend continuation or reversal signals.
Movement Patterns: Price movements often exhibit recognizable patterns that can indicate the continuation or reversal of a trend. Examples include triangles, flags, head and shoulders, and double tops/bottoms. These patterns provide valuable insights into market sentiment and potential future price movements.
C. Support and Resistance Levels
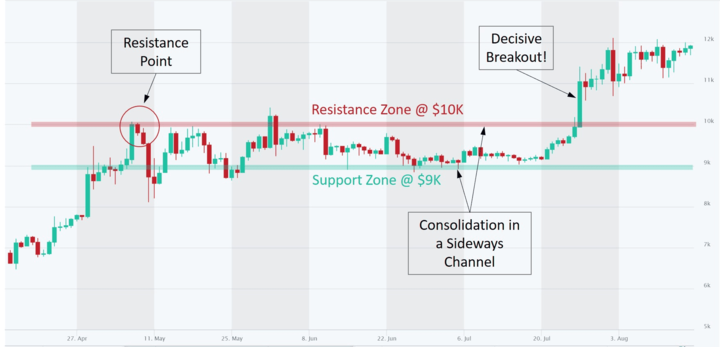
Support and resistance levels are horizontal price zones where buyers and sellers interact. These levels represent areas where the market has historically shown buying or selling pressure, causing price movements to pause, reverse, or accelerate.
Moving averages indicators calculate the average price over a specified period and can act as support and resistance levels. As prices approach moving averages, they bounce off or struggle to break through these levels. Traders pay close attention to the interaction between price and moving averages to gauge potential support or resistance areas.
More so, the significance of support and resistance levels lies not only in their existence but also in their potential breaks. When prices decisively break above a resistance level, it indicates a potential trend reversal or continuation of an uptrend. Conversely, when prices decisively break below a support level, it signals a potential trend reversal or continuation of a downtrend. Increased volume often accompanies these breaks and can offer profitable trading opportunities.
Read and Analyze Cryptocurrency Charts Effectively
To navigate the complexities of crypto charts, adopting a systematic approach that combines technical indicators, time frames, trend analysis, support and resistance levels, and volume considerations is crucial. Let's delve into each of these elements in detail:
i. Technical Indicators: Unveiling Overbought and Oversold Conditions
One of the key approaches is to focus on technical indicators. Technical indicators, such as the Relative Strength Index (RSI) or Stochastic Oscillator, provide insights into overbought or oversold conditions. These indicators measure the speed and magnitude of price movements, indicating when an asset may be due for a correction or reversal.
ii. Primary Time Frame: Finding Your Chart Compass
To better analyze your trading charts, select a primary time frame that aligns with your trading or investment strategy. This time frame will be your chart compass, guiding your analysis and decision-making process. Stick to your chosen time frame to maintain consistency and avoid getting overwhelmed by shorter-term fluctuations.
iii. Confirmation Across Time Frames: Strengthening Your Analysis
Another key approach is to consider examining multiple time frames. Look for confirmation of trends and key price levels across different time frames, such as daily, weekly, or monthly charts. When trends align across multiple time frames, it strengthens the reliability of your analysis and trading signals.
iv. Support and Resistance Breakouts
While analyzing charts, timing is important. Wait for significant breaks of key support and resistance levels before entering trades. These breaks often signal the start of a new trend or the continuation of an existing one. Patience is key; let the price validate the breakout before entering the trading position.
v. The Power of Volume: Unleashing Price Validation
Volume plays a crucial role in validating price movements and the strength of trends. The higher trading volume during breakouts or significant price movements adds confirmation and suggests greater market participation. Always consider volume alongside price action to validate the reliability of chart patterns and trends.
Advanced Charting Techniques: Elevating Your Analysis
After carefully applying the abovementioned strategies and approach, you can confirm your trading position with these advanced techniques. These techniques provide deeper insights into market trends and optimal entry and exit points. Let us examine these techniques:
a. Elliot Wave Theory
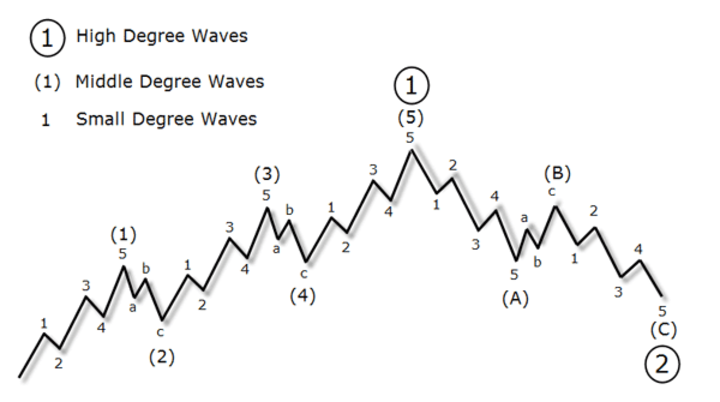
Ralph Nelson Elliot developed the Elliot Wave Theory. This theory suggests that markets move in repetitive patterns driven by investor psychology. It identifies waves of bullish and bearish price movements, providing insights into market sentiment. By understanding the wave structure and wave counts, you can anticipate potential trend reversals and ride the waves of market sentiment.
b. Fibonacci Retracements and Extensions: The Golden Ratio at Work
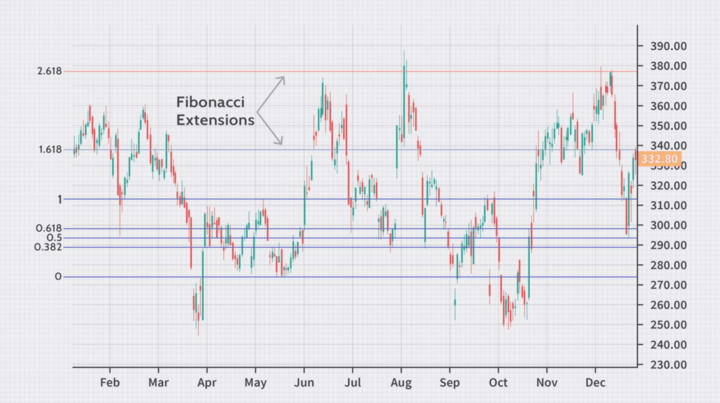
This technique is based on the mathematical concept of the Golden Ratio. Fibonacci levels help identify potential support and resistance zones. Retracement levels (38.2%, 50%, or 61.8%) indicate potential price pullbacks, while extension levels (127.2% or 161.8%) suggest potential price extensions beyond the previous trend. These levels assist in identifying areas of price congestion and potential turning points.
c. Ichimoku Cloud and Oscillator
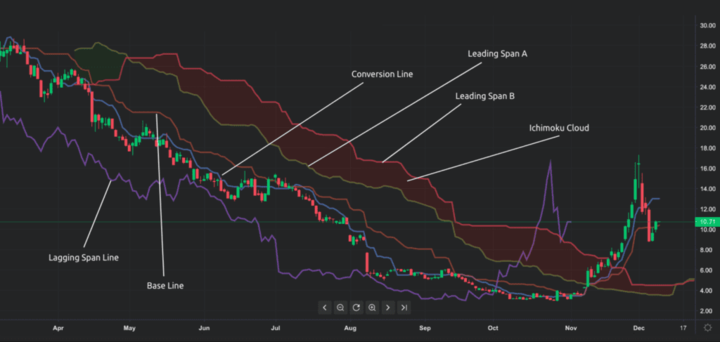
This comprehensive indicator combines multiple elements, including the cloud (Kumo), the Tenkan-sen, the Kijun-sen, and the Chikou Span. It provides a holistic view of support and resistance levels, trend direction, and potential momentum shifts. The cloud acts as a dynamic support or resistance zone, while the oscillator helps identify overbought or oversold conditions.
d. Fractals
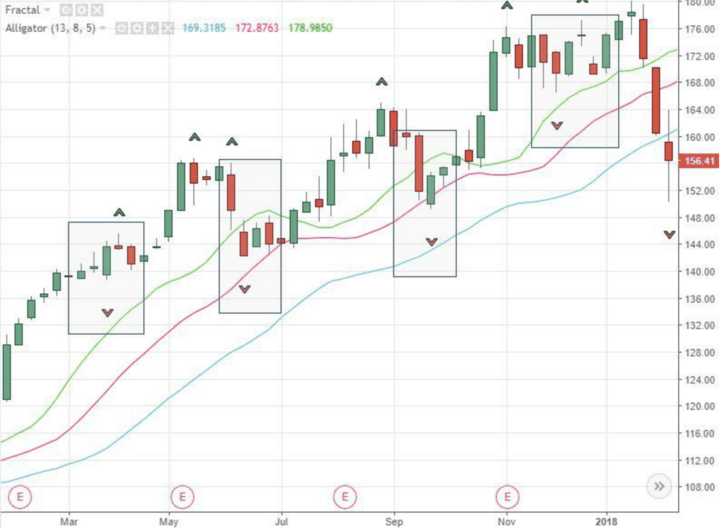
Fractals are repetitive patterns that indicate potential market reversals. A fractal consists of five or more consecutive bars, with the middle bar being the highest or lowest. The price may reverse and offers insights into potential turning points in the market.
e. Chaikin Money Flow and On Balance Volume
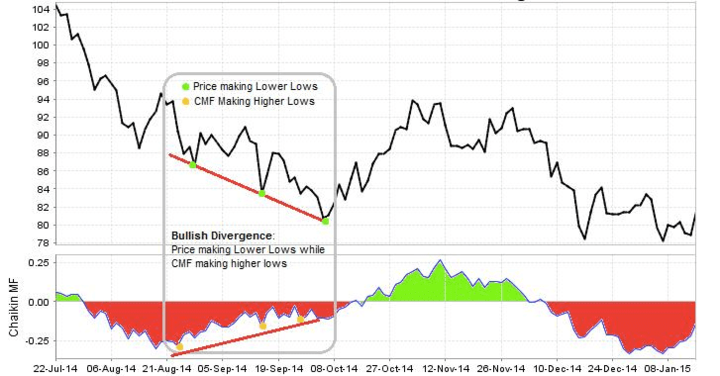
These volume-based indicators help gauge buying and selling pressure in the market. CMF combines price and volume data to identify money flow into or out of an asset. OBV, on the other hand, measures the cumulative volume and provides insights into the strength of price movements. Both indicators can assist in confirming price trends and identifying potential trend reversals.
Trading Crypto CFDs With VSTAR
Aside from understanding your trading charts and entering safe trading positions for profits, it would be best to consider a reputable broker. If having a safe trade with optimal profits is your goal, you should consider trading with a reputable broker- VSTAR.
With VSTAR, you can trade Crypto CFDs (Contracts for Difference), which allow you to speculate on the price movements of various cryptocurrencies without actually owning them. This opens up a world of possibilities, allowing you to enter and exit positions quickly, take advantage of leverage, and diversify your trading portfolio.
But what exactly sets VSTAR apart? Let's uncover why trading Crypto CFDs with VSTAR can be a game-changer in your crypto trading journey.


Accessibility and Convenience: VSTAR's user-friendly platform provides easy access to cryptocurrencies. Whether you're interested in Bitcoin, Ethereum, or other popular altcoins, you can trade them all in one place without the hassle of managing multiple wallets or exchanges.
Leveraged Trading: Amplify your trading potential with leverage. VSTAR offers competitive leverage ratios, allowing you to control larger positions with a smaller investment. While leverage can magnify profits, exercising caution and managing your risk effectively is important.
Risk Management Tools: VSTAR prioritizes the safety of its traders. With risk management tools such as stop-loss orders and take-profit orders, you can set predefined price levels to automatically close your positions, helping you protect your capital and secure your profits.
Advanced Trading Tools: Enhance your trading strategies with VSTAR's suite of advanced trading tools. From real-time price charts and technical indicators to comprehensive market analysis and news updates, you'll have the resources to make well-informed trading decisions.
Dedicated Customer Support: At VSTAR, they value traders and strive to provide exceptional customer support. Their dedicated team can assist you with questions or concerns, ensuring a seamless trading experience.
So, whether you're a seasoned trader looking to expand your trading horizons or a beginner eager to explore the vast potential of the crypto market, VSTAR's Crypto CFD trading platform is your best choice.
Conclusion
Chart analysis is a personal tool that provides you with the insights and foresight needed to make informed trading decisions. It empowers you to navigate the highs and lows of the market, spotting opportunities that others might miss.
Armed with this newfound knowledge highlighted in the above sections, you now possess the skills to navigate the crypto market with confidence. Charts will no longer appear as an indecipherable maze of lines and patterns but as windows into the dynamic world of digital currencies.
However, mastering the art of reading cryptocurrency charts is an ongoing journey. The crypto market is ever-evolving, with new opportunities and challenges arising each day. Stay updated on the current and trending strategies. Trade safely!