
META stock remains one of the most popular and preferred stock buys among investors. This is unsurprising; META has enjoyed remarkable growth, and META stock news is expected to remain bullish. The problem, however, is that many factors contribute to META stock, and as such, trading Meta stock successfully requires investors to make accurate Meta stock price predictions. This is where technical analysis comes in.
In this post, we’ll explore what technical analysis is and why it’s important for you as a trader. We’ll also explore how you can use technical analysis on VSTAR, a fully regulated institutional-level trading platform for CFD trading, to make accurate Meta stock analysis.
Technical Analysis and Its Importance for Traders
Technical analysis is a strategic approach to market forecasting primarily focused on studying price patterns and trading volume of a particular asset, such as Meta Platforms stock (NASDAQ: META).
Technical Analysis Vs. Fundamental Analysis
Technical analysis is often viewed as the direct opposite of fundamental analysis, another widely employed approach in stock trading. This is because, unlike technical analysis, which is majorly focused on charts and price action, fundamental analysis draws the validity of its predictions from the news. It involves determining the intrinsic value of a stock by evaluating a company’s key metrics, such as earnings, dividends, market cap, and overall economic conditions.
Technical analysis, on the other hand, uses statistical trends derived from trading activity, such as price movements and volume, to predict future stock price behavior, such as that of Meta stock.

Credit: iStock
Technical Analysis: Advantages Over Other Trading Approaches
One advantage of technical analysis over other stock trading approaches is that it offers a collective overview of all market participants. This means that technical analysis focuses less on “what should happen’” and more on “what is currently happening.”
In addition, technical analysis provides a broad overview of the market, making it easy for trades to identify support and resistance levels. For example, in the case of Meta stock price analysis, support and resistance levels are price points at which Meta stock is expected to rebound upwards (support) or downwards (resistance).
Overview of Meta Platforms, Inc. (NASDAQ: META)

Credit: iStock
Meta Platforms, Inc. (NASDAQ: META) was formerly known as Facebook, Inc. Meta is quite popular, thanks to its innovations in social media platforms, where it has diversified into several business segments. Some of these include Facebook, WhatsApp, and Instagram, arguably the three most-used social media platforms globally.
A 5-year evaluation of Meta stock price showed that Meta Platforms stock has been doing very well recently, following the significant crash that spanned 2021 to 2022. Meta stock price is on course to reach its most recent 2021 high of 383.790. Meta’s 1-year price performance also looks promising, with a 42.78% increase.
Meta Platforms also currently has a $562.19 B market cap rating. This is higher than its 2022 rating of $545.44 B but still significantly lower than its 2021 $935.64 B valuation. A combination of all of the above, coupled with recent expectations for META stock price to rise and at least meet its most recent 2021 high, if not surpass it, explains why META stock remains a popular stock option among traders.
Technical Analysis of the Meta Platforms, Inc. (NASDAQ: META) Stock
In this section, we’ll conduct a technical analysis of Meta Platforms stock using data from TradingView.
Price Action and Trend of META's Stock
A historical evaluation of META stock prices, on the 12 months time frame showed that although Meta stock price dipped around the 383.21 price level in 2021, it's currently rising back in an attempt to reach or, very possibly, smash that high and reach new heights.
Analysis of META's Stock Price in Relation to Its Historical Highs and Lows
Credit: TradingView
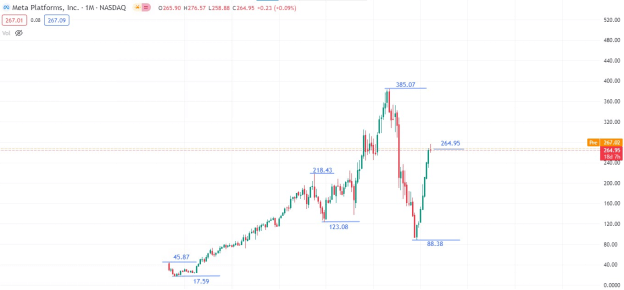
According to available data from TradingView, Meta’s launch price was around the 45.87 level, after which it then dipped to record the company’s all-time stock level low of 17.59. After this, Meta stock price steadily increased in value until it peaked at the 218.43 level in July 2018, after which there was a sharp rejection in price to the 123.08 level (December 2018).
From there, Meta stock price gained momentum again, beating its previous all-time high of 218.43, and then, it set a new all-time high around the 385.07 price level in August 2021. This feat was followed by the most significant price crash in Meta stock history, with price breaking old lows and falling as far as the 88.38 level (October 2022).
Since then, however, Meta's stock price has steadily risen, and it now sits around the 272.88 level. Price appears to be reaching an all-time high of 385.08, but since this analysis was done in the monthly timeframe, it’s safe to say that it will take some time before it gets there. That said, from the price trends, Meta stock is currently a strong buy since it appears very bullish. If Meta stock price manages to beat the 264.95 level, there’ll be little doubt that it’ll also go on and beat the 385.08 level.
However, you should note that since that particular price level has already been associated with a massive price rejection movement, we’ll likely see another repetition of a significant price retracement after it takes that high. This is because the 385.08 level is a significant price level, and you can expect to see some “sell” reaction once the price gets to that zone.
Analysis of Key Technical Indicators for META Stock
One great thing about technical analysis is that tons of indicators can help you in your analysis and attempt to answer the question, “Is Meta a buy or sell?” In this section, we’ll explain some of these indicators and explore what they have to tell us regarding Meta platforms stock.
Moving Averages
Moving averages are indicators that help to identify and understand trends of a stock’s price over time. There are two major types, the Simple Moving Average (SMA) and the Exponential Moving Average (EMA). When a stock's price crosses its moving average, it can signal a potential change in trend, making it a crucial trigger point for buying or selling decisions.
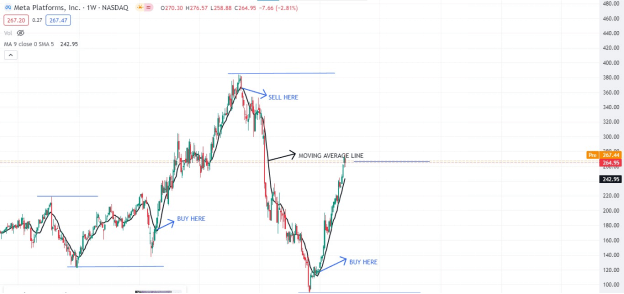
Credit: TradingView
Based on the chart, it’s evident that META stock price is still bullish since it is currently well above the moving average.
Relative Strength Index (RSI)
The Relative Strength Index (RSI) is a momentum oscillator in technical analysis that measures the speed and change of price movements of a stock. Generally, an RSI value above 70 indicates that a stock is potentially overbought (or overvalued), and an RSI value below 30 suggests that the stock is potentially oversold (or undervalued).
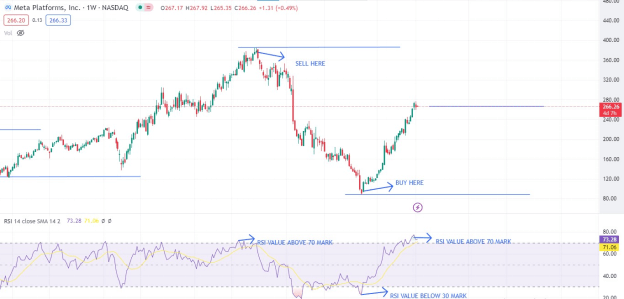
Credit: TradingView
From the META stock price chart example, we can see that the RSI value for META’s stock is currently above the 70 mark, thus indicating that this stock is currently oversold, and we should expect some retracement.
Bollinger Bands
Bollinger Bands are a widely-used technical analysis tool with multiple uses. They can be used to identify overbought and oversold conditions, identify volatility, predict price breakouts, and even identify trends. In detecting volatility, wider bands suggest high volatility, while narrower bands indicate low volatility.
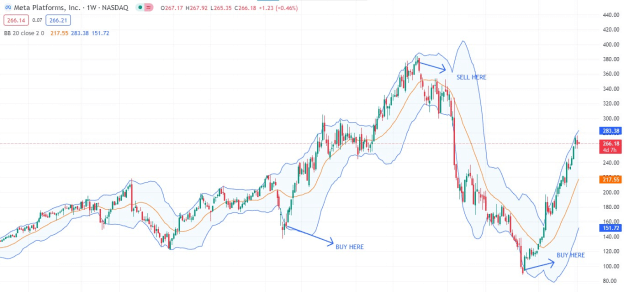
Credit: TradingView
The Bollinger bands for Meta stock are currently wide, thus indicating that there is high volatility at the moment. In addition to this, the fact that the META stock price is currently touching the upper band indicates that it may be overbought, thus corroborating the RSI analysis.
Moving Average Convergence Divergence (MACD)
The Moving Average Convergence Divergence (MACD) is a trend-following momentum indicator widely used in technical analysis of stock prices. It is primarily used to detect trend changes and momentum.
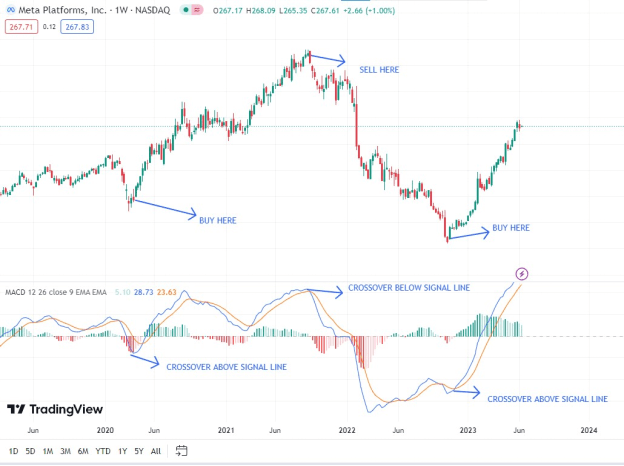
Credit: TradingView
A look at the indicator analysis above shows that the MACD line is above the signal line. This indicates a bullish trend, and it's corroborated by the fact that the histogram is also “green.”
How To Use Chart Patterns To Identify Potential Trading Opportunities
Asides from using indicators, you can also use chart patterns to identify potential trading opportunities. Here are some common chart pattern options to look out for when conducting Meta stock analysis:
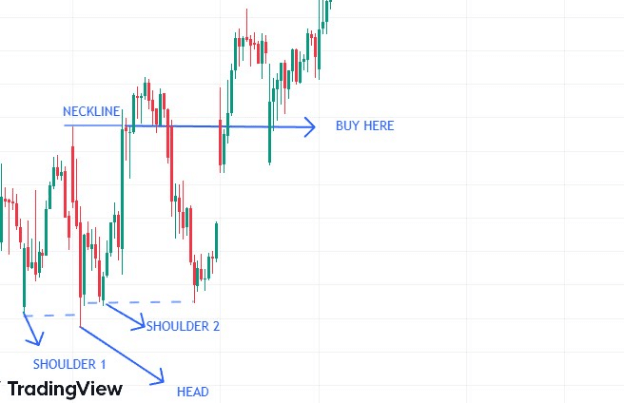
Head and Shoulders Pattern
This pattern consists of three peaks, with the middle peak (the "head") being the highest and the two other peaks (the "shoulders") being slightly lower. This pattern is seen as a reversal pattern, indicating that an upward trend may reverse into a downward trend.
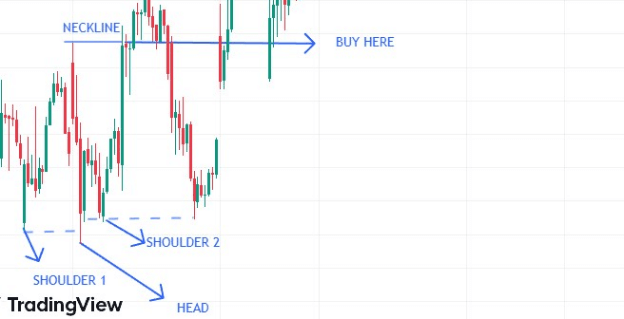
Credit: TradingView
Double Bottoms and Double Tops
These are reversal patterns. A double bottom forms after a prolonged downward trend when the price hits a low point twice with a moderate peak in between (forming a 'W'). A buy signal is triggered when the price breaks above the peak of the 'W'. Conversely, in a double top, a sell signal is triggered when the price breaks below the dip of the 'M'.
Credit: TradingView
The Falling Wedge Pattern
The Falling Wedge pattern is characterized by a narrow price range, which is defined by two downward-sloping trendlines. It is often interpreted as a bullish signal, especially when found in a downtrend. This pattern represents a period of consolidation before the price breaks out of the pattern, typically to the upside.
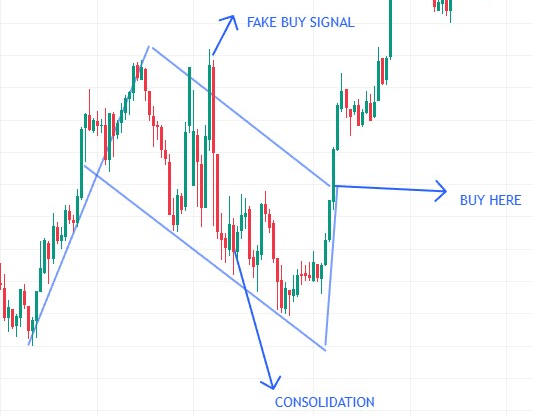
Credit: TradingView
Comparison of META's Performance to Its Industry and The Broader Market
Meta Platforms, Inc. is a dominating force in the technology sector and social media industry. The company boasts billions of users worldwide, creating an immense user base that drives significant ad revenue.
Compared to its industry peers, such as Twitter, Snap, and Alphabet (Google), META's performance stands out. Its strong user growth, high user engagement, and robust advertising network contribute to its impressive financial performance.
META stands out with an unprecedented year-to-date price appreciation of 126.5%. To put this into perspective, its closest rival, Alphabet Inc., has seen a price rise of only 40.2% within the same period.
Despite its robust performance, Meta Platforms Inc. (META) trades at a high Price-To-Earnings Ratio (32.6x), which is significantly higher than the average P/E ratio of 21.3x seen in the Global Interactive Media and Services industry.
Analysts' future growth forecasts for META might be contributing to its elevated P/E ratio. According to industry observers, the company's Earnings Per Share (EPS) are projected to increase at a rate of 5.6% per annum over the upcoming three years. This rate is notably lower than the anticipated 9.6% annual growth for the overall market.
Trading Strategies for Meta Platforms, Inc. (NASDAQ: META) Stock

Credit: iStock
Interested in employing technical analysis to purchase META stock? There are several trading strategies available. However, not all may be suitable for trading Meta stock. Some of these include the following:
Trend Following Strategies for META's Stock
Traders who use this strategy buy when the trend is upward and sell when the trend reverses. A significant advantage of this strategy is its simplicity and potential for high returns when trends are strong. Trend following strategies can also include built-in risk management approaches like stop-loss orders.
Cons
There’s the possibility that trends may be identified late, and this could potentially impact your ability to make maximum profits.
Trend following strategies are not recommended for periods of high volatility because they can lead to losses since price fluctuates rapidly in this period.
Mean Reversion Strategies for META's Stock
Mean reversion strategies operate on the assumption that prices will revert to their average over time. This strategy could be applied to META's stock when it diverges significantly from its historical average. This strategy provides a measure of predictability with its defined entry and exit points.
Cons
When using mean reversion strategies, you’ll often be trading against the prevailing trend. This could occasionally result in losses if the price doesn’t reverse as expected.
Timing and identification of false signals may also be challenging.
Breakout Trading Strategies for META's Stock
Breakout strategies involve buying or selling META's stock when it moves outside a defined range of prices, assuming that the stock will continue in the direction of the breakout. This strategy can provide significant profits if the breakout is strong. They also provide clear trade entry indications.
Cons
Potential for false or unsustained breakouts. These may lead to losses.
Breakout trading strategies often require a great deal of vigilance and quick action.
Potential Entry and Exit Points Based on Technical Analysis
As mentioned earlier, technical analysis can be used to identify potential entry and exit points for trading META's stock. For instance, you can use support and resistance levels as potential entry or exit points. When the stock price breaks out from a resistance level, it could be a good entry point, while a break below a support level could signal a good exit point.
Risk Management Strategies For Trading META's Stock

Credit: iStock
There are two major effective risk management strategies that could help you protect your equity when you’re trading META stock. They include the following:
Stop-Loss Orders: Stop-loss orders are essential for managing the risks of trading META's stock. A stop-loss order is set at a predetermined level to automatically sell the stock if the price drops to that level, thereby limiting potential losses.
Position Sizing: Position sizing involves determining how much of META's stock to buy or sell in a single trade. It's a critical risk management strategy that helps to mitigate the risk of significant losses.
Use of Fundamental Analysis To Complement Technical Analysis
While technical analysis focuses on price and volume trends, fundamental analysis looks at the intrinsic value of META's stock based on its financial performance and market conditions. Using fundamental analysis, You can better understand the underlying factors affecting the stock's value and potential growth prospects. It's a valuable tool for validating trading decisions based on technical analysis and developing a comprehensive investment strategy.
Potential Catalysts That Could Impact META's Stock Price

Credit: Pexels
As of today, 13th of June, Meta’s stock price is currently valued at $271.05. However, several events could affect this price valuation. Some of these include:
● Macroeconomic trends: This includes global trade tensions and interest rate changes; etc
● Industry-specific news: This includes changes in government regulations or new product launches from competitors; etc
● Company-specific events: Examples include earnings reports or changes in management; etc
For example, Apple recently announced the launch of a new product, the Apple Vision Pro. The Vision Pro is touted to be a groundbreaking innovative move and it has boosted Apple’s stocks. This could eventually adversely affect META stock prices.
There is also some speculation that META might be about to launch a new product capable of rivaling Twitter through Instagram.
Three Ways to Invest in META Stock


Ready to start trading META stock but unsure how to go about it? This section is for you! There are three major ways to trade META stock. They include the following:
Holding the Share
This is the traditional method of investing in a company's stock, including Meta Platforms Inc. (NASDAQ: META). Here, you’ll buy the shares outright, often through a brokerage, and then hold them in your portfolio for an extended period with the expectation that the share price will increase. For example, buying 10 shares of META at $300 each would cost $3000. If the share price rises to $330, your investment is now worth $3300, netting a profit of $300.
Cons: This investment method requires a substantial upfront investment, and selling shares can take time.
Options
Options are derivatives that give the holder the right (but not the obligation) to buy (call option) or sell (put option) a stock at a predetermined price within a specific timeframe. For example, you might buy a call option for META that allows you to purchase the stock at $320 anytime within the next three months. If the stock price rises to $350 within that period, you can exercise your option and buy the shares at the lower price, then potentially sell at the higher market price for a profit.
Cons: Options can be complex and risky, especially for inexperienced traders. The potential for losses is also high.
Contracts for Difference (CFD)
CFD trading is a form of derivative trading that allows investors to speculate on the rising or falling prices of fast-moving global financial markets (like stocks) without owning the underlying asset. For example, instead of purchasing 10 META shares, you might buy 10 META share CFDs. If the price of META shares increases by $30, you will make the same profit as if they owned the shares directly, but without the need for the full capital outlay.
CFDs provide a way to trade on margin, meaning you can gain exposure to a large amount of META stock without committing the full cost upfront. They also allow you to profit from falling (as well as rising) prices.
To trade CFDs, you’ll need a CFD provider. Don’t know any? Not to worry, we have an excellent recommendation for you, VSTAR. Why VSTAR? Read on to find out!
Why Trade META Stock CFD with VSTAR

Here are a few key advantages you'll enjoy by trading META stock CFDs with VSTAR:
Narrow Spreads: VSTAR ensures you’ll have access to very narrow spreads, thereby decreasing your trading expenses. This means you'll enjoy optimal spreads when trading META stock.
Utilizing Leverage: VSTAR offers you the capability to optimize your META stock trading through leverage, enabling you to open more substantial positions with a smaller upfront investment.
Exceptional Customer Assistance: VSTAR has a committed and responsive support team that is always ready to address your queries, promising an effortless trading journey.
Trading Flexibility: With VSTAR, you can capitalize on both rising and falling prices in META stock, broadening your trading potential.
VSTAR offers a user-friendly app that suits experienced traders as well as newcomers. The app comes with a host of features, including a minimum deposit requirement of just $50, protection from negative balances, real-time access to high-demand markets, and the availability of demo accounts for practicing trades without risk.
How To Trade META Stock CFD With VSTAR
● Download the VSTAR app from the App Store or Google Play and set up an account.
● Load funds using your chosen payment method. Options include Visa, Mastercard, Tether, Skrill, Netteller, SticPay, or Perfect Money.
● Look for META stock in the app and tap on it to launch the trading interface.
● Determine your trade size, leverage, stop loss, and take profit levels.
● Based on your assessment of the market and expectations, decide whether to buy (go long) or sell (go short) META stock CFD.
● Confirm your trade and keep an eye on your position until it is closed or your stop loss is reached.
Conclusion
Technical analysis allows traders to make significantly more profits with minimal risk; however, it is more effective when used with fundamental analysis. The best way to get the most out of META stock trading is to leverage CFD trading and all it offers using CFD trading providers like VSTAR. Remember, however, that while trading offers the possibility of making significant profits, it also carries some risk, so proper risk management is essential.