Introduction
Nvidia Corporation and its stock (nasdaq: nvda)
The Nvidia Corporation, also known as Nvidia, is a well-known technological business specializing in creating artificial intelligence (AI) and graphics processing unit (GPU) technologies. The NASDAQ stock exchange lists the company's stock under the ticker NVDA.
Nvidia's current popularity as a hot AI stock
Due to its dominant position in the AI business, Nvidia has significantly increased in popularity among investors. The GPUs made by the firm are extensively used in a wide range of applications, including machine learning, driverless vehicles, data centers, and gaming. Nvidia's goods and solutions are in great demand as AI develops and transforms numerous industries, which boosts its stock price.
This article seeks to educate traders on the stock performance of Nvidia and highlight the value of technical analysis in making wise trading choices. We will look into the history of Nvidia Corporation, analyze NVDA stock technically, talk about short-term CFD trading techniques, look at long-term stock holding strategies, and offer advice on buying NVDA stock.
Background on Nvidia Corporation
Brief History of Nvidia Corporation
When Nvidia was first established in 1993, it primarily produced graphics cards for video games. The company has diversified into AI technologies over the years and extended its product line, which has turned into its primary growth driver. Nvidia is now regarded as a pioneer in AI computing on a worldwide scale.
Overview of the company's financial performance and recent trends
In recent years, Nvidia has seen impressive financial growth. Its most recent profit margin, in 2023, is 16.19%. Its revenue was reported as $26.97 billion. The revenue per share is $10.85, and the gross profit is $15.36 billion.
As demand for GPUs and AI-related products rises, the company constantly posts impressive revenue and profit numbers. Nvidia has firmly established itself as a major player in the AI field because of its cutting-edge products and business alliances.
Why Nvidia Stock is considered a hot AI stock
Because it can provide high-performance GPUs specifically designed for AI applications, Nvidia has dominated the AI market. Leading technological firms and academic institutions frequently use the company's GPUs to build deep learning models. Nvidia stays at the forefront as AI continues transforming industries like healthcare, banking, and autonomous vehicles, making it a highly sought-after stock for investors.
Technical Analysis of NVDA Stock
Technical analysis and its importance for traders
By examining historical price and volume data, technical analysis is a technique for assessing financial markets and securities. Technical analysis is a tool used by traders to find patterns, trends, and indicators that can be used to forecast future price movements. It aids traders in making knowledgeable judgments and offers insightful information about market mood.
Technical analysis and its role in stock trading
To comprehend a stock’s supply and demand dynamics, technical analysis entails reviewing price charts, using indicators, and examining trade activity. It aids traders in locating levels of support and resistance, trends, and possible price reversals.
How technical analysis can be used to predict future stock prices
Technical analysis looks for recurrent patterns that can shed light on potential market movements in the future by examining historical price patterns and indicators. Traders use various tools and indicators to evaluate the likelihood that a stock's price will continue its present trend or change direction.
Overview of NVDA's historical stock performance
Historical stock price trends of NVDA
By examining historical stock price information for NVDA, traders can see patterns and trends that can guide their decisions. Traders can spot important levels of support and resistance and potential regions for price breakouts or reversals by analyzing price movements over a range of timeframes.
While the NVDA stock price is very high as of late, it has reached an all-time high, which shows how much strength is still there. The market continues to look favorably on NVDA, and history shows that when it falls, buyers often look to take advantage of perceived value.
Key factors affecting NVDA's stock price
To conduct a comprehensive technical analysis of NVDA, it is crucial to consider the key factors influencing its stock price. These factors include:
Industry Trends: The overall performance of the AI market and developments in GPU and AI-related technology may impact NVDA's stock price. Increased usage of AI solutions and favorable industry developments may boost investor confidence and support the stock's upward trend.
Earnings and Financials: Nvidia's quarterly and annual financial reports greatly impact investor mood. The stock price may increase in response to strong revenue growth, increased profitability, and optimistic guidance, while a stock's value may decrease in response to negative financial outcomes.
● The most recent earnings call in May of 2023 saw the stock explode to the upside, as the demand for NVDA’s products is expected only to increase as artificial intelligence is suddenly at the forefront of the technology sector.
Macroeconomic Factors: The price of NVDA's stock can be impacted by broader economic variables, including interest rates, inflation, and worldwide market developments. Economic uncertainty, geopolitical developments, or shifts in consumer buying habits may impact investor perception of the stock.
That being said, the biggest influence is artificial intelligence currently, and therefore Nvidia faces significant tailwinds and should continue to benefit from them.
Competition and Partnerships: Market competition is fierce where Nvidia does business. Investors carefully monitor the company's ability to hold market share and preserve an advantage over rivals. Strategic alliances and partnerships with other tech businesses can influence the price of NVDA's shares by indicating growth potential and market expansion.
There are a multitude of competitors for NVDA to worry about. This is a short list of some of the largest ones:
● Taiwan Semiconductor Manufacturing (TSM)
● Meta Platforms (META)
● Alphabet (GOOGL)
● Microsoft (MSFT)
● Oracle (ORCL)
News and Events: The stock price can be significantly impacted by the news, product launches, regulatory changes, or legal challenges about Nvidia or the AI sector. To spot future price fluctuations, traders must keep up with recent news and happenings.
Investor Sentiment: The price of NVDA's shares can be impacted by speculative activity, investor perception, and market sentiment. A rally can be fueled by favorable news coverage, analyst recommendations, and investor confidence in the company's long-term prospects. In contrast, a sell-off might result from unfavorable sentiment or market pessimism.
Analysis of NVDA's current stock price and trends
Overview of NVDA's Current stock price and Performance
Traders should study the recent performance and patterns of NVDA to determine the current stock price. Real-time analysis of price changes, trade activity, and market dynamics is required. It can be useful to look at the stock's performance over various timescales, such as daily, weekly, and monthly charts, to see trends and possible trading opportunities.
Analysis of key technical indicators for NVDA
Technical indicators are essential tools in technical analysis to gain insights into a stock's price movements. Let's examine a few key technical indicators for NVDA:
Moving Averages: Moving averages reduce price volatility over a certain time period, which makes it easier to spot trends. The 50-day and 200-day moving averages are frequently used by traders to pinpoint short- and long-term trends, respectively. These moving average crossovers suggest potential buy or sell opportunities.
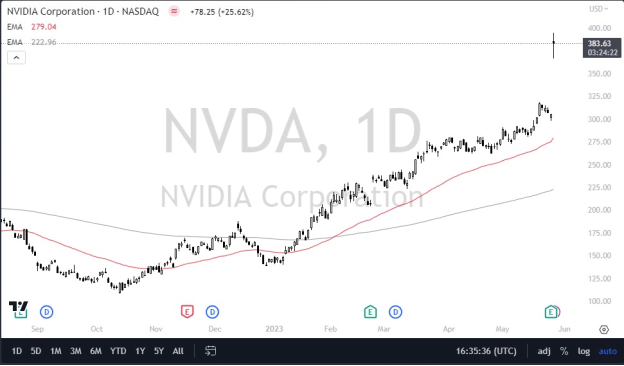
The 50 and 200-Day EMA on an NVDA daily chart.
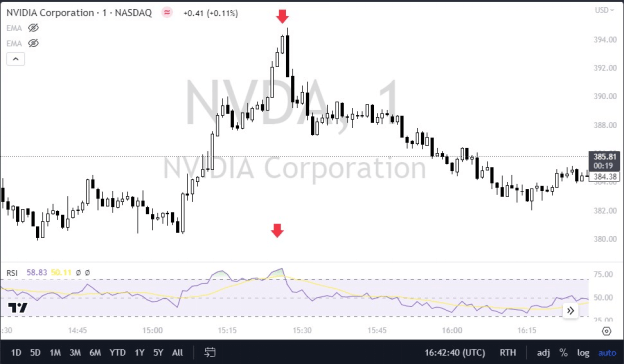
Relative Strength Index (RSI): The RSI gauges how quickly and how much prices change. Between 0 and 100, it oscillates, with readings over 70 suggesting overbought situations and under 30 indicating oversold ones. RSI is a tool traders use to spot future trend reversals or continuations.
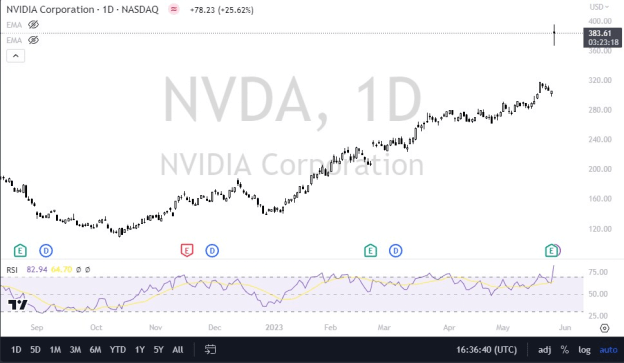
RSI on an NVDA chart, showing when the stock becomes overbought or oversold.
Bollinger Bands: Bollinger Bands comprise an upper and lower band that indicate standard deviations from the moving average and a moving average (usually a 20-day moving average). They aid in determining when volatility is high or low. Overbought situations are indicated when the price contacts or crosses the upper band, and oversold conditions are shown when the price touches or crosses the lower band.
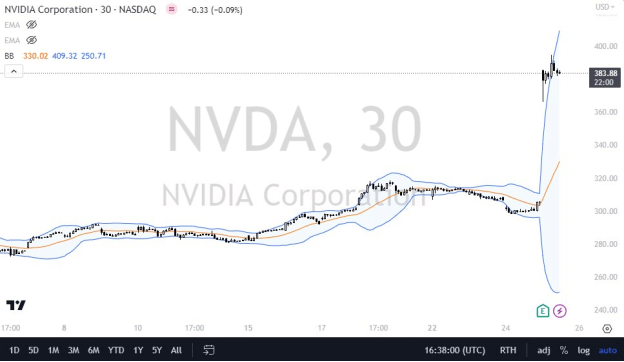
Bollinger Bands can show both overbought and oversold conditions. In this 30-minute NVDA chart, notice the volatility explosion after the earnings call.
MACD (Moving Average Convergence Divergence): The MACD is a momentum trend-follower that depicts the connection between two moving averages. As potential buy or sell signals, traders watch for crosses between the MACD and signal lines.
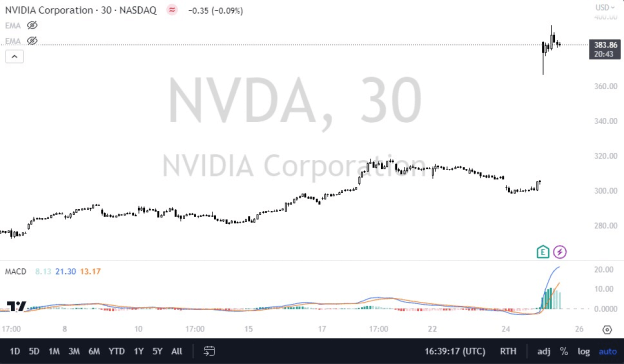
NVDA chart on a 30-minute timeframe, with the MACD attached. This shows upward momentum after the lines crossed below and started rising.
Results of technical analysis interpretation and trading strategy implications
NVDA technical analysis findings interpretation might offer traders useful information for creating trading strategies. Based on the examination of technical indicators, the following potential consequences are listed:
A positive trend is indicated if the price of NVDA's stock is trading above its moving averages, notably the 50-day, and 200-day moving averages. In anticipation of continued price growth, traders may consider taking on long holdings or holding onto current ones.
If the RSI for NVDA shows that it is overbought (over 70), this could portend a price consolidation or correction. To safeguard their positions, traders may consider taking gains or applying risk management techniques.
Volatility data can be gleaned from Bollinger Bands. If the price continuously hits or crosses the upper band, the stock may be overextended and due for a potential downturn. Conversely, the bottom band may touch or cross to signal oversold circumstances and a potential buying opportunity.
Crossovers between the MACD line and the signal line, such as when the MACD line crosses over the signal line, can imply either a bullish or bearish trend. Based on these crossings, traders might consider opening long or short positions.
Technical analysis should be used with other analysis and risk management techniques because it is not always accurate. To make informed trading selections, traders should also consider fundamental variables, recent news stories, and market circumstances.
Short-term CFD Trading Strategies for NVDA
CFD trading and its advantages for short-term traders
Without holding the underlying asset, traders can speculate on how its price will change by using contracts for difference (CFDs). CFD trading has several benefits for short-term traders, including leverage, the versatility to profit from rising and falling markets, and the ability to carry out deals quickly.
Key factors to consider when developing a CFD trading strategy for NVDA
Traders should consider elements like market trends, volatility, news events, and technical analysis indicators when creating a CFD trading strategy for NVDA. They should establish clear entry and exit points, develop risk management guidelines, and carefully monitor market circumstances. That being said, it is not an exhaustive list, but these are some of the most important things to pay attention to.
CFD trading strategies for NVDA
Scalping: Scalping is a short-term trading technique designed to capitalize on minute price changes. The goal of traders utilizing this approach is to capture tiny gains repeatedly throughout the day by opening and closing positions quickly, frequently in minutes or hours. Moving averages and RSI are two technical analysis indicators that can be used to find possible NVDA scalping chances.
One-minute chart of NVDA, using the ESI to show overbought signals.
Swing Trading: Swing trading maintains positions for a few days to a few weeks to profit from intermediate-term price fluctuations. With this tactic, traders hope to profit from temporary price reversals inside the larger trend. Swing trade entry and exit points in NVDA can be determined using technical analysis indicators and support and resistance levels found through chart analysis.

NVDA had resistance at the $190 level. Once the market broke above there, swing traders held onto the stock.
Potential risks and benefits of CFD trading NVDA
Potential advantages of CFD trading include leverage, liquidity, and flexibility. However, it has hazards, such as the chance that losses could exceed the initial investment because of leverage, market volatility, and quick price changes. To mitigate these risks, traders should be aware of them and use tactics like diversifying their portfolios and placing stop-loss orders.
Long-term Stock Holding Strategies for NVDA
Advantages of long-term investing in NVDA
NVDA long-term investing gives investors a chance to share in the long-term growth potential of the business. By adopting a long-term outlook, investors can profit from capital growth, dividends, and the compounding effect of reinvesting returns over time. Long-term investors can also match their investment plan with Nvidia's operational principles and prospective growth.
Key factors to consider when developing a long-term investment strategy for NVDA
Investors should consider aspects like the company's competitive position in the AI market, technological breakthroughs, financial stability, and management team when formulating a long-term investment strategy for NVDA. Making wise judgments about your long-term investments requires understanding Nvidia's growth factors, market prospects, and potential hazards.
Long-term investing strategies for NVDA
Dollar-Cost Averaging: Regardless of NVDA's current price, dollar-cost averaging entails making regular investments of a certain sum. By employing this method, investors might increase their shareholdings during market downturns while reducing the effects of short-term price volatility. Dollar-cost averaging has the potential to smooth out the overall cost base over time and lessen the effects of market timing.
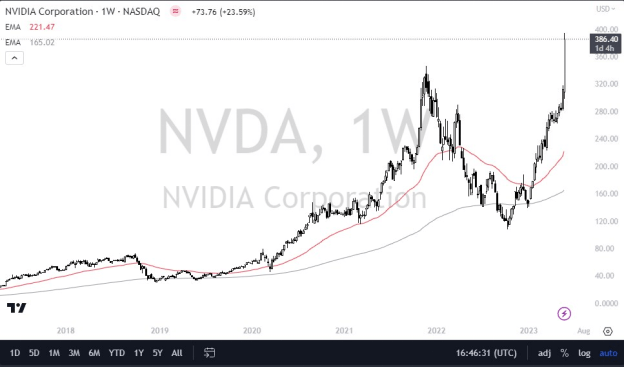
A long-term chart of NVDA. Any time this market has fallen, it ends up being a buying opportunity if you are patient enough.
Portfolio Diversification: Spreading investments over several asset classes, industries, and geographical areas is the concept of diversification. Investors can lower the risk associated with particular stocks and industries by diversifying their holdings. A diversified portfolio that includes NVDA can maximize its growth potential while reducing certain stock-related risks.
Potential risks and benefits of long-term investing in NVDA
Long-term investment in NVDA offers potential rewards, including capital growth, dividends, and the chance to gain from the expansion of the AI business. Investors can take advantage of the compounding impact and weather short-term market swings by holding the stock for a while.
There are dangers to take into account, though. Market turbulence, economic downturns, and industry-specific difficulties may impact the price of NVDA's shares. Additionally, technological developments, shifting market dynamics, and competition within the AI industry may jeopardize Nvidia's long-term growth potential. Investors should evaluate these risks and conduct due diligence to ensure their investment thesis is still valid.
How to Invest in NVDA Stock
Three ways to invest in NVDA stock
Hold the Share: Purchasing and owning NVDA shares directly through a brokerage account constitutes a traditional investment. By using this procedure, ownership, dividends, and voting rights are granted. However, the initial capital input is higher, and the only factor affecting returns is an increase in the stock price.
Options: Trading options entail purchasing or disposing of the right to purchase or dispose of NVDA shares at a predetermined price within a predetermined timeframe. Options provide flexibility and leverage but necessitate extensive knowledge and trading expertise.
CFDs: Without owning the underlying shares, traders can speculate on the price changes of NVDA using contracts for difference (CFDs). Leverage, the opportunity to profit from both rising and falling markets and the simplicity of speedy trade execution are some advantages of CFD trading. It is significant to remember that CFDs involve risks, including counterparty and leverage-related losses.
CFDs also allow the trader to enter and exit with unique position sizes, unlike options. The ability to adjust position sizing is a major advantage.
Why trade NVDA Stock CFD with VSTAR
VSTAR offers a dependable and simple-to-use platform for trading NVDA Stock CFDs. To improve the trading experience, VSTAR provides competitive pricing, sophisticated trading tools, real-time market data, and various order types. Additionally, VSTAR gives users access to learning materials and 24/7 customer service to help traders succeed.
How to trade NVDA Stock CFD with VSTAR - Quick Guide
Traders can trade NVDA Stock CFDs with VSTAR through a simple process:
Open an Account: Sign up for an account on the VSTAR platform by following the registration process. This process will include a few steps to verify identity before placing a transaction. This is a required step that will help all reputable brokers.
Fund Your Account: Deposit funds into your VSTAR trading account using the available payment methods.
Search for NVDA Stock: Use the search function on the VSTAR platform to find NVDA stock. It should be listed as NVDA or Nvidia Corporation. This will allow you to pull up the chart and set up your trade.
Analyze the Market: For trading NVDA Stock CFDs, VSTAR offers a secure and straightforward platform. VSTAR provides competitive pricing, cutting-edge trading tools, real-time market data, and various order types to make trading more enjoyable. To help traders make informed trading decisions, the platform also gives users access to instructional materials and customer assistance.
Place a Trade: Place your NVDA Stock CFD trade after you have examined the market and chosen your trading approach. Set your chosen entry and exit locations, the transaction size, and whether you want to go long (buy) or short (sell).
Monitor and Manage Your Trade: Watch your NVDA Stock CFD trade while it is open. You can monitor price changes, place take-profit, and stop-loss orders to control risk and modify your transaction if market circumstances change.
Close Your Trade: Execute the order on the VSTAR platform when closing the trade. The difference between your entry and exit prices will determine whether you made a profit or a loss.
Conclusion
Because of its dominant position in the AI market and cutting-edge technologies, Nvidia (NVDA) has significantly increased in popularity as a hot AI stock. Understanding the stock performance of NVDA and making wise trading decisions depend heavily on technical analysis.
Trading opportunities in NVDA can be found by looking at various technical indicators, past price movements, and market analysis. Scalping and swing trading are examples of short-term CFD trading tactics that offer flexibility and the possibility for quick gains. Considering the company's development prospects and long-term industry trends, long-term investors may benefit from holding NVDA shares.
Investors can hold shares, trade options, or trade NVDA Stock CFDs, among other alternatives, when investing in NVDA. Advantages of trading NVDA Stock CFDs with VSTAR include leverage, flexibility, and access to cutting-edge trading tools.
In conclusion, traders and investors may successfully traverse the NVDA market and take advantage of the potential chances given by this top AI stock by combining technical analysis with appropriate trading tactics.