Introduction
The Standard & Poor's 500 Index, also known as the S&P 500, is a stock market index that tracks the performance of 500 of the largest publicly traded companies in the United States, as measured by market capitalization. First introduced in 1957, the S&P 500 is a numerical indicator of the U.S. economy. It is the best indicator of large-cap U.S. equities, representing approximately 80% of available market capitalization.
Companies with a market capitalization of at least $10 billion are considered large-cap stocks. The index aims to represent the U.S. large-cap market proportionately, so if a particular sector, such as pharmaceuticals, represents 5% of the total U.S. large-cap market, the index will include companies in that proportion.
The S&P 500 is not a fund that investors can buy into directly. Instead, asset management companies offer S&P 500 index funds, which are funds that track the index. It is also traded through futures, ETFs and CFDs.
The S&P 500 Index is important to traders and investors for several reasons. It serves as the market benchmark against which all other investments are measured. The broad market breadth of the index provides a comprehensive view of the economic health of the United States, making it a valuable indicator for investors and traders.
The S&P 500 contains the companies most commonly owned by individual investors because it is a broad basket of stocks that does not include too many small or obscure companies. This makes it a good benchmark for various industries and an indicator of a particular stock exchange or group of stocks.
Investing in the S&P 500 is a prudent way for long-term investors to enter the stock market because it has a history of positive returns. It also offers diversification and low costs, making it an attractive investment option for many investors. However, because investors cannot invest directly in the index, asset management companies offer S&P 500 index funds, which are funds that replicate the index.
What is the S&P 500 Index?
The S&P 500 Index, also known as the Standard & Poor's 500 Composite Stock Price Index, is a stock market index that tracks the performance of 500 large-cap U.S. companies. It represents the performance of the stock market by reflecting the risks and returns of the largest companies and is widely used as a benchmark for the overall market against which all other investments are compared. The index covers approximately 80% of the available market and is considered the best indicator of large-cap U.S. equities.
The S&P 500 was created in 1957 to track the value of the 500 largest companies on the New York Stock Exchange. Created by Standard and Poor's, it is a float-weighted index, meaning that the number of shares available for public trading adjusts the index's market capitalization. From 1969 to 1981, the index was gradually expanded to include more companies and better reflect the American stock market.
The S&P 500 is composed of 500 large-cap U.S. companies from a wide range of industries and sectors. Some notable companies in the list of S&P 500 companies include tech giants like Apple, Microsoft, and Amazon, as well as financial institutions like JPMorgan Chase and Bank of America. Other well-known companies include Procter & Gamble, Coca-Cola, Walmart, and Johnson & Johnson. The list of S&P 500 companies is regularly reviewed and updated to ensure representation of the largest and most influential companies in the U.S. stock market. It serves as a valuable resource for investors looking to diversify their portfolios and gain exposure to a broad range of industries.
As of March 20, 2023, the top 10 holdings in the S&P 500 Index and their weightings are as follows:
- Apple (AAPL): 7.09%
- Microsoft (MSFT): 6.13%
- Amazon (AMZN): 4.25%
- Alphabet (GOOGL and GOOG): 3.21% and 3.13%, respectively
- Tesla (TSLA): 2.07%
- NVIDIA (NVDA): 1.84%
- Berkshire Hathaway (BRK.B): 1.59%
- Meta (formerly Facebook) (FB): 1.54%
- UnitedHealth Group (UNH): 1.49%
- JPMorgan Chase (JPM): 1.32%
S&P 500 Sectors Weight
Here is a breakdown of sector weights in the S&P 500 Index through August 2023:
Information Technology - 27.5%
Health Care - 13.7%
Financials - 11.2%
Communications Services - 10.5%
Consumer Discretionary - 10.4%
Industrials - 8.2% Consumer Staples
Consumer Staples - 6.9% Energy
Energy - 4.4% Utilities
Utilities - 3.2% Real Estate
Real Estate - 2.8% Materials
Materials - 2.6%
The top 3 sectors - Information Technology, Health Care and Financials - account for over 50% of the S&P 500. Information Technology is the largest sector, driven by large technology companies such as Apple, Microsoft, Amazon and others. Healthcare and Financials also have significant weight due to large companies such as UnitedHealth, J&J, Berkshire Hathaway, JPMorgan Chase, etc.
What is SPX
SPX is the ticker symbol for the S&P 500 Index. SPX refers specifically to the S&P 500 stock index and related futures, options and other derivatives traded on various exchanges. It serves as a proxy for the larger U.S. stock market.
NASDAQ vs SP500
The NASDAQ and the S&P 500 are both prominent stock market indexes in the United States, but they have some key differences.
The NASDAQ focuses primarily on technology companies and includes many well-known tech giants such as Apple, Microsoft and Amazon. It tends to be more growth-oriented and can be affected by the performance of the technology sector.
The S&P 500, on the other hand, is a broader index that includes companies from a variety of sectors, providing a more diversified representation of the overall market. It includes companies from technology, health care, financial services, consumer discretionary and other industries. The S&P 500 is often used as a benchmark for the overall health of the U.S. stock market.
While both indices can experience similar trends, such as reaching all-time highs or experiencing market downturns, the specific composition of companies included in each index can lead to differences in performance. Investors may choose to invest in either or both indices based on their investment objectives, risk tolerance and desired sector exposure.
How to invest in the S&P 500
You may be wondering how to buy S&P 500, there are three main ways to invest in S&P 500: through individual stocks, the contract-for-difference market, or through a fund, such as an index fund or exchange-traded fund (ETF). When trading the S&P 500, professional traders often prefer to trade during the main market hours, when liquidity is higher and spreads are tighter.
The best way to invest in S&P 500 is to buy ETFs or index funds that track the index. Both approaches have differences and are worth considering based on individual investment strategies. Portfolio managers and asset managers often use exact replication strategies, holding all 500 stocks in the same proportion as their weight in the index.
Another option is to invest in S&P 500 index funds, which provide diversified exposure to the core of the U.S. stock market. These passively managed funds track the large-cap stocks that make up the index. Day traders may find the best time to trade the S&P 500 Index is during the U.S. day trading futures market, which opens at 9:30 a.m. EST.
Trading spot S&P 500 via an ETF or futures can be a great way to gain exposure, but it depends on your situation. You can also trade in the CFD market, which allows you to gain more leverage and trade just as quickly on the long side (buying) as on the short side (selling).
CFD markets typically have more leverage and can be tailored to your needs. Unlike a futures contract, you can trade in much smaller amounts, allowing most people to gain access to exposure. Many traders find that the margin needed in the futures market is far too much for them to handle.
Spot SP500 Trading
The value of the S&P 500 index fluctuates continuously throughout the trading day based on the performance-weighted market data of the underlying companies. The S&P 500 trades almost 24/5, and professional traders prefer to trade during its main market hours (9:30 AM to 4:00 PM Eastern Time) due to higher liquidity and tighter spreads. While the spot index isn't an actual trading instrument, many brokers offer it in a platform such as Metatrader 4 or 5, and it simply follows the action in the index itself as the trading day moves.
However, it's worth noting that a spot index is only open when the actual market is. The problem with this is that you may need to be on the right side of an opening gap if news hits before the market opens.
CFD SP500 Trading
The CFD SP500 market trades around the clock, 24/5. The market acts much like the futures market, allowing traders to place trades after and before the market opens. This is a significant advantage over typical spot trading, as the CFD trader can react to news in real time rather than waiting for the US markets to open.
Factors Affecting the S&P 500 Index
To trade the S&P 500, or any other market, it is crucial to understand some of the biggest influences.
Some of the most significant macroeconomic, interest rates, inflation, and many other things that influence the S&P 500 include:
Gross Domestic Product (GDP): The GDP measures a country's economic output, and its growth or decline can influence the stock market. A strong GDP signifies a robust economy, which can positively impact the S&P 500, while a weak GDP can signal economic weakness and negatively affect the index.
Unemployment Rate: The unemployment rate is another critical indicator of the strength or weakness of the economy. A high unemployment rate may imply a sluggish economy, negatively affecting the stock market. In contrast, a low unemployment rate signifies a healthy economy and can positively impact the S&P 500.
Interest Rates: Changes in interest rates, particularly those set by the Federal Reserve, can significantly influence the S&P 500. Higher interest rates can increase business borrowing costs, leading to lower corporate profits and a decline in stock prices. Conversely, lower interest rates stimulate economic growth by reducing borrowing costs and higher stock prices.
Inflation: Inflation can also have an impact on the S&P 500. High inflation can erode purchasing power and lead to higher interest rates, negatively affecting stock prices. On the other hand, low inflation can be positive for stocks, as it can encourage consumer spending and economic growth.
Durable Goods Orders: Durable goods orders are a key indicator of economic growth, impacting production levels in other industries. Strong durable goods orders can signal a healthy economy, which may positively influence the S&P 500, while weak orders may indicate an economic slowdown and negatively affect the index.
Geopolitical Events: Geopolitical events, such as wars, terrorist attacks, or international conflicts, can create uncertainty in financial markets, leading to fluctuations in the S&P 500. For example, the S&P 500 price-to-earnings (P/E) ratio experienced a significant derating in response to macroeconomic and geopolitical shocks.
Trading Strategies for Investing in the S&P 500 Index
“Buy and hold” works over the long term, as the S&P 500 typically returns 8% a year.
One of the most common strategies for long-term investing in the S&P 500 Index is simply to buy and hold. After all, the market has historically gone up over the long term, and many traders are not really traders, but rather investors. It's very common for investors with longer-term retirement accounts to simply "dollar-cost average" their position, meaning that they buy an ETF or something else to follow the S&P 500 occasionally, assuming that the market will eventually rise by the time they cash out.
Short-term trading strategies include a variety of technical indicators, trend-following strategies, and even the use of algorithms, which are high-frequency trading strategies. However, it is difficult to describe the perfect short-term strategy for a particular trader because we are all wired differently. Nevertheless, short-term traders are typically in and out of the market in as little as a few minutes or perhaps as long as a few days. Most traders use some form of technical analysis to make these decisions. However, if you are going to use short-term trading strategies, it takes a considerable amount of discipline to take losses when you are proven wrong.
ETFs and mutual funds are available to invest in the S&P 500 Index, but they are typically used by longer-term traders. Yes, you can trade an ETF like SPY quite easily, but mutual funds are a bit "bulkier" in terms of getting in and out of a position, so they are typically only for long-term traders.
Technical Analysis of the S&P 500 Index
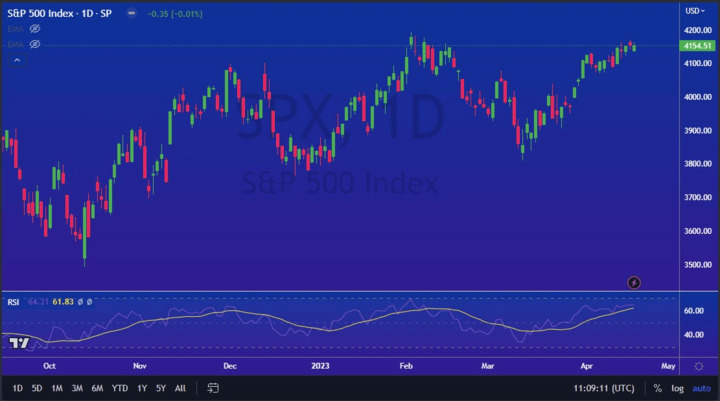
Technical Analysis - RSI shows overbought and oversold conditions
Technical analysis of the S&P 500 index works like almost anything else, as you use many of the same indicators. Trendlines, moving averages, and the Moving Average Convergence Divergence indicator are some of the most common. The Relative Strength Indexes are quite often used to determine whether or not a market is overbought or oversold, which works the same with the S&P 500. The RSI also features two levels on the oscillator that make it easy to determine when the market has rallied too quickly, or fallen too quickly.
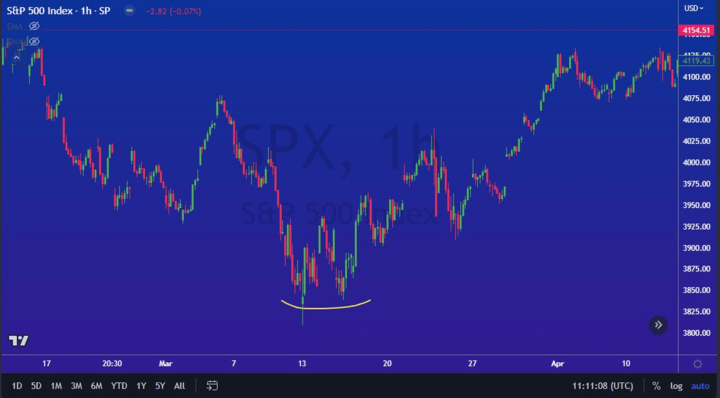
There are hundreds of chart patterns to watch out for, but some of the most common ones are triangles, bullish flags, bearish flags, head and shoulder/inverted head and shoulder patterns, and rectangles. A favorite of many traders is shown in the chart below. It's called a "double bottom" and it's when the market tries to break down twice, but fails both times. This can indicate that buyers are ready to take over. However, traders usually find a handful of patterns that they are comfortable with and stick with them.
Either way, you must pay close attention to your technical analysis, as your risk management strategies will depend on it. In other words, if there is a spot in the market where the trade has been "proven wrong," then you simply need to get out. Before entering the market, you need to know where the market is most likely to go, but you also need to understand where you would be wrong. At that point, you must exit the position and reevaluate the situation.
S&P 500 Heat Map
An S&P 500 Heat Map is a visual representation of the performance of individual stocks within the S&P 500 Index. It uses color coding to show the relative performance of each stock.
In a heat map, each stock is represented by a square or rectangle, and the color of the square represents how the stock has performed. Typically, a green color indicates positive performance (e.g., stock price increase), while a red color indicates negative performance (e.g., stock price decrease).
The heat map is usually organized in a grid format, with rows and columns representing the different stocks in the S&P 500 index. The arrangement of stocks can vary, with some heat maps sorting stocks by industry or sector, while others may follow a different organization.
Heat maps can be used as a visual tool to quickly identify trends, spot outliers, or identify sectors that are performing well or poorly within the S&P 500 Index. They provide a snapshot of overall market performance and help investors make informed decisions about their investments.
Fundamental Analysis of the S&P 500 Index
There are many economic indicators and news releases that you need to pay close attention to when trading the S&P 500. The most obvious is the earnings season, when companies report financial numbers to the market. Remember that when some of the more prominent companies report earnings, it can have a "ripple effect" on the entire index.
However, you should also keep in mind that the United States is a consumption-driven economy, so other indicators such as unemployment figures, GDP, and CPI can come into the picture to give traders an idea of how the profitability of the various companies that make up the index may be affected by the macroeconomic environment in the United States.
Interest rates also have a significant impact on the index because the cost of borrowing money can have a considerable influence on hedge not only funds or more significant money funds that get involved in the market but also companies and what they plan on doing as far as expansion plans and whether or not they are going to see the ability to expand in the market.
It's probably also understanding that there sometimes are correlations between the S&P 500 and many other markets, one of the most obvious being the US dollar. Quite often, when the US dollar strengthens, it does have a detrimental effect on the S&P 500, as a lot of people are often concerned about whether or not the higher cost of American goods across the planet will hurt exports, just as a cheaper US dollar makes those goods easier to sell in places like Germany, Japan, Africa, Russia, and so on.
Trade SP500 CFD with VSTAR
Trading the SP500 CFD is easy at VSTAR, with its mobile enhanced trading experience App, you can trade anywhere anytime. Furthermore, VSTAR offers a significant amount of regulation and licensing behind the brokerage, meaning that your funds are kept most professionally, keeping your account safe.


VSTAR also offers significant educational materials and is constantly working on its backend to improve customer service. Not only does VSTAR offer generous leverage, but it also provides a multitude of other markets that you can trade in, allowing you to focus on global financial conditions.
Conclusion
In conclusion, trading the S&P 500 is a great way to get exposure to the entire US stock market, as it comprises the top 500 companies in the United States. It is considered a more diversified way to play the stock market instead of trying to pick individual companies, and of course, it is the most prominent index in the world. This means there should be plenty of liquidity any time you trade.
It's worth noting that there are many strategies and ways to trade the S&P 500, as most people with a retirement fund are involved. The most common allocations to US assets in retirement accounts tend to be the ETF SPY, or a mutual fund that tracks the S&P 500. Because of this, it does have the propensity to go higher over the longer term as more retirement money enters the market.
That's not to say the market can't fall because it certainly does. It can be quite volatile during economic uncertainty, so it's not always the best strategy to throw money at the market. However, if you have a long enough timeline, the reality is that the market is likely to continue seeing buyers that will help your position. However, if you are looking to trade the market, you need to find short-term strategies using technical analysis that can give you an idea of which direction the market may move over the next swing.
Use risk management strategies regardless, as protection of your trading capital will continue to be the most important thing when getting involved. Remember, using the CFD market is a great way to take advantage of price fluctuations, and using a heavily regulated and licensed broker like VSTAR is your first step.