I. Introduction
Overview of technical analysis for EUR USD CFD trading
Technical analysis is a widely used approach for trading Contracts for Difference (CFDs) on the EUR USD currency pair. It involves the study of historical price and volume data to predict future price movements. This method rests on the belief that market trends and patterns tend to repeat, enabling traders to make informed decisions.
Key chart patterns, indicators, and concepts to be covered
Several key components underpin technical analysis: support and resistance analysis, chart patterns, trend analysis, indicators and oscillators, and candlestick patterns.
Support and resistance analysis is pivotal in identifying levels at which the price tends to stop or reverse. For instance, if the EURUSD currency pair consistently encounters resistance at 1.10460 and finds support at 1.05195, traders can strategize entry and exit points based on these levels.
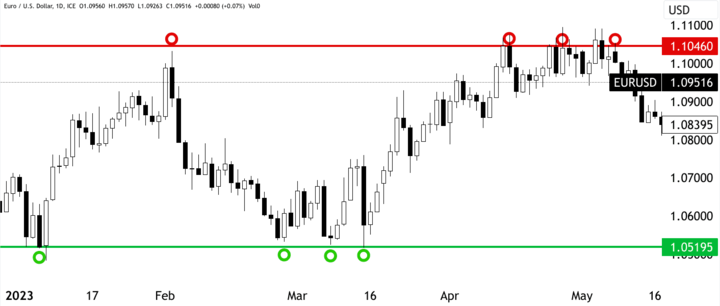
Source: tradingview.com
Chart patterns such as head and shoulders, double tops, and flags are crucial for spotting potential reversals or continuations. If a head and shoulders pattern emerges after a prolonged uptrend, it can signal a forthcoming downtrend. This was observed in February 2022, when the EUR USD formed a head and shoulders pattern, before a significant drop from 1.14825 to 1.03495.
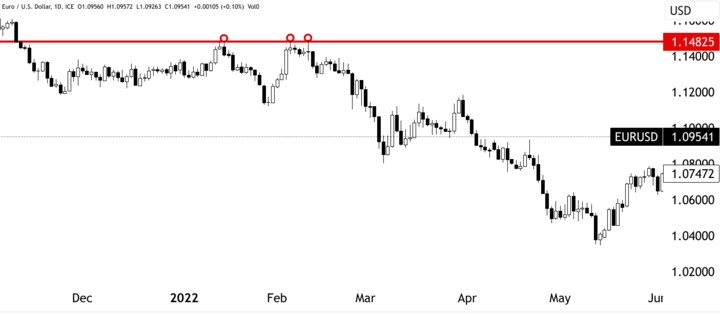
Source: tradingview.com
Trend analysis involves examining the overall direction of price movement. Traders use moving averages to smooth out price fluctuations and identify trends more clearly. When the 50-day moving average crosses above the 200-day moving average, as it did in December 2022, it suggests a bullish trend, indicating potential buying opportunities.
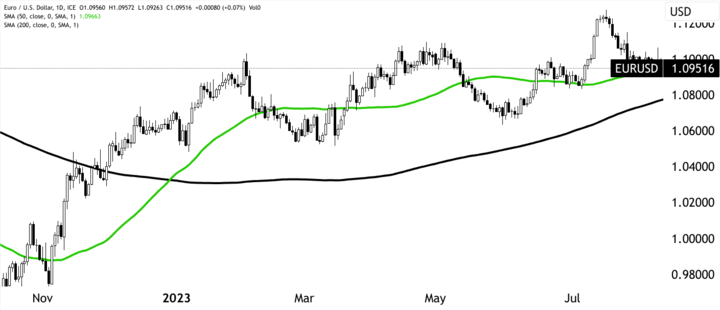
Source: tradingview.com
Indicators and oscillators like the Relative Strength Index (RSI) and Moving Average Convergence Divergence (MACD) help traders gauge overbought or oversold conditions. In April 2023, the RSI reading above 70 signaled an overbought EUR USD, hinting at a possible price reversal, which subsequently occurred.
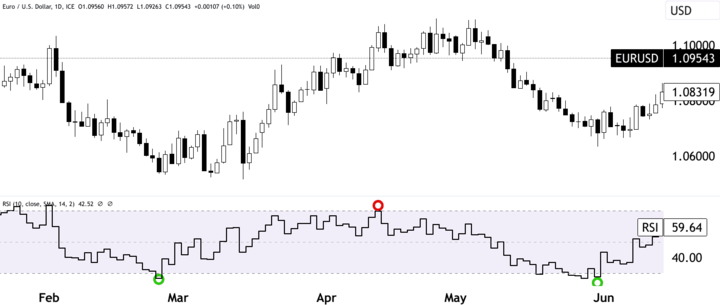
Source: tradingview.com
Candlestick patterns offer insights into market sentiment through specific formations. A bullish engulfing pattern, where a larger green candle follows a smaller red one, can indicate a potential upward reversal. This was evident in September 2022, when a bullish engulfing pattern at 0.95359 foreshadowed a price rise to 1.10330.

Source: tradingview.com
II. Support and Resistance Analysis
Identifying key support and resistance levels on the EUR/USD chart
Support and resistance analysis form the bedrock of technical analysis in EURUSD CFD trading. This method involves identifying critical price levels at which the currency pair tends to either stall (resistance) or reverse (support). By comprehending these levels and their implications, traders can make more informed decisions regarding entry, exit, and risk management strategies. However, the effectiveness of support and resistance analysis depends on a critical understanding of how these levels are formed and how they can be exploited.
To illustrate, let's delve into an example from EUR/USD price history. In August 2020, the currency pair experienced a sustained uptrend, reaching a peak of 1.1900. At this point, traders observed a historical resistance level where the price had previously encountered selling pressure and reversed. Recognizing this resistance at 1.2000, traders may have chosen to go short in anticipation of a downward reversal. As a result, the price retreated to around 1.1700, confirming the strength of the identified resistance level.
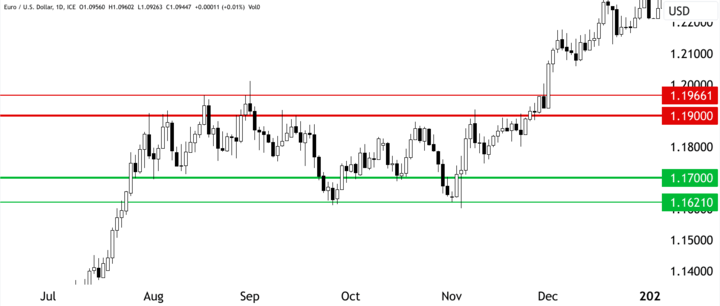
Source: tradingview.com
Trading bounces and breakouts from these levels
Trading support and resistance involves two primary scenarios: bounces and breakouts. In the case of bounces, when the price approaches a support level, traders anticipate a reversal and subsequently take long positions. Conversely, during breakouts, when the price breaches a resistance level, traders expect a continuation of the trend and may choose to go long. These strategies are exemplified in the EUR USD context.
Consider a scenario in July 2023 where the EUR/USD price found support at 1.08340, a level it had respected multiple times in the past. Traders who recognized this support might have taken long positions, profiting as the price subsequently rebounded to 1.12760. In this instance, the bounce strategy paid off.

Source: tradingview.com
On the other hand, breakouts involve a different perspective. In April-May 2020, the EUR USD price consistently failed to breach the resistance level at 1.09818, suggesting a strong selling interest at that level. However, when the price finally surged beyond 1.07760, it marked a breakout. Traders identifying this breakout might have entered long positions, capitalizing on the continuation of the uptrend that followed.
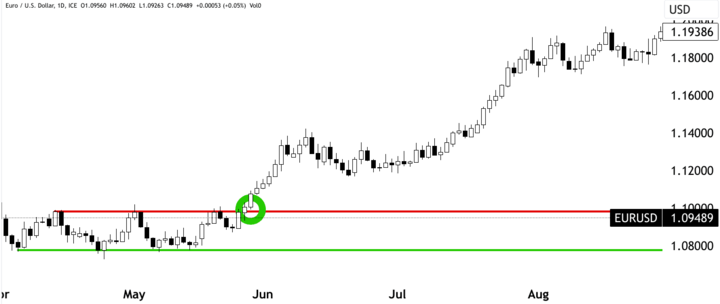
Source: tradingview.com
Using swing highs and lows, pivots, Fibonacci, etc.
Various tools complement support and resistance analysis. Swing highs and lows provide insight into short-term price fluctuations, while pivots offer potential turning points based on previous highs, lows, and closings. Applying Fibonacci retracement levels aids in pinpointing potential support and resistance zones based on the Fibonacci sequence. For instance, during a downtrend, if the EUR USD price retraces to the 50% Fibonacci level before encountering resistance, traders might anticipate a subsequent continuation of the downtrend.
III. Chart Patterns
Chart patterns serve as essential tools within the realm of technical analysis for EUR USD CFD trading. These patterns, derived from historical price movements, offer insights into potential trend reversals and continuations. Traders who can accurately identify and interpret these patterns gain a strategic advantage in predicting future price dynamics. To comprehend the significance and application of these patterns, let's delve into specific examples and instances.
Common reversal patterns like Head and Shoulders and Double Tops
Reversal patterns, such as the Head and Shoulders and Double Tops, are indicative of a potential change in trend direction. The Head and Shoulders pattern consists of three peaks, with the middle peak (the "head") being higher than the other two (the "shoulders"). This pattern suggests a shift from an uptrend to a downtrend. For instance, in May-June 2021, the EUR USD chart displayed a textbook Head and Shoulders pattern, with the right shoulder forming near 1.22495. Subsequently, the price reversed, falling from approximately 1.15290.

Source: tradingview.com
The Double Tops pattern involves two consecutive peaks at roughly the same level. This pattern signifies a potential reversal from an uptrend to a downtrend. In February 2022, the EUR USD exhibited a clear Double-top pattern around 1.14480, foreshadowing a decline to around 0.95940.
Continuation patterns like Flags, Triangles, and wedges
Continuation patterns, on the other hand, suggest that the existing trend is likely to persist. Examples include Flags, Triangles, and Wedges. A Flag pattern consists of a sharp price movement followed by a consolidation phase. Subsequently, the price typically continues in the direction of the initial movement. In November 2022, the EUR USD exhibited a Flag pattern, with a sharp upward move followed by a consolidation before another upward surge.
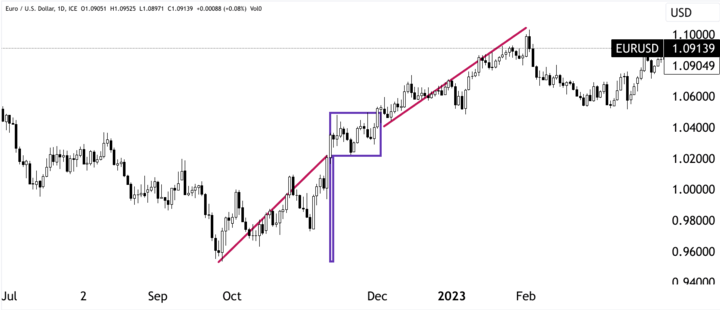
Source: tradingview.com
Triangles are formed by converging trend lines that represent decreasing price volatility. A Symmetrical Triangle pattern occurs when these trend lines meet, signaling an impending breakout. If the breakout is upward, it confirms the continuation of an uptrend. In July 2022, the EUR USD formed a Symmetrical Triangle, eventually breaking out upwards and validating the pattern's predictive power.
Wedges are similar to triangles, but their trendlines are slanted in either an upward or downward direction. An Ascending Wedge occurs when the upper trendline slants upward and the lower trendline is horizontal. This pattern often precedes a downward breakout. In September 2020, the EUR USD presented an Ascending Wedge pattern, followed by a price drop from around 1.1800 to 1.1700.
Trading pattern breakouts and target projections
Trading pattern breakouts involve entering positions when the price breaches the pattern's boundary. To establish target projections, traders often measure the distance from the pattern's start to its end and apply it to the breakout point. For instance, if a Flag pattern begins at 1.1500 and ends at 1.1600, a breakout above 1.1600 could lead to a projected target of 1.1700.
IV. Trend Analysis
Trend analysis is a cornerstone of technical analysis in EUR USD CFD trading, enabling traders to comprehend the prevailing direction of price movement. By identifying and capitalizing on trends, traders can make more informed decisions, enhance their entry and exit strategies, and manage risk effectively. This analysis primarily involves recognizing uptrends and downtrends through the use of moving averages and supplementary indicators. To understand the significance and practical implications of trend analysis, let's delve into specific examples and scenarios.
Defining uptrends and downtrends using moving averages
Uptrends are characterized by a series of higher highs and higher lows, indicating a sustained upward movement in prices. To define an uptrend, traders often rely on moving averages. For instance, the 50-day moving average crossing above the 200-day moving average can signal the initiation of an uptrend. In July 2020, the EUR USD exhibited this crossover, leading to a significant uptrend that saw the price rise from around 1.12308.
Downtrends, conversely, involve lower highs and lower lows, signifying a prolonged downward movement in prices. The 200-day moving average crossing below the 50-day moving average can denote the start of a downtrend. In July 2021, the EUR USD experienced this crossover, ushering in a downtrend that resulted in a decline from 1.18025.
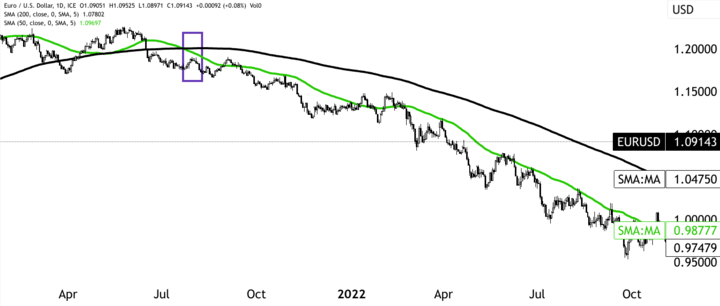
Source: tradingview.com
Trading pullbacks within the trend
Trading pullbacks within trends is a common strategy. When a currency pair is in an uptrend, temporary declines in price, known as pullbacks or retracements, can provide opportunities to enter long positions at more favorable prices. In a downtrend, pullbacks offer opportunities to enter short positions. In January 2023, during an ongoing uptrend, the EUR USD experienced a pullback from 1.2100 to 1.1950. Traders who recognized the pullback might have taken long positions, anticipating a continuation of the overall upward movement.
Using ADX, RSI, etc. to gauge trend strength
To gauge the strength of a trend, traders employ indicators like the Average Directional Index (ADX) and the Relative Strength Index (RSI). The ADX measures trend strength on a scale from 0 to 100. A reading above 25 suggests a strong trend, while a reading below 25 indicates a weak trend. In June 2021, the EUR USD exhibited an ADX reading of 35, indicating a robust uptrend. This was validated by the subsequent price increase.
The RSI, on the other hand, oscillates between 0 and 100, gauging the momentum and speed of price movements. An RSI reading above 70 implies overbought conditions, potentially signaling an impending reversal in an uptrend. In February 2022, the EUR USD RSI surged above 70, followed by a subsequent price decline from 1.2200 to 1.1800, confirming the predictive nature of the RSI.
V. Indicators and Oscillators
Indicators and oscillators play a crucial role in shaping the strategies of technical analysis for EUR USD CFD trading. These tools offer insights into momentum, trend strength, and volatility, aiding traders in making informed decisions. By understanding the intricacies of different indicators and oscillators and how they interact, traders can gain a deeper comprehension of market dynamics and enhance their trading strategies. To grasp the significance and practical applications of these tools, let's explore specific examples and scenarios.
Momentum oscillators like Stochastics, MACD, and RSI
Momentum oscillators like Stochastics, Moving Average Convergence Divergence (MACD), and the relative strength index (RSI) help traders gauge the speed and strength of price movements. The stochastic oscillator compares the current closing price to its range over a certain period, indicating overbought or oversold conditions. For instance, in April 2021, the EUR USD Stochastics reading exceeding 80 signaled overbought conditions, heralding a subsequent price reversal from 1.2150.
The MACD combines two moving averages to provide insights into trend direction and momentum. A positive MACD histogram indicates upward momentum, while a negative histogram suggests downward momentum. In October 2022, the EUR USD MACD histogram turned positive, preceding an uptrend that took the price from 0.9700.
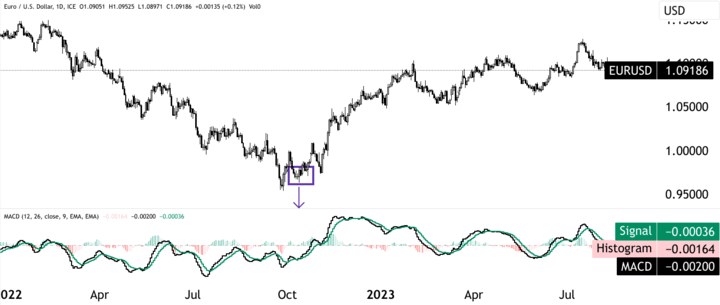
Source: tradingview.com
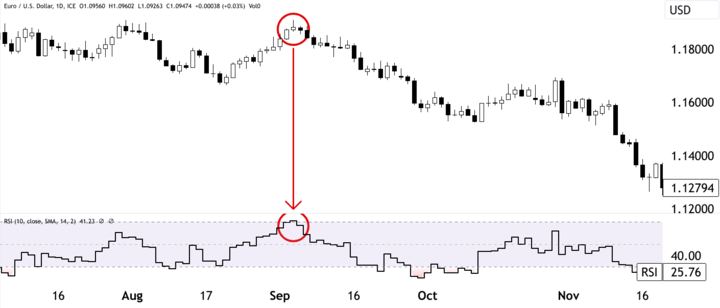
The RSI measures the magnitude of recent price changes to assess overbought and oversold conditions. A reading above 70 signals that the market is overbought, possibly anticipating a reversal. In September 2021, the EUR USD RSI crossed 70, preceding a price decline from 1.18835.
Volatility indicators like Bollinger Bands and ATR
Volatility indicators, including Bollinger Bands and the Average True Range (ATR), help traders comprehend price dispersion and potential breakout points. Bollinger Bands consist of three lines: a moving average and two standard deviation bands above and below it. When the price moves outside these bands, it suggests potential volatility and trading opportunities. In June 2023, the EUR USD price surged above the upper Bollinger Band, marking a potential breakout.

Source: tradingview.com
The ATR provides insights into price volatility by calculating the average range between high and low prices over a specific period. Higher ATR values indicate greater volatility. For instance, an ATR spike in March 2020, followed by a significant price movement, demonstrated the effectiveness of this indicator in predicting potential market shifts.
Combining indicators for trade signals
Combining indicators is a common practice to derive more robust trading signals. The confluence of signals from different indicators often increases the probability of accurate predictions. For example, if the EUR USD exhibits an overbought RSI reading (above 70) while the MACD histogram indicates downward momentum, traders might consider this a strong indication of a potential price reversal.
However, while indicators and oscillators provide valuable insights, they have limitations. Misinterpretation or reliance on a single indicator can lead to erroneous decisions. In October 2022, the EUR USD RSI indicated overbought conditions at 1.0075, but the price continued to rise due to strong fundamental factors.

Source: tradingview.com
VI. Candlestick Patterns
Candlestick patterns are a cornerstone of technical analysis in EUR USD CFD trading, offering intricate insights into market sentiment and potential price movements. These patterns are formed by the interplay of open, high, low, and close prices, as depicted in candlestick charts. By comprehending the implications of different candlestick formations, traders can enhance their ability to predict trend reversals and continuations, thus improving their trading decisions. Let's explore specific examples and scenarios to understand the significance and application of these patterns.
Reversal patterns like Hammer, Shooting Star, and Doji
Reversal patterns are indicative of potential trend reversals and offer critical insights into shifts in market sentiment. The Hammer is a bullish reversal pattern characterized by a small body and a long lower shadow. It suggests that sellers drove the price down during the session, but buyers managed to push it back up.
The Shooting Star is its bearish counterpart. It consists of a small body and a long upper shadow, indicating that buyers initially pushed the price up, but sellers took control by the session's end.
A Doji forms when the open and close prices are very close, resulting in a small body. It implies uncertainty and a potential trend reversal. In March 2023, the EUR USD chart displayed a Doji at 1.05427, suggesting indecision in the market before a subsequent reversal.
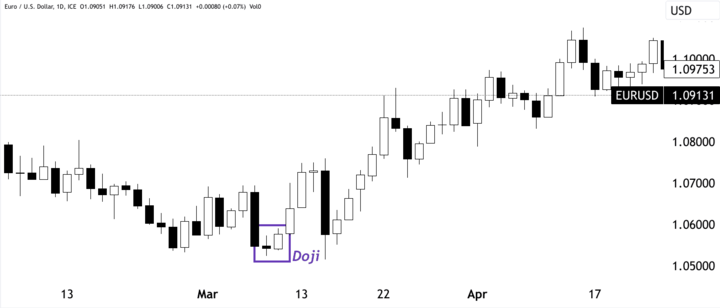
Source: tradingview.com
Continuation patterns like Marubozu, Windows, and Tweezers
Continuation patterns signal the potential continuation of an existing trend. The Marubozu is a candlestick with a long body and little to no shadow, indicating strong momentum in the current trend. In June 2023, the EUR USD exhibited a bullish Marubozu, indicating strong buying pressure and a continuation of the uptrend.

Source: tradingview.com
Windows (also known as gaps) occur when there is a noticeable space between the close and open prices of adjacent candlesticks. An upward window signals a bullish continuation, while a downward window indicates a bearish continuation.
Tweezers occur when two or more candlesticks have the same high or low price, forming horizontal lines. A bullish tweezers pattern can suggest a bullish continuation, while a bearish tweezers pattern can indicate a bearish continuation. In April 2023, a bearish tweezers pattern emerged at 1.1000, foreshadowing a price decline.
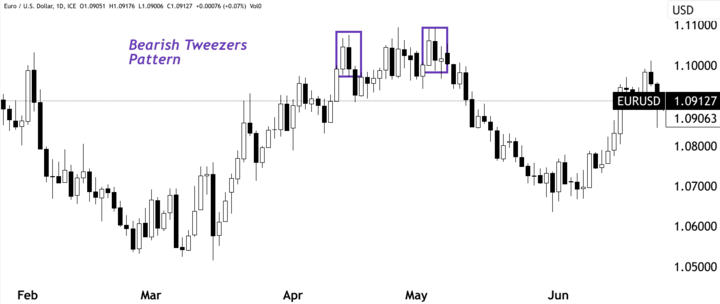
Source: tradingview.com
Strategies to trade candlestick signals
Trading candlestick signals requires careful consideration and often involves confirmation from other technical tools. For instance, if a Hammer pattern forms at a significant support level, traders might consider it a strong buying signal. However, confirming indicators like the RSI and volume trends can further enhance the validity of the signal.
Source: tradingview.com
VII. Conclusion
Key concepts covered: support/resistance, patterns, trends, indicators
In conclusion, mastering the art of EUR USD CFD trading requires a comprehensive understanding of key technical analysis concepts. This includes identifying support and resistance levels, recognizing chart patterns for trend reversal or continuation, understanding trend analysis through moving averages and indicators, and utilizing various indicators and oscillators to assess momentum and volatility.


The Importance of Combining Different Technical Analysis Tools
The significance of combining these tools cannot be overstated. Support and resistance levels gain more credibility when validated by chart patterns, while trend analysis provides context for interpreting indicator signals. For example, if an Ascending Wedge pattern aligns with a Bearish Divergence on the MACD, it could present a stronger signal for a potential reversal.
Overview of executing high-probability EUR USD CFD trades
Executing high-probability EUR USD CFD trades hinges on synthesizing these tools. Suppose a Double Tops pattern coincides with an RSI reading above 70 and a downward crossover in the stochastic oscillator. This alignment may prompt a trader to initiate a short position, leveraging the convergence of signals from multiple angles.
However, successful trading extends beyond technical analysis alone. Fundamental factors, geopolitical events, and economic indicators can swiftly alter market dynamics. Prudent risk management strategies, like setting stop-loss orders, are vital to protect against unforeseen developments.