Introduction
A brief overview of oil CFDs
Oil CFDs (Contracts for Difference) are financial derivatives that used to speculate on crude oil price movements without owning the underlying asset. With an oil CFD, traders can make profits by predicting the direction of oil prices, whether they will rise or fall.
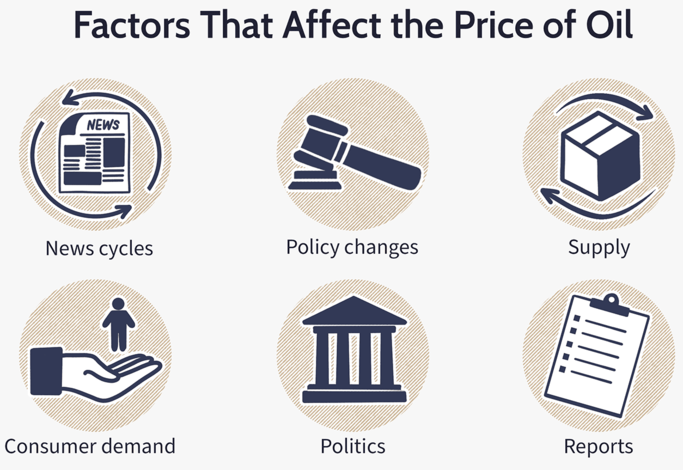
Oil CFDs are traded on various financial markets and exchanges, and numerous factors, including global oil supply and demand, geopolitical events, OPEC decisions, weather patterns, economic growth, and more, influence their prices. As such, understanding the multifaceted factors that affect oil CFD prices is crucial for traders looking to profit from this market.

Importance of Understanding Factors That Affect Oil Prices
Understanding the multifaceted factors that affect oil CFD prices is vital for several reasons. Firstly, it helps traders make informed decisions about when to buy or sell oil CFDs based on their assessment of the current and future market conditions.
Secondly, it allows traders to manage their risks by anticipating potential price fluctuations and adjusting their trading strategies accordingly.
Thirdly, knowledge of the factors that affect oil prices can help investors better understand the broader economic and political landscape, as oil prices often reflect the state of global economic health.
Ultimately, a deep understanding of the factors that influence oil CFD prices can give traders a significant advantage in this highly competitive market.
Macroeconomic Factors
Supply and demand
Macroeconomic factors are crucial in determining the price of oil CFDs. Among these factors, supply and demand are the most significant. Changes in global production levels can impact the oil supply, leading to price fluctuations. For example, if global oil production decreases due to natural disasters or geopolitical tensions, the resulting reduction in supply can cause prices to rise. Conversely, if production levels increase due to technological advancements or government policies, prices may fall.
OPEC production quotas also affect the global supply of oil. OPEC (Organization of the Petroleum Exporting Countries) is a coalition of oil-producing countries that dominate and channel a significant portion of the world's oil supply. The group's decisions to increase or decrease production quotas can substantially impact oil prices.
Finally, economic growth and demand trends can also influence the price of oil CFDs. Strong economic growth typically results in increased demand for oil, which can lead to higher prices. Conversely, economic downturns or reduced demand can cause prices to fall. Therefore, traders must closely monitor these macroeconomic factors and adjust their trading strategies accordingly to profit from oil CFDs.
Political and Geopolitical Factors
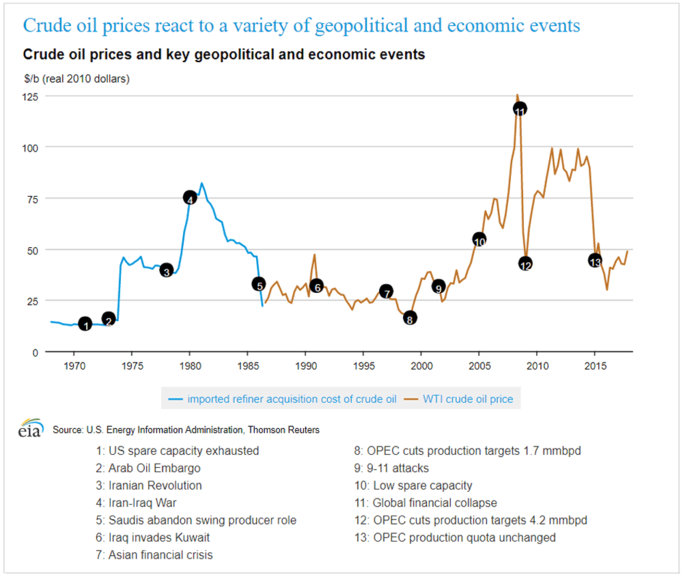
Political and geopolitical factors also play a significant role in influencing the price of oil CFDs. War and conflicts can disrupt the production and transportation of oil, leading to supply shortages and price spikes. For example, the Gulf War in 1990 led to a significant increase in oil prices due to disruptions in production and transportation in the Middle East. Similarly, the ongoing Russia-Ukraine conflict is causing major swings in global oil prices.
International sanctions can also affect the supply of oil. When countries impose sanctions on other nations, it can lead to a reduction in the supply of oil as countries may be unable to export or import oil. It can lead to price increases as demand remains stable while supply decreases.
Trade agreements and production cuts can also impact the price of oil CFDs. Agreements between countries to increase or decrease oil production can affect the oil supply and its price. For example, the 2016 production cut agreement between OPEC and non-OPEC members led to a significant increase in oil prices.
Therefore, political and geopolitical factors should be closely monitored by traders to anticipate potential price fluctuations in oil CFDs. The occurrence of unexpected events, such as conflicts or sanctions, can have significant impacts on the oil market, presenting both risks and opportunities for traders.
Environmental Factors
Environmental factors are becoming increasingly important in determining the price of oil CFDs. Climate conditions, such as extreme weather events, can impact the production and transportation of oil, leading to supply disruptions and price fluctuations. For example, hurricanes and other severe weather events can lead to disruptions in oil production and transportation, leading to temporary supply shortages and price spikes.
Clean energy initiatives are also impacting the oil demand. As more countries and companies shift towards renewable energy sources, the oil demand is expected to decrease in the long run, potentially leading to lower prices. Moreover, as the technology for renewable energy becomes more advanced, it is becoming increasingly cost-effective, which could make it more competitive with traditional fossil fuels.
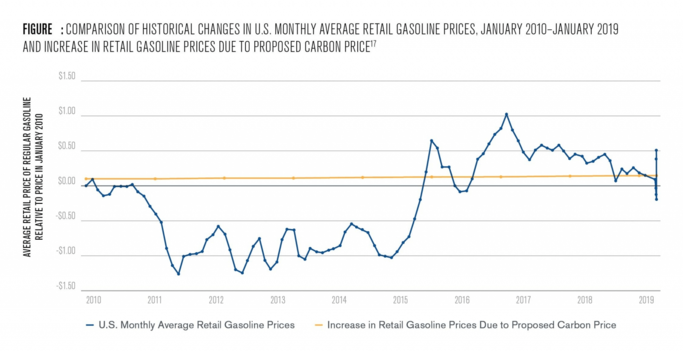
Carbon pricing policies, such as emissions trading schemes or carbon taxes, can also impact oil demand. These policies increase the cost of using fossil fuels, making them less attractive to consumers and businesses. It can lead to reduced demand for oil, potentially leading to lower prices in the long run.
Therefore, traders must consider these environmental factors when trading oil CFDs. As the world transitions towards cleaner and more sustainable energy sources, the oil demand may decrease, potentially leading to lower prices. On the other hand, unexpected weather events or policy changes may lead to price spikes in the short term, presenting opportunities for traders.
Microeconomic Factors
Inventory Levels
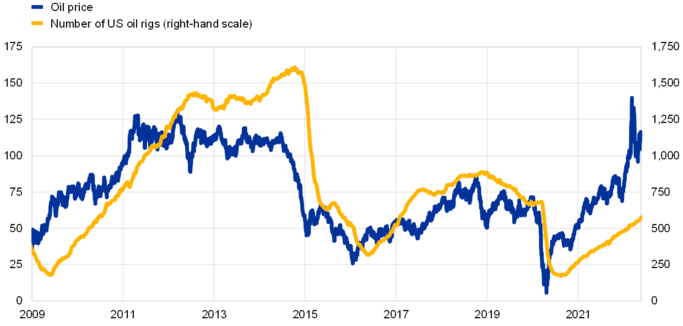
Microeconomic factors also play a critical role in determining the price of oil CFDs. Among these factors, inventory levels are particularly significant. The volume and locations of crude oil storage facilities can impact the oil supply in a particular region, which can lead to price fluctuations. For example, if inventory levels at a specific storage facility are low, it may lead to supply shortages and price increases in that region. Similarly, the count of operational rigs also impacts inventory levels, which in turn influence the price of oil CFDs.
Seasonal demand patterns also impact inventory levels and, hence, the price of oil CFDs. During the winter, heating oil demand typically increases, leading to higher prices. Conversely, during the summer, demand for gasoline increases due to increased travel, leading to higher prices for gasoline.
Finally, refinery utilization rates can impact inventory levels and, hence, the price of oil CFDs. If refinery utilization rates are low due to maintenance or other issues, it can lead to a reduction in the supply of oil products, leading to price increases.
Therefore, traders must closely monitor these microeconomic factors to anticipate potential price fluctuations in oil CFDs. Unexpected changes in inventory levels or refinery utilization rates can lead to short-term price spikes, while seasonal demand patterns can impact prices in the long run.
Currency exchange rates
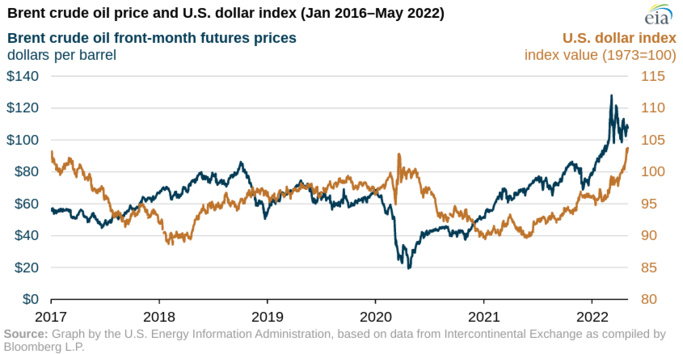
Currency exchange rates also play a significant role in determining the price of oil CFDs. The correlation between oil prices and currency values can impact the demand for oil products in different countries, leading to price fluctuations. A stronger dollar typically leads to lower oil prices since oil is traded in dollars. Conversely, a weaker dollar can lead to higher oil prices.
The economic outlook of oil exporting and oil importing countries can also impact the demand for oil products and, hence, the price of oil CFDs. For example, the economic outlook for a significant oil importer like the United States is positive. In that case, it may lead to increased demand for oil products, potentially leading to higher prices. Conversely, if the economic outlook for a significant oil exporter like Saudi Arabia is negative, it may lead to decreased demand for oil products, potentially leading to lower prices.
Finally, central bank policies and interest rates can impact currency exchange rates, which can, in turn, affect the price of oil CFDs. For example, if a central bank enhances benchmark rates, it may lead to a stronger currency and lower oil prices. Conversely, if a central bank lowers interest rates, it may lead to a weaker currency and higher oil prices.
Notably, these relationships are subject to the state of the macroeconomic environment. As observed in 2022, macroadversities lead to an enhancement in the dollar’s strength and upside moves in the oil price together.
Therefore, traders must closely monitor currency exchange rates and the economic outlook of oil exporting and importing countries when trading oil CFDs. Sudden changes in central bank policies or economic outlooks can lead to short-term price fluctuations, presenting opportunities for traders.
Technical Analysis
Candlestick Patterns and Chart Indicators
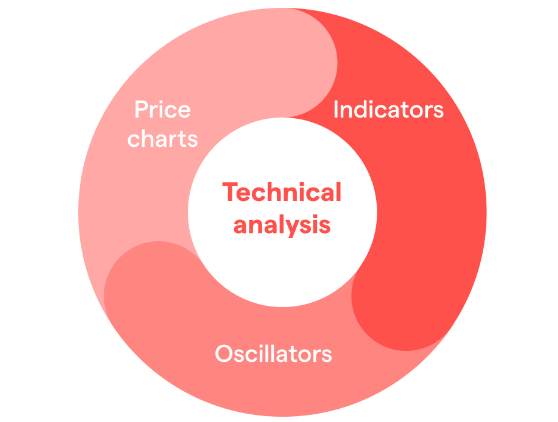
Technical analysis is an essential tool to analyze historical market data and identify potential future trends in oil CFD prices. Among the various technical indicators, candlestick patterns and chart indicators are widely used by traders.
Moving averages are major chart indicators that help identify the overall trend of oil CFD prices. A moving average is computed by averaging the price of oil over a specific period, such as 20 days or 50 days. Traders use moving averages to identify potential price trends, such as an upward or downward trend.
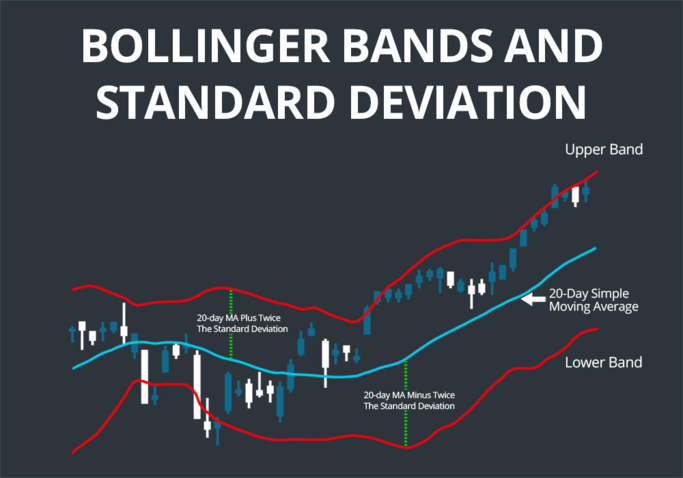
Bollinger bands are another popular chart indicator used in technical analysis. These bands consist of three lines, including a moving average and two standard deviation lines. Bollinger Bands help traders identify periods of market volatility and potential price breakouts.
The RSI is a momentum indicator used to measure the strength of price movements. Traders use the RSI to identify potential overbought or oversold conditions in the market, which can indicate potential price reversals.
Therefore, technical analysis plays an essential role in predicting potential price movements in oil CFDs. By analyzing historical price data and identifying potential trends and patterns, traders can make logical and informed decisions and capitalize on potential price movements.
Support and Resistance Levels
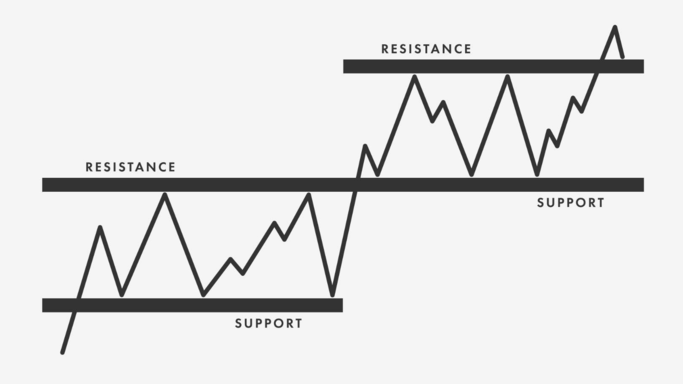
Support and resistance levels are also essential technical analysis tools used to predict potential price movements in oil CFDs. Support levels refer to a specific price level at which a significant number of traders are willing to buy oil, preventing prices from falling further. On the other hand, resistance levels refer to a price level at which a significant number of traders are willing to sell oil, preventing prices from rising further.
Identifying critical support and resistance levels is essential for traders to make informed decisions. When prices approach a support or resistance level, traders look for signs of price rejection, such as long wicks or price stalls. Price rejection at support or resistance levels can indicate potential price movements in the opposite direction.
False breakout signals are another important consideration when identifying support and resistance levels. False breakouts occur when prices briefly move past a support or resistance level but then quickly return to the previous trading range. Traders must be careful when identifying support and resistance levels and look for confirmation signals before entering trades.
Therefore, support and resistance levels are essential technical analysis tools for traders to identify potential price movements in oil CFDs. By identifying key levels and monitoring price rejection and false breakout signals, traders can make informed trading decisions and capitalize on price movements.
Chart Patterns
Chart patterns are another essential technical analysis tool used to identify potential price movements in oil CFDs.
Double tops or bottoms occur when prices reach a certain level twice before reversing in the opposite direction. These patterns indicate a potential trend reversal and can be used to enter or exit trades.
Triangles are another typical chart pattern used in technical analysis. These patterns occur when prices consolidate within a specific price range, forming a triangular shape on the chart. Traders look for breakout signals as prices move toward the apex of the triangle, indicating a potential trend continuation or reversal.

Head and shoulders patterns are also essential chart patterns used in technical analysis. These patterns occur when prices reach a high point, followed by a lower high, and then break below a specific neckline level. This pattern signifies a possible trend reversal and can be used to enter or exit trades.
Traders must be careful when identifying chart patterns and always look for confirmation signals before entering trades. False breakouts and fake patterns can occur, so traders must use technical analysis in conjunction with other fundamental analysis tools to make informed trading decisions.
Therefore, chart patterns are essential technical analysis tools traders use to identify potential price movements in oil CFDs. By identifying double tops or bottoms, triangles, and head and shoulders patterns, traders can capitalize on trend reversals or continuations in the oil CFD market.
Fundamental Analysis vs. Technical Analysis
Fundamental analysis and technical analysis are decisive approaches to analyzing financial markets, including oil CFD trading.
Fundamental analysis is the study of the underlying economic, financial, and geopolitical factors that affect the supply and demand of oil and, consequently, its price. It includes factors such as global oil production levels, oil consumption patterns, economic growth rates, government policies, and geopolitical tensions. The main advantage of fundamental analysis is that it provides a comprehensive view of the market, allowing traders to derive rational and informed decisions based on long-term trends and macroeconomic indicators. However, fundamental analysis can be time-consuming and requires a deep understanding of the market.
On the other hand, technical analysis is the study of past price and volume data to identify patterns, trends, and potential trading opportunities. Technical analysts use charts, graphs, and other tools to analyze the historical behavior of oil prices and to identify support and resistance levels. The core advantage of technical analysis is that it can help traders make short-term predictions and react quickly to changes in the market. However, technical analysis is often criticized for being subjective and lacking in fundamental reasoning.
To make better decisions, traders can use fundamental and technical analyses together. By combining these two approaches, traders can get a more comprehensive market view and make informed decisions based on both short-term trends and long-term fundamentals. For example, a trader might use fundamental analysis to identify long-term trends in the oil market while using technical analysis to identify short-term entry and exit points.
Ultimately, the choice of which analysis to use depends on the individual trader's preferences and trading style. Traders who prefer long-term positions may rely more heavily on fundamental analysis, while those who prefer short-term positions may rely more on technical analysis. By understanding the strengths and weaknesses of each approach, traders can make more informed decisions and improve their overall trading performance.
Conclusion
In summary, the factors that affect oil CFD trading are multifaceted and complex. They include supply-side and demand-side factors, such as global oil production levels, economic growth rates, geopolitical tensions, and changes in consumer behavior. Additionally, factors such as weather patterns, technological advancements, and government policies can significantly impact oil CFD prices.
Traders need to understand these factors when trading oil CFDs. By understanding the underlying fundamentals of the oil market, traders can make more informed decisions and adjust their strategies accordingly. They can also stay up-to-date on market news and events that may impact oil prices and adjust their positions accordingly.
Finally, the potential profitability of oil CFD trading is influenced by numerous factors, including the trader's skill level, risk tolerance, and market conditions. While there is no guarantee of profitability, by utilizing both fundamental and technical analysis and staying informed on market developments, traders can increase their chances of success in the oil CFD market.
*Disclaimer: The content of this article is for learning purposes only and does not represent the official position of VSTAR, nor can it be used as investment advice.