Forex trading, also known as foreign exchange trading, refers to the buying and selling of currencies on the foreign exchange market. The forex market is the largest and the most liquid financial market globally, with a daily turnover of over $6 trillion. It operates 24 hours a day, five days a week, and is accessible to anyone with an internet connection. It is a popular way of investing money in the financial market that provides a unique opportunity for investors to profit from fluctuations in currency prices.
Forex trading is essential in the global economy as it enables businesses to make international transactions and governments to manage their economies. The highly liquid forex market allows traders to trade on margin, meaning they can control large positions with a relatively small investment. This can lead to significant profits but carries a high risk. It also plays a vital role in international trade and commerce, enabling businesses to buy and sell goods and services across borders.
Forex trading has several benefits, such as high liquidity, low barriers to entry, and the ability to profit from rising and falling markets. Trading forex requires a significant amount of skill and knowledge to be successful. Therefore, it is essential to carefully consider the risks before getting started with forex trading.

Getting Started with Forex Trading
A. Understanding the Forex Market
The forex market is a decentralized market where currencies are traded 24 hours a day, five days a week and is accessible from anywhere in the world. It is divided into four major trading sessions: the Sydney session, the Tokyo session, the London session, and the New York session.
Unlike other financial markets, there is no central exchange or regulator, and trading is done electronically. The market comprises various players, such as Forex trading platforms are software that enables traders to access the Forex market, analyze market data, and execute trades. They come in various forms, such as desktop, web-based, and mobile applications. banks, institutional investors, and individual traders.
Also, to successfully trade forex, you need to understand basic terminologies such as pips, lots, bid and ask prices, and spreads. These terms are crucial in understanding the market and making informed trading decisions.
Some key terms include:
● Currency pair: The two currencies being traded
● Bid price: The price at which a trader can sell a currency pair
● Ask price: The price at which a trader can buy a currency pair
● Spread: The difference between the bid and ask price
B. Currency Pairs

In forex trading, currencies are traded in pairs. The first currency in the pair is known as the base currency, while the second currency is the quote currency. The value of the base currency is always one unit, and the value of the quote currency represents how much of the quoted currency is needed to buy one unit of the base currency.
The most traded currency pairs are major pairs, which include EUR/USD, USD/JPY, GBP/USD, and USD/CHF. These currency pairs are the most liquid and have lower spreads than other pairs.
These pairs account for the majority of the trading volume in the forex market, including:
● EUR/USD (Euro/US Dollar)
● USD/JPY (US Dollar/Japanese Yen)
● GBP/USD (British Pound/US Dollar)
● USD/CHF (US Dollar/Swiss Franc)
● AUD/USD (Australian Dollar/US Dollar)
● USD/CAD (US Dollar/Canadian Dollar)
C. Forex Trading Platforms
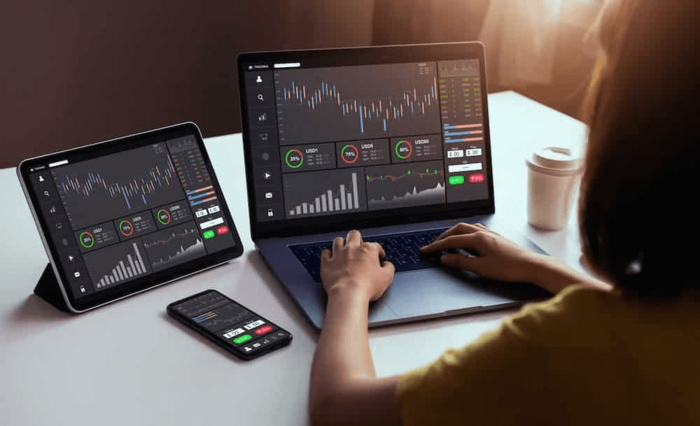
To access the forex market and execute trades, you must use a forex trading platform. A forex trading platform is software that enables traders to access the forex market and execute trades. These platforms provide access to real-time market data, charting tools, analytical tools, and other features that can help traders make informed decisions.
There are several popular forex trading platforms, including MetaTrader 4, MetaTrader 5, and cTrader, and NinjaTrader. Traders around the world widely use these platforms. Each platform has its unique features and capabilities and offers a range of advanced trading features and user-friendly interfaces to help traders succeed.
Moreover, the right forex trading platform is essential for a successful trading experience. When selecting a trading platform, you should consider factors such as ease of use, reliability, user interface, security, and available features.
D. Opening a Forex Trading Account

To start trading forex first, you’ll need a forex trading account. Hence, choosing the right Forex broker is an important first step in opening a trading account. A broker is a company that facilitates trades between buyers and sellers, and it's essential to choose a reputable and reliable broker that offers competitive spreads, and has a user-friendly trading platform. When selecting a broker, consider factors such as regulation, fees, trading platforms, and customer support. Try to go for a broker that's regulated by a reputable financial authority and offers low spreads and fees.
In this case, VSTAR is your perfect match, offering various payment options to cater to the client's diverse needs. You can make deposits or withdrawals using VISA, Mastercard, or International Bank Wire. Alternatively, they support digital payment methods such as Tether, Skrill, Neteller, SticPay, and Perfect Money.


Moreover, VSTAR operations are conducted in compliance with various regulatory requirements. They are licensed and monitored by the Cyprus Securities and Exchange Commission (CySEC) under license number 409/22. Additionally, VSTAR is a Cyprus Investor Compensation Fund member and operates within the European Regulatory Framework of MiFiD II. Also, VSTAR’s platform features a user-friendly interface, making it easy to navigate and use.
You can get started with a minimum deposit of just $50 and enjoy the lowest trading costs. It offers negative balance protection, ensuring you won't lose more than your account balance. You can also take advantage of real-time trading opportunities on popular markets. Plus, with their risk-free demo accounts, you can explore and practice trading with $100,000 in virtual funds in just 10 seconds.
E. Demo Trading

Demo trading allows you to practice trading Forex without risking any real money. This means you can practice trading in a risk-free environment using virtual funds. You'll use a simulated trading account that's funded with virtual currency to test out different trading strategies and get a feel for the market to learn the ropes of trading.
Demo trading is a valuable tool for beginner traders because it allows you to gain experience and confidence before trading with real money. It also helps you test out different trading strategies and learn about the Forex market without risking any real money.
Forex Trading Strategies
A. Technical Analysis strategies
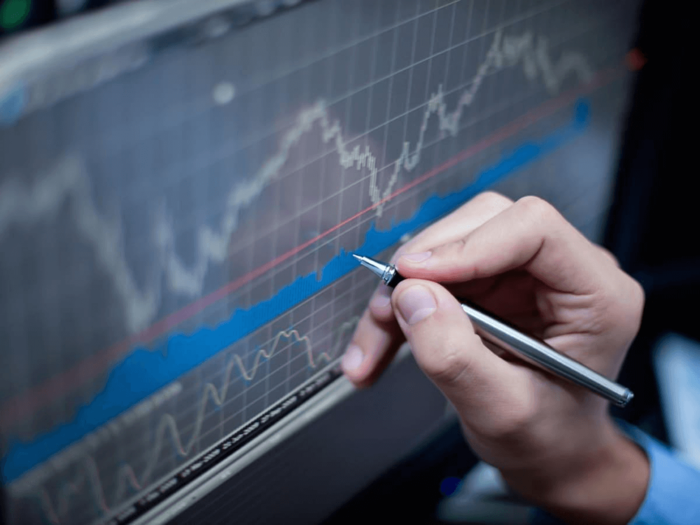
Technical analysis is a popular methodology traders use to make informed decisions in the financial markets. It involves analyzing past market data, mainly price, and volume, to forecast future price movements. This analysis relies on charts and various tools and indicators to identify patterns and trends in the market.
In Forex trading, technical analysis plays a vital role in predicting price trends and identifying profitable entry and exit points. Technical analysis can also help traders identify potential price levels for support and resistance, which can be used to set stop-loss and take-profit orders.
Charting tools and indicators

Charts are an essential tool in technical analysis, and they are used to display the price movement of a currency pair over a specific period. The most popular chart types are line charts, bar charts, and candlestick charts. Each chart type provides different information; you can choose the one that best suits your trading style.
Line charts are the most basic and show the closing prices of an asset over time. Bar charts, on the other hand, show the opening, closing, high, and low prices for a given period. Candlestick charts provide more information and are widely used by traders. They show the opening, closing, high, and low prices and use different colored candlesticks to represent bullish and bearish periods.
You can use numerous indicators to supplement your analysis of market trends. Indicators are mathematical calculations based on historical price and volume data. These calculations can help identify potential trends and trading opportunities.
Moving averages and trend lines are two common indicators that help identify trends. Moving averages are calculated based on the average price of a currency pair over a specified period. Trend lines are drawn by connecting two or more highs or lows of the currency pair, clearly indicating the trend direction.
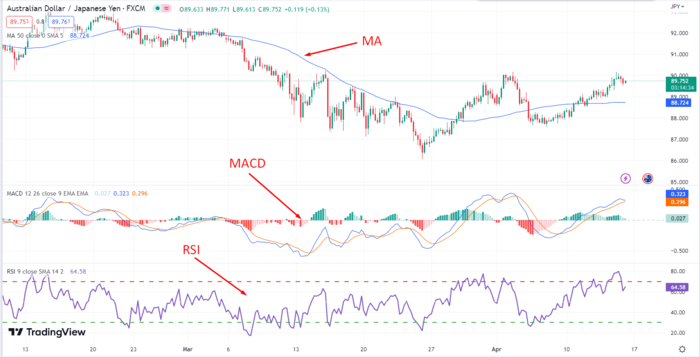
Other popular indicators include the Relative Strength Index (RSI), which measures the strength of a currency pair's price action, and the Moving Average Convergence Divergence (MACD), which indicates the momentum of the market. You can also use oscillators like the Stochastic Oscillator to identify overbought or oversold conditions.
Candlestick patterns
Candlestick patterns are used to identify potential market reversals that help to predict future price movements. These patterns are formed by a currency pair's open, high, low, and close prices over a specific period.
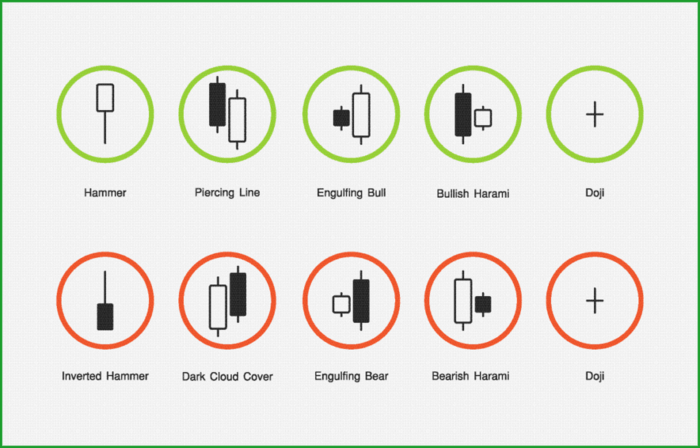
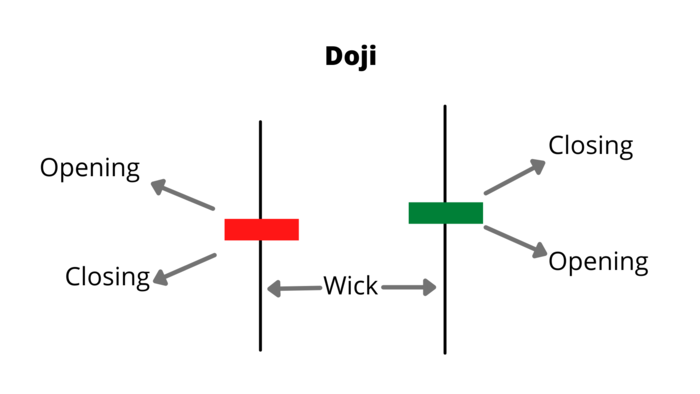
Popular candlestick patterns include Doji, Hammer, Shooting Star, and Engulfing patterns. Doji patterns occur when an asset's opening and closing prices are the same or nearly the same, indicating a potential trend reversal.
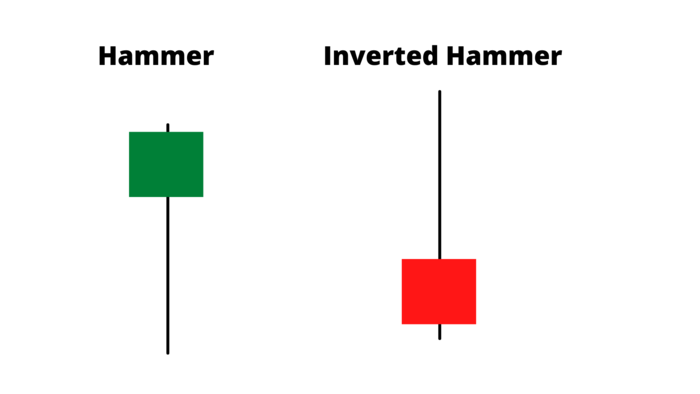
Hammer and Shooting Star patterns show a potential trend reversal in the form of long wicks and small bodies. A hammer is a bullish reversal pattern that forms after a downtrend. It occurs when the open, high, and close prices are near the candlestick's high. A shooting star is a bearish reversal pattern that forms after an uptrend. It occurs when the open, low, and close prices are near the low of the candlestick.
Engulfing patterns occur when a small candlestick is followed by a large candlestick, indicating a potential trend reversal.
Trend and momentum analysis
Trends and momentum are important factors in technical analysis. A trend is the general direction of price movement, while momentum is the speed and strength of price movement. Traders use trend lines and moving averages to identify trends, while momentum indicators such as RSI and MACD are used to identify potential changes in momentum.
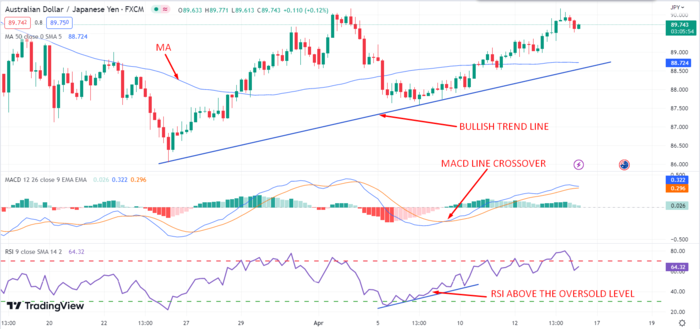
Trend analysis is the study of the direction of the market. It helps traders identify whether the market is moving up, down, or sideways. Traders can use trend lines and moving averages to identify the direction of the trend. If the trend is up, traders should look for buying opportunities, and if the trend is down, they should look for selling opportunities.
Momentum analysis is the study of the speed and strength of the market's price movement. Traders can use indicators such as the RSI and MACD to identify the momentum of the market. If the RSI is above 70, the market is overbought, and if it is below 30, the market is oversold. If the MACD line crosses above the signal line, it is a bullish signal, and if it crosses below, it is a bearish signal.
B. Fundamental Analysis strategies
Fundamental analysis is a critical component of forex trading. It is a method of evaluating the intrinsic value of an asset by analyzing various economic and financial factors that can affect its price.
In forex trading, fundamental analysis involves evaluating economic data and news releases, interest rates, and geopolitical events that can affect the value of a currency. Fundamental analysis helps traders understand the underlying economic and financial conditions that drive currency movements.
Traders should watch several key economic indicators when analyzing currency markets. These include GDP, inflation, employment data, and central bank policy decisions. For example, an increase in GDP and a decrease in unemployment can be positive indicators for a currency's value, while high inflation can lead to currency depreciation.
Economic indicators and news release

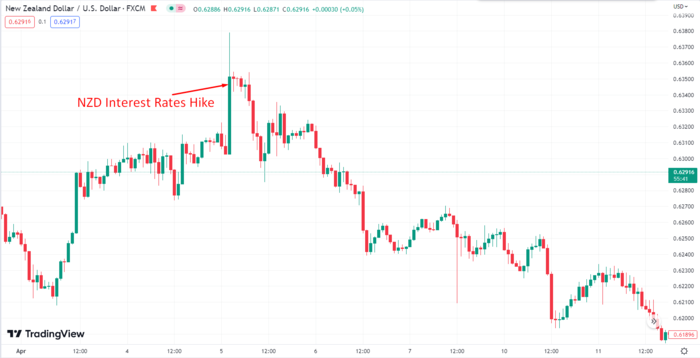
Economic news and events can have a significant impact on the forex market, as well. For example, when a central bank announces an interest rate cut, it can cause the currency to depreciate. Conversely, when the central bank announces a rate hike, it can cause the currency to appreciate. Similarly, when a country releases positive economic data, it can lead to increased demand for the currency and cause its value to rise.
Interest rates
Changes in interest rates can have a significant impact on the forex market as they affect the supply and demand of a currency. Interest rates are the cost of borrowing money and play a critical role in forex trading. Central banks use interest rates to control inflation and maintain stable economic growth. When interest rates rise, it can lead to increased demand for a currency and cause its value to appreciate.
Geopolitical factors

Geopolitical factors refer to political and social events that can affect the value of a currency. For example, political instability, war, and social unrest can all cause currency depreciation. Similarly, international trade agreements and sanctions can also impact a currency's value.
C. Price Action Strategies
As a forex trader, it's essential to understand price action and how to use price charts to make informed trading decisions. Price action is the study of price movement on a chart without the use of indicators. It involves analyzing historical price data to identify patterns, trends, and key support and resistance levels.
Reading price charts
To read price charts, you need to understand how to read candlestick charts. Candlestick charts display price movements in a visual format that is easy to interpret. They represent price movement using candlesticks, which have a body and wick. The body represents the price range between the opening and closing prices, while the wick represents the price range between the highest and lowest prices.
Recognizing price patterns and trends is also crucial to price action trading. Patterns can signal potential price movements, while trends can give an indication of market direction. Identifying patterns and trends requires a deep understanding of price movements and how they relate to historical data.
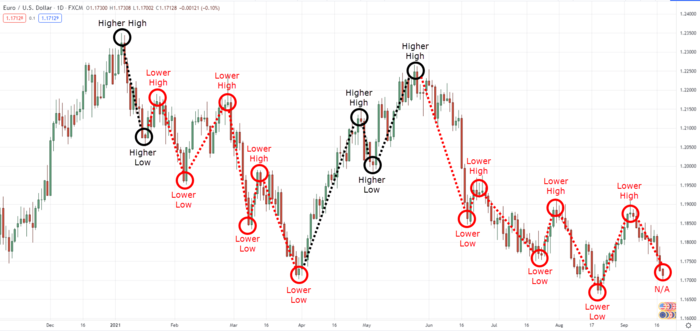
Price patterns are recurring formations on a chart that suggest a potential change in market direction. For example, an uptrend may be indicated by a series of higher highs and higher lows, while a downtrend may be indicated by a series of lower highs and lower lows. You can use these patterns to identify potential trading opportunities.
Support and resistance levels
Support and resistance levels are important concepts in technical analysis for predicting future price movements. Support levels refer to a price level that an asset does not usually fall below, while resistance levels refer to a price level that an asset does not usually surpass. Understanding these levels can be useful in determining entry and exit points for trades.

To identify support and resistance levels on a price chart, traders typically look for areas where the price has previously bounced off or stalled. These areas may correspond with key psychological levels, such as round numbers or previous highs and lows. Additionally, you may use trend lines or moving averages to identify support and resistance levels.
Breakout trading
Breakout trading is a strategy in which a trader takes a position when the price breaks through a support or resistance level. This is based on the idea that once a price level is broken, it may continue to move in that direction. Traders may use various indicators and technical analysis tools to identify price levels for potential breakouts, such as trend lines, moving averages, or chart patterns.
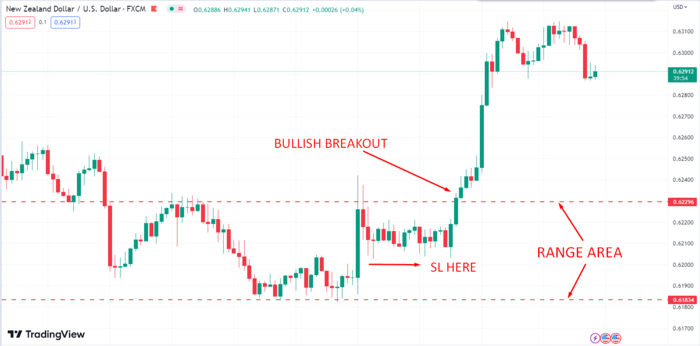
When trading breakouts, managing risk is crucial. Traders may use stop-loss orders to limit potential losses if the trade goes against them. They may also use position sizing to control the amount of capital they risk on any given trade. By identifying clear levels of support and resistance and properly managing risk, breakout traders may be able to take advantage of short-term price movements.
As you start to learn more about trading, it is important to keep in mind that no strategy can guarantee success. It is important to always conduct thorough research and analysis before making any trades. Additionally, consider using a tool like VSTAR to help identify potential opportunities and risks in the market. By combining your knowledge and experience with powerful trading tools, you can increase your chances of success in the markets.
D. Forex Trading Psychology

Forex trading psychology is a crucial component for any trader, as it plays a significant role in determining their success or failure in the market. Trading involves making decisions and executing trades based on analysis, market conditions, and a trader's personal beliefs and biases. Therefore, having the right mindset, discipline, and emotional control is essential to make informed trading decisions consistently.
As a trader, your mindset should be focused on learning, growth, and a willingness to accept losses as part of the process. Developing discipline and sticking to a trading plan is also crucial, as it helps to avoid impulsive and emotional trades that can lead to significant losses.
Developing a Forex Trading Plan

Developing a forex trading plan is equally important for traders. It helps to establish a clear roadmap for their trading activities, ensuring that they adhere to specific strategies, risk management plans, and trading methodologies. A trading plan should have clear components, including a well-defined strategy, a risk management plan, a trading methodology, and tools for trading and record-keeping.
Implementing and tracking a trading plan is critical, as it helps monitor their progress and adjust accordingly. Having a trading plan provides structure and discipline to trading activities, ensuring that traders remain focused on their goals and avoid impulsive and emotional trading decisions.
Forex brokers play an important role in the trading journey. Therefore, finding the best broker with the maximum fund safety is mandatory.
Speaking of the features and user interface, VSTAR enters this discussion. VSTAR is a state-of-the-art forex trading platform that provides advanced trading features and user-friendly interfaces. With VSTAR, traders can access real-time market data, trade on-the-go, and enjoy a seamless trading experience. Moreover, VSTAR advanced features include Artificial Intelligence-based trading signals and risk management tools.
Conclusion
This Ultimate Guide to Forex Trading for Beginners has covered the basics of forex trading, including understanding the market, trading psychology, and developing a trading plan. It is important to keep in mind the tips for success in forex trading, such as managing risk, staying disciplined, and continuing education. Resources for continuing education include online courses, webinars, and trading communities. With dedication and patience, anyone can become a successful forex trader.
*Disclaimer: The content of this article is for learning purposes only and does not represent the official position of VSTAR, nor can it be used as investment advice.