Introduction
In gas Contract for Difference (CFD) trading, technical analysis plays a crucial role in making informed trading decisions. Technical analysis involves the study of historical price and volume data to identify patterns and trends, allowing traders to anticipate future price movements. By leveraging historical data and indicators, traders can identify trends, support and resistance levels, and generate valuable trading signals.
One key benefit of technical analysis in gas CFD trading is its ability to identify support and resistance levels. These levels represent price points where the market is likely to experience buying or selling pressure, providing traders with entry and exit points for their trades. Additionally, technical analysis helps identify trend reversals, allowing traders to capitalize on potential profit opportunities.
Basics of Technical Analysis
To fully understand the importance of technical analysis in gas CFD trading, it is essential to grasp the basics of this analytical approach. Technical analysis is based on the principle that historical price and volume data can provide valuable insights into future price movements.
Incorporating these principles, charts, and indicators, technical analysis empowers you as a gas CFD trader with a systematic approach to analyzing market trends. It provides a framework for understanding price dynamics, identifying key levels, and generating trading signals.
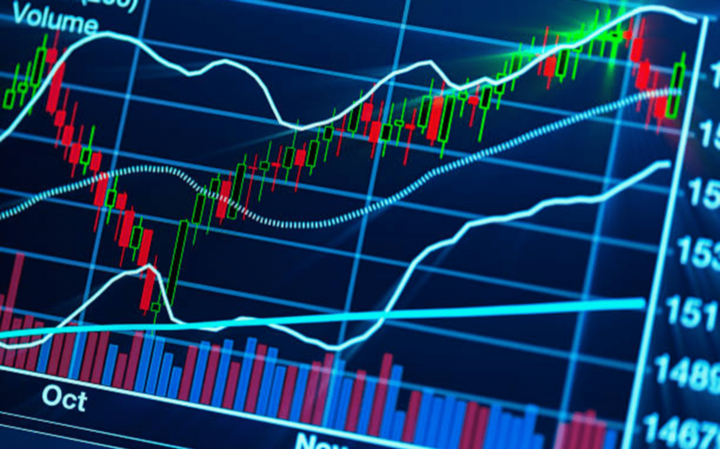
Image Source: Unsplash
Principles of Technical Analysis
Technical analysis is a method of predicting financial market trends by analyzing historical price and volume data. It relies on principles such as trend analysis, support and resistance levels, chart patterns, and indicators to make informed investment decisions.
Trend Analysis: Technical analysts study price patterns to identify trends, such as uptrends, downtrends, and sideways movements. This helps to determine the direction in which prices are likely to move.
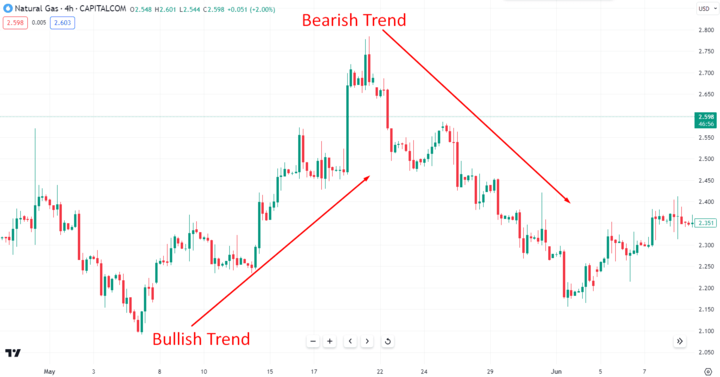
Image Source: TradingView
Support and Resistance: Support levels represent price points where buying pressure is expected, while resistance levels indicate areas of selling pressure. These levels can assist traders in making decisions regarding entry and exit points.
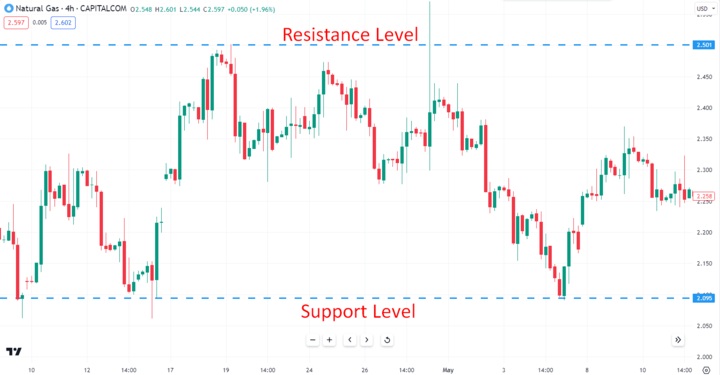
Image Source: TradingView
Chart Patterns: Recognizing formations, such as triangles, head and shoulders, and double tops or bottoms, which can indicate potential trend reversals or continuations.
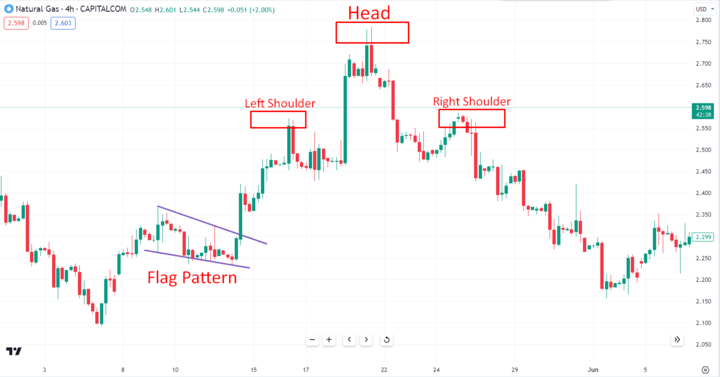
Image Source: TradingView
Types of Charts Used in Technical Analysis
Commonly, The types of charts commonly used in technical analysis are line charts, bar charts, and candlestick charts. These charts display price and volume data over time and provide visual representations that aid in identifying patterns and trends in financial markets.
Line Charts: These charts are the simplest and display the closing prices of an asset over a specific period. They connect the closing prices with a line, providing a basic overview of price trends.
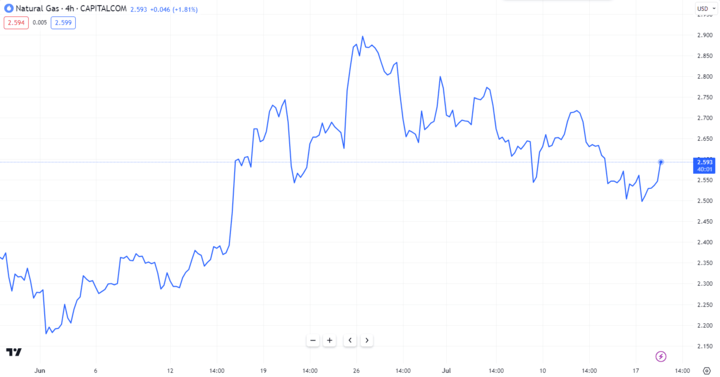
Image Source: TradingView
Bar Charts: Bar charts illustrate the high, low, opening, and closing prices of an asset within a given period. Each bar represents a specific time frame and provides a visual representation of price ranges and market volatility.
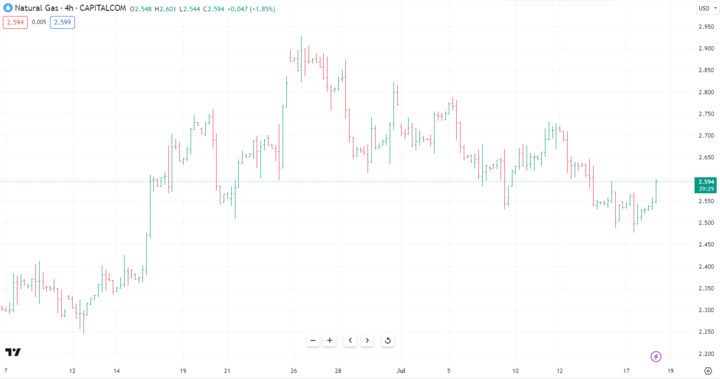
Image Source: TradingView
Candlestick Charts: Candlestick charts provide more detailed information by incorporating color-coded candlestick shapes. Each candlestick represents a specific time frame and displays the opening, closing, high, and low prices. The color of the candlestick indicates whether the price increased (green or white) or decreased (red or black).
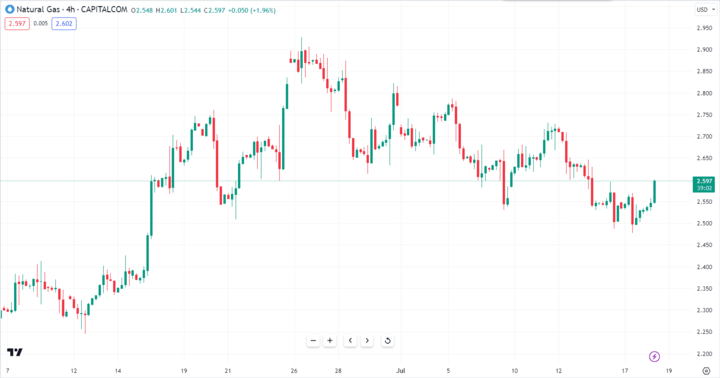
Image Source: TradingView
Key Technical Indicators Used in Gas CFD Trading
Moving Averages, RSI (Relative Strength Index), and Bollinger Bands, are key technical indicators used in gas CFD trading. These indicators help identify trends, overbought/oversold conditions, volatility, and potential support/resistance levels.
Moving Averages (MA): Moving averages smooth out price data and help identify trends by calculating the average price over a specified period. They provide insights into support and resistance levels.
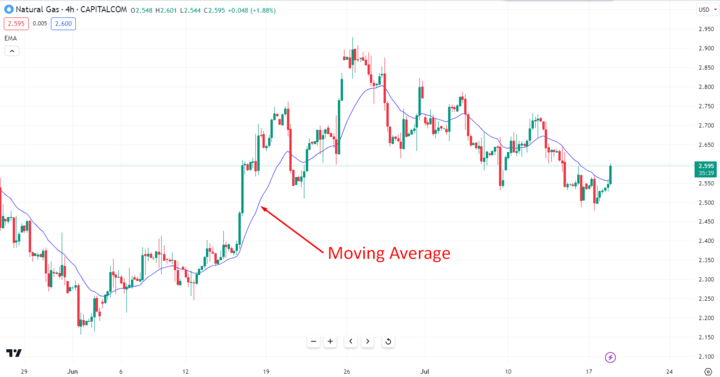
Image Source: TradingView
Relative Strength Index (RSI): The RSI measures the magnitude of recent price changes to determine overbought or oversold conditions. It helps identify potential trend reversals and market turning points.
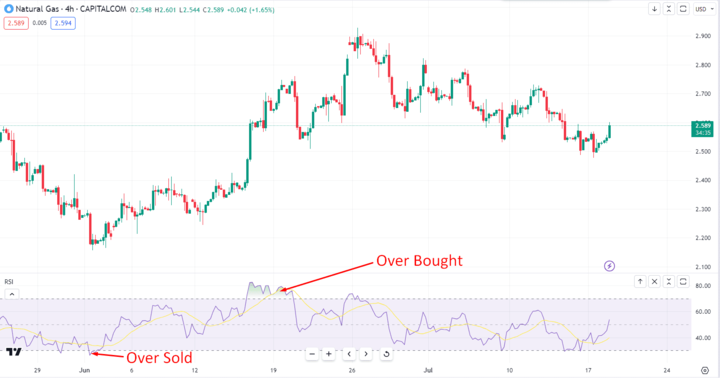
Image Source: TradingView
Bollinger Bands: Bollinger Bands consist of an upper and lower band plotted around a moving average. They represent volatility levels and can signal potential breakouts or reversals when the price touches or exceeds the bands.
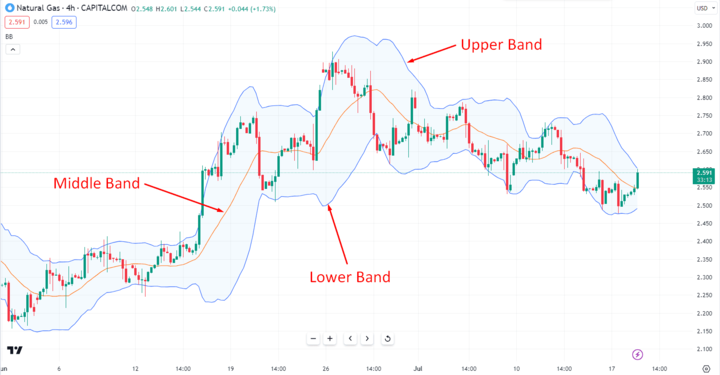
Image Source: TradingView
Gas CFD Trading Strategies Using Technical Analysis
Technical analysis for gas CFD will offer you a wide range of strategies to analyze market trends and increase the chances of profitability. These strategies often combine multiple strategies and you may adapt to specific market conditions. Here are some popular trading strategies that leverage technical analysis:
Trend Trading Strategy: This strategy focuses on identifying and following the prevailing market trend. Traders look for patterns such as higher highs and higher lows in an uptrend or lower highs and lower lows in a downtrend. By entering trades in the direction of the trend, traders aim to capture substantial price moves.
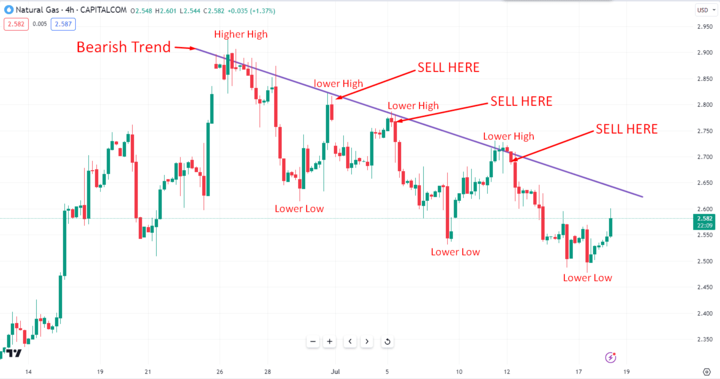
Image Source: TradingView
Breakout Trading Strategy: This strategy involves identifying key levels of support and resistance and entering trades when the price breaks above resistance or below support. Breakouts can signal the start of new trends or the continuation of existing ones. Traders often use volume and momentum indicators to confirm breakouts.
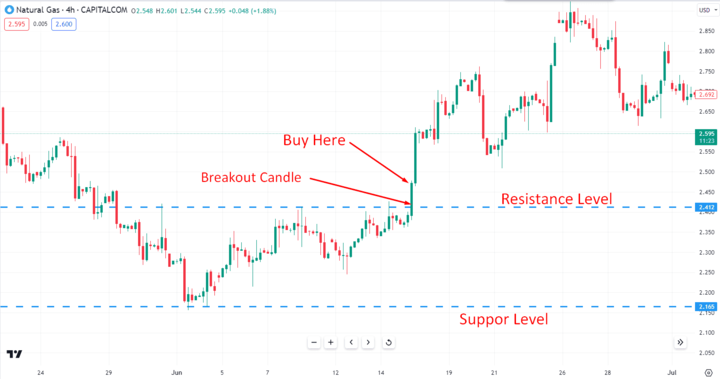
Image Source: TradingView
Support and Resistance Trading Strategy: Support and resistance levels are price levels where the market has historically shown buying or selling pressure. Traders use these levels to identify potential entry and exit points. Buying near support and selling near resistance can be an effective strategy when combined with other technical analysis tools.
Image Source: TradingView
Moving Average Trading Strategy: Moving averages are trend-following indicators that smooth out price data over a specific period. Traders use moving averages to identify the overall direction of the market and generate trading signals. For example, a crossover between a shorter-term moving average and a longer-term moving average can indicate a potential trend reversal.
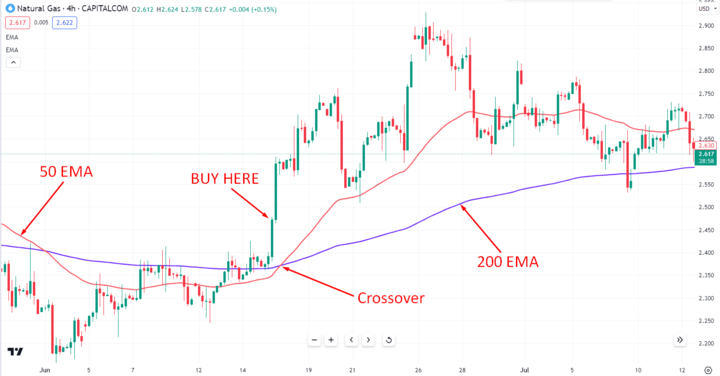
Image Source: TradingView
Fibonacci Trading Strategy: Fibonacci retracement levels are based on the mathematical sequence discovered by Leonardo Fibonacci. Traders use these levels to identify potential support and resistance levels based on the natural retracement of price after a significant move. Fibonacci retracements can help traders anticipate price reversals or areas of price consolidation.
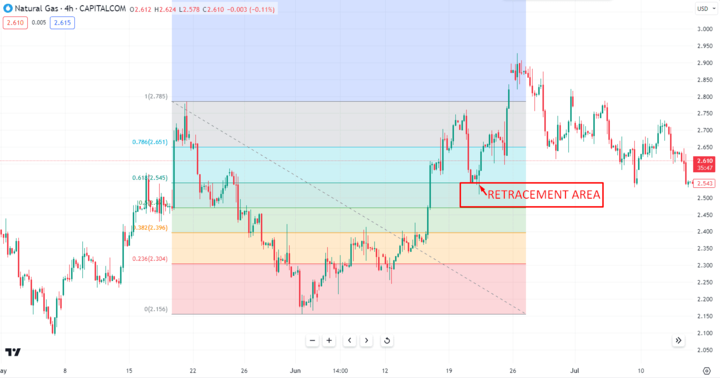
Image Source: TradingView
Gas CFD Trading Platforms and Technical Analysis Tools
Gas CFD trading platforms provide powerful tools and features to perform technical analysis effectively. These platforms are designed to offer comprehensive market analysis capabilities and customizable tools that cater to the specific needs of gas CFD traders.
Utilizing gas CFD trading platforms and their robust technical analysis tools, allow you to gain a competitive edge in the market. These platforms provide access to real-time data and comprehensive analysis capabilities. It is essential to explore the features and capabilities of different trading platforms to find one that aligns with your trading requirements and offers the technical analysis tools you need.

Image Source: Unsplash
Here's an overview of gas CFD trading platforms and the technical analysis tools they offer:
Overview of Gas CFD Trading Platforms
Gas CFD trading platforms are online platforms that facilitate the buying and selling of gas CFDs. These platforms provide real-time market data, charting functionality, order execution capabilities, and access to a range of technical analysis tools. They enable you to monitor market conditions, analyze price movements, and execute trades swiftly.
Technical Analysis Tools Available on Gas CFD Trading Platforms
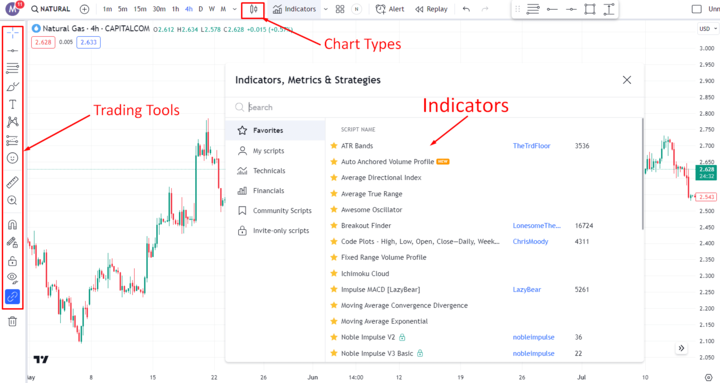
Image Source: TradingView
Gas CFD trading platforms offer a wide array of technical analysis tools to assist you in the decision-making process. These tools include various chart types (line, bar, candlestick), drawing tools (trendlines, channels, Fibonacci retracements), and indicators (moving averages, oscillators, volume-based indicators). These tools can be used to identify patterns, trends, support, and resistance levels, and generate trading signals.
Customization of Technical Analysis Tools on Gas CFD Trading Platforms
Gas CFD trading platforms often allow traders to customize their technical analysis tools to suit their trading strategies and preferences. You can adjust the parameters of indicators, apply different timeframes to charts, and save personalized chart templates. This customization enables you to adapt the platform to your unique trading style and improve your analysis accuracy.
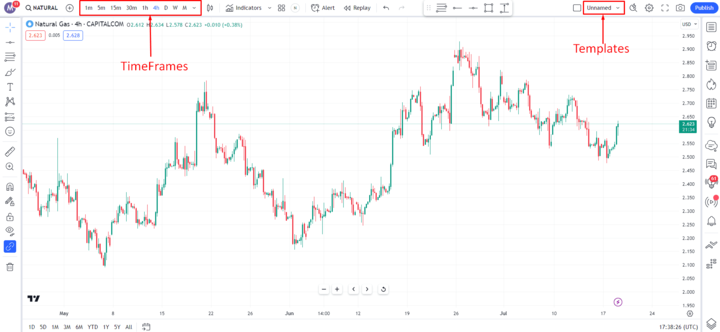
Image Source: TradingView
Gas CFD Trading and Fundamental Analysis
Gas Contract for Difference (CFD) trading involves not only technical analysis but also fundamental analysis. While technical analysis focuses on price patterns and market trends, fundamental analysis considers the underlying factors that drive the gas market. Here's why combining both approaches is crucial in gas CFD trading:
Differences between Technical Analysis and Fundamental Analysis
Technical analysis relies on historical price data and indicators to predict future price movements, while fundamental analysis examines economic, geopolitical, and market-specific factors that influence gas prices. Technical analysis focuses on timing trades based on price patterns, while fundamental analysis helps understand the broader market dynamics.

Image Source: Unsplash
Importance of Combining Technical and Fundamental Analysis in Gas CFD Trading
Combining technical and fundamental analysis gains you a more comprehensive understanding of the gas market. Technical analysis provides entry and exit points, while fundamental analysis offers insights into long-term market trends, supply and demand dynamics, geopolitical events, and industry news. This combined approach helps to make well-informed trading decisions.
Examples of Gas CFD Trading Strategies using both Technical and Fundamental Analysis
You can incorporate both approaches by using technical analysis for short-term trades and fundamental analysis for long-term positioning. For example, technical analysis can be used to identify short-term trends and generate trading signals, while fundamental analysis can help identify major market shifts or events that may impact gas prices in the long run.
Combining technical and fundamental analysis can provide better navigation to the complexities of the gas market and enhance your trading strategies. It is essential to stay updated with the latest market news, economic indicators, and industry developments to make informed decisions considering technical and fundamental factors.
Risks and Limitations of Technical Analysis in Gas CFD Trading
While technical analysis is a valuable tool in gas CFD trading, it is important to recognize its limitations and the associated risks. Here are some key points to consider:
Limitations of Technical Analysis
Technical analysis is based on historical price data, which may not always accurately reflect future market conditions. It cannot account for unexpected events, sudden market shifts, or other external factors impacting gas prices. Additionally, technical analysis tools are subjective and require interpretation, which can introduce bias and lead to incorrect analysis.
Risks of relying solely on Technical Analysis in Gas CFD Trading
Relying solely on technical analysis without considering fundamental factors can be risky. Market sentiments and economic indicators can have a significant impact on gas prices. Ignoring these factors may result in missed opportunities or incorrect trading decisions.
Importance of Risk Management in Gas CFD Trading
It is crucial to incorporate proper risk management strategies to mitigate the risks associated with technical analysis. This includes setting stop-loss orders, diversifying portfolios, and managing position sizes. Risk management helps protect traders from substantial losses and ensures long-term profitability.
How to Succeed with Technical Analysis in Gas CFD Trading
Successful gas CFD trading requires combining technical analysis, fundamental analysis, risk management, and a disciplined approach. Developing a trading plan, using multiple indicators, staying informed about market news, and practicing proper risk management strategies is important. By incorporating these principles and continuously improving your skills, you can confidently navigate the dynamic gas CFD market and strive for consistent profitability.
Here are some tips to help you maximize the benefits of technical analysis:
Develop a Trading Plan: Create a well-defined trading plan that outlines your goals, risk tolerance, and trading strategies. A trading plan helps you stay disciplined and avoid impulsive decisions based on emotions.
Use Multiple Technical Indicators: Utilize a combination of technical indicators to confirm signals and validate your analysis. Using multiple indicators can provide a more comprehensive view of market conditions and increase the accuracy of your trading decisions.
Keep an Eye on Market News and Events: Stay updated with relevant market news, economic indicators, and events that can impact gas prices. Fundamental factors can influence the effectiveness of technical analysis, so incorporating fundamental analysis alongside technical analysis is essential.
Practice Proper Risk Management: Implement sound risk management strategies, such as setting appropriate stop-loss orders, diversifying your portfolio, and managing position sizes. Risk management helps protect your capital and preserve long-term profitability.
Continuously Learn and Improve: The field of technical analysis is constantly evolving. Stay curious and committed to learning. Attend webinars, read books, follow industry experts, and analyze your past trades to identify areas for improvement.


Conclusion
Technical analysis plays a vital role in gas CFD trading, providing traders with valuable insights into market trends and price movements, making them informed trading decisions and increasing their chances of profitability.
Continuous learning and improvement are key in gas CFD trading. The field of technical analysis is ever-evolving, and staying updated with the latest market trends, refining trading strategies, and expanding knowledge is essential for success.