The Relative Strength Index (RSI) is a technical analysis indicator used to measure the strength of price movements of a financial instrument. RSI is a momentum oscillator that compares the magnitude of recent gains to recent losses, indicating overbought or oversold conditions.
The Relative Strength Index is a powerful technical analysis tool that can provide valuable insights into market conditions and help traders make informed decisions. By understanding the history and calculation of RSI and its key features, you can apply this tool to your trading strategies confidently. Whether you're a beginner or an experienced trader, mastering RSI can help you stay ahead of the market and achieve your financial goals.
If you're interested in mastering the financial market, you need to know about the Relative Strength Index (RSI). In this ultimate guide, we'll cover everything you need to know to use the RSI effectively.
What is RSI?
Welles Wilder developed the Relative Strength Index in the late 1970s as a momentum oscillator that measures the speed and change of price movements. It is a widely used technical analysis tool that can be applied to various financial instruments, including stocks, commodities, and forex.
RSI is calculated using a mathematical formula that compares a stock's average gain and loss over a set period.
The formula for RSI is, RSI = 100 - (100 / (1 + RS)),
Where RS is the average gain divided by the average loss over a set period of time. The default period used for RSI calculation is typically 14 days, but traders can adjust this to suit their preferences.
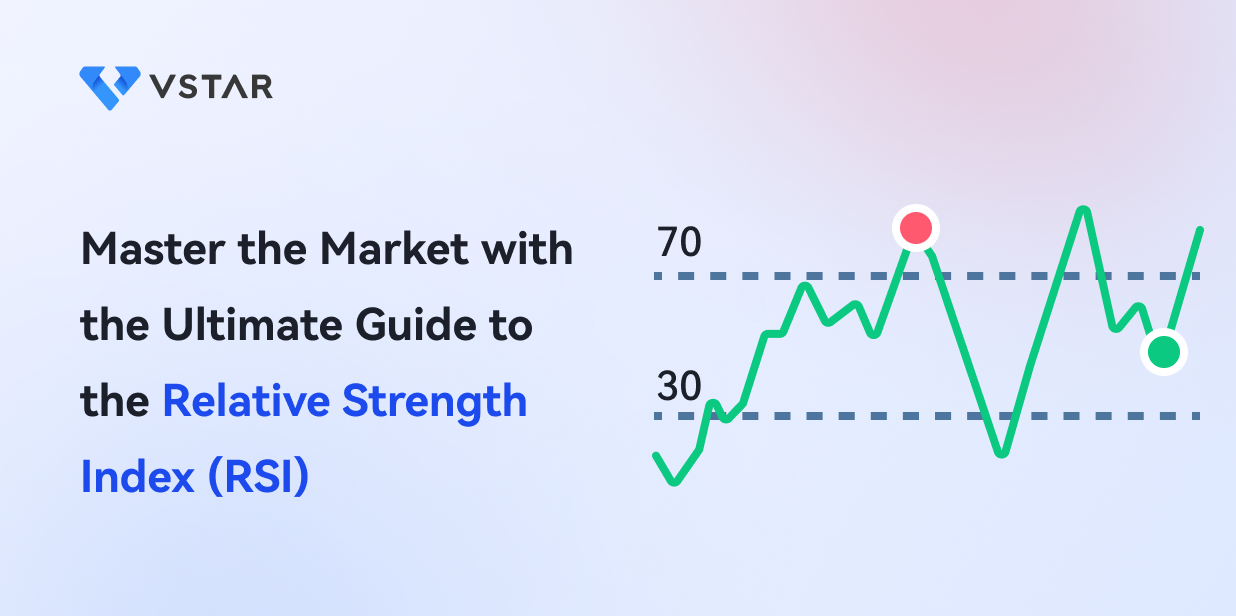
One of the key features of RSI is that it ranges from 0 to 100, with levels above 70 indicating overbought conditions and levels below 30 indicating oversold conditions. Traders often use these levels as signals to buy or sell, depending on the direction of the trend. RSI can also be used to identify divergences between the indicator and price movements, which can signal potential trend reversals.
In addition to these features, RSI can be customized with different timeframes and settings to suit different trading strategies. For example, you may use a shorter time frame for RSI to identify short-term trading opportunities, while a longer timeframe may be more suitable for long-term investments.
Understanding RSI signals
Understanding RSI signals, including how they are interpreted and identifying overbought and oversold thresholds, can help you use them effectively. However, you should not rely solely on RSI signals but use them in conjunction with other technical indicators to confirm signals and improve their trading strategy.
One of the most significant benefits of the RSI is its ability to provide clear buy and sell signals. When the RSI reaches certain levels, it can signal an overbought or oversold market condition. Traders use these signals to time their trades and make informed decisions about buying or selling an asset.
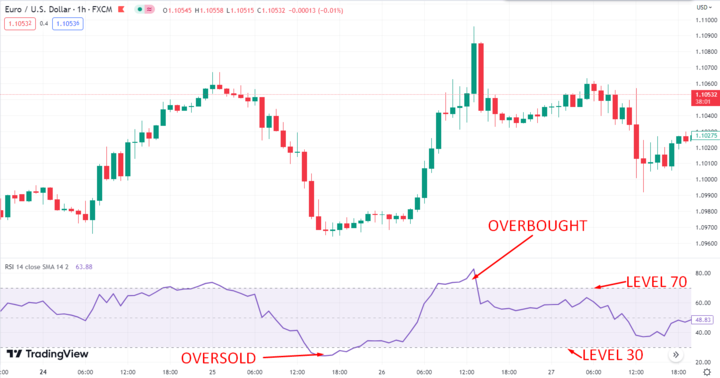
The RSI signals are interpreted based on the RSI levels. When the RSI is above 70, it is considered overbought; when it is below 30, it is considered oversold.
The RSI can signal a potential trend reversal when it crosses these levels. For example, if the RSI is above 70, and then crosses below 70, it signals a potential trend reversal from bullish to bearish. Similarly, if the RSI is below 30, and then crosses above 30, it signals a potential trend reversal from bearish to bullish.
Identifying the overbought and oversold signal thresholds is crucial for traders using the RSI. The standard overbought and oversold levels are 70 and 30, respectively. However, traders can adjust these levels according to their trading style, timeframe, and the asset they are trading. For instance, if a trader is trading a volatile asset, they may use a higher RSI level, such as 80, as the overbought threshold and a lower level, such as 20, as the oversold threshold.
Similarly, if a trader is trading a less volatile asset, they may use a lower RSI level, such as 60, as the overbought threshold, and a higher level, such as 40, as the oversold threshold.
Although RSI signals can be useful in timing trades, RSI signals can produce false signals, especially in a volatile market, leading to losses. Therefore, you should use RSI signals in conjunction with other technical indicators, such as Moving Averages and Fibonacci retracements, to confirm signals and improve their trading strategy.
RSI strategies for traders

As we've previously discussed, RSI is a momentum oscillator that measures the magnitude of recent price changes and can help traders determine whether a security is overbought or oversold. But how exactly can you use RSI to make trades?
In this section, we'll explore some popular RSI strategies that you may use to identify trend reversals, trading ranges, and other profitable opportunities. By incorporating these strategies, you can increase your chances of making profitable trades.
A. Using RSI to identify trend reversals
One of the most popular RSI strategies for traders is identifying trend reversals. There are two ways to do this: divergence and failure swings.
1. Using divergence
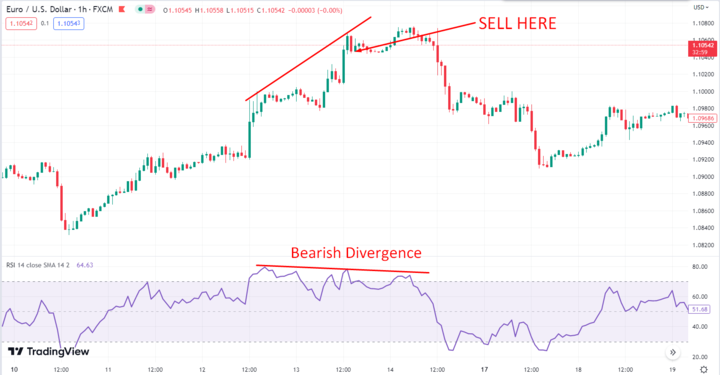
RSI divergence occurs when the price of a security moves in the opposite direction of the RSI. This signals that the trend is losing momentum and could be reversing.
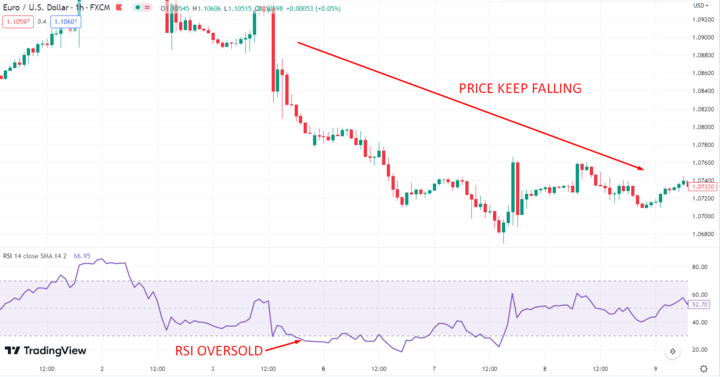
For example, if the price of a trading instrument is making higher highs, but the RSI is making lower highs, this is a bearish divergence and could indicate that the stock is about to fall. Conversely, if the price is making lower lows, but the RSI is making higher lows, this is a bullish divergence and could be a sign that the stock is about to rise.
2. Using failure swings
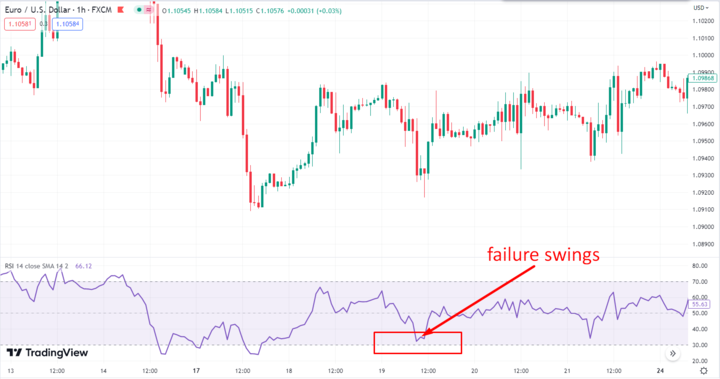
A failure swing occurs when the RSI fails to surpass a previous high or low, and then moves in the opposite direction. This is another signal that the trend is losing momentum and could be reversing.
For example, if the RSI rises above 70, falls below 70, and then rises again but fails to surpass 70, this is a bearish failure swing and could indicate that the stock is about to fall.
Conversely, if the RSI falls below 30, rises back above 30, and then falls again but fails to drop below 30, this is a bullish failure swing and could be a sign that the stock is about to rise.
B. Using RSI to identify trading ranges
Another RSI strategy for traders is using it to identify trading ranges. This involves identifying support and resistance levels and looking for breakouts.
1. Identifying support and resistance levels
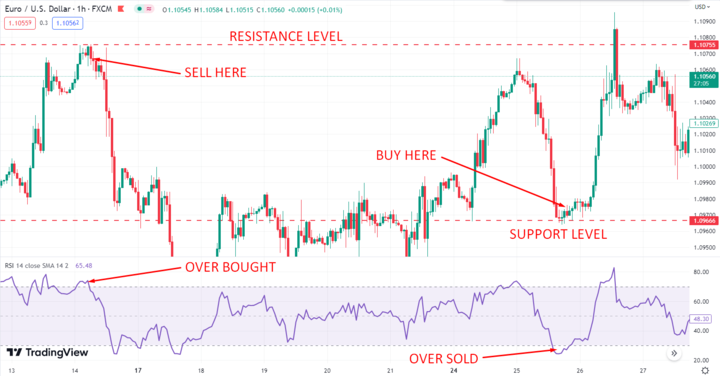
One way to use RSI to identify trading ranges is to look for support and resistance levels. When the RSI reaches 30 or lower, this could be a signal that the stock is oversold and due for a bounce.
Conversely, when the RSI reaches 70 or higher, this could be a signal that the stock is overbought and due for a pullback. By identifying these levels, you can look for opportunities to buy or sell a security.
2. Identifying breakouts
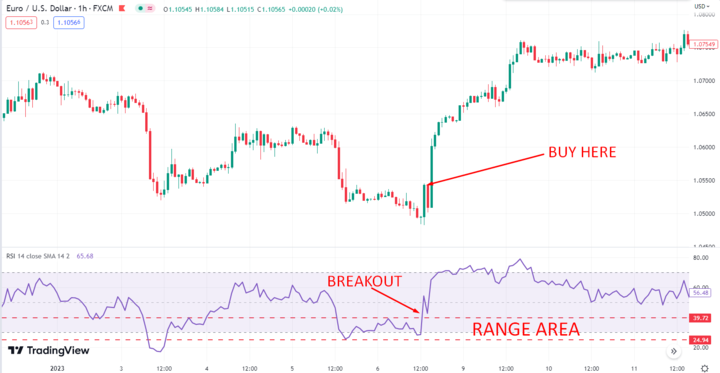
Another way to use RSI to identify trading ranges is to look for breakouts. When the RSI is trading within a range for an extended period, this could indicate a consolidation pattern. If the RSI breaks out of this range, it could be a sign of a new trend forming. You can look for opportunities to enter a position in the direction of the breakout.
Using RSI with other technical indicators
You can also use the RSI and other technical indicators to increase the chances of making profitable trades.
1. Combining RSI with moving averages

One way to enhance the accuracy of RSI signals is to combine them with other technical indicators, such as moving averages.
For example, a trader could use a 50-day moving average to confirm RSI signals. This could be a bullish signal if the RSI is above 50 and the price is above the 50-day moving average. Conversely, this could be a bearish signal if the RSI is below 50 and the price is below the 50-day moving average.
2. Combining RSI with Bollinger Bands
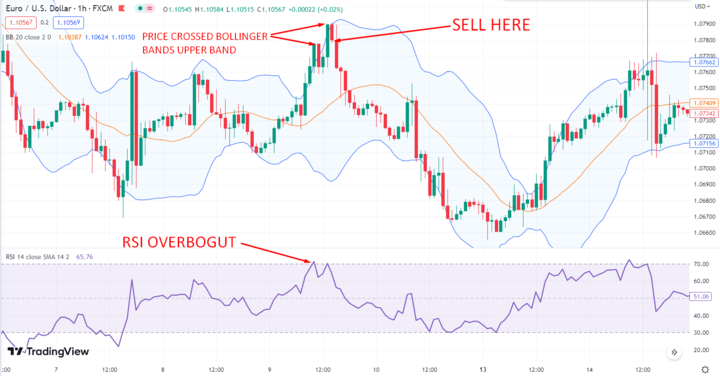
This strategy involves using the upper and lower bands of Bollinger Bands to identify overbought and oversold levels in combination with RSI levels.
For example, a bullish signal would occur when the price touches or moves below the lower band of the Bollinger Bands while RSI is oversold. A bearish signal would occur when the price touches or moves above the upper band of the Bollinger Bands, while RSI is overbought.
Tips and tricks for using RSI effectively

To master the market and improve your trading strategies there is no further than the Relative Strength Index (RSI), a technical analysis tool that can help identify when to buy or sell stocks. But how do you use RSI effectively?
Here are some tips and tricks to set the right parameters and avoid common pitfalls.
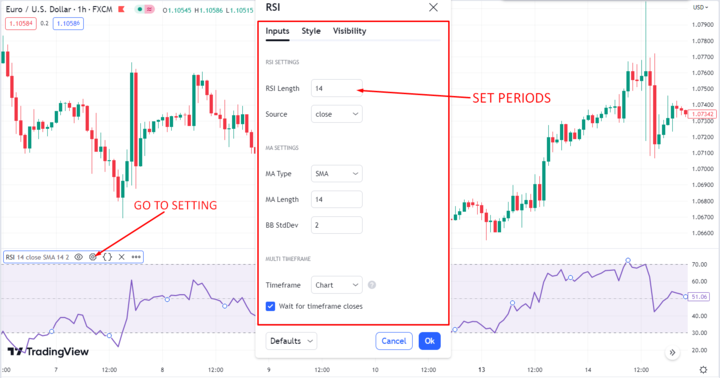
A. Setting the right parameters
First, set the right time periods. RSI calculates a stock's strength relative to its price history, typically over 14 periods. However, this can be adjusted to suit your preferences and time horizon.
Shorter periods, such as 7 or 10, can provide more timely signals but may be more volatile. On the other hand, longer periods, such as 20 or 30, may provide more stable signals but may be slower to react.
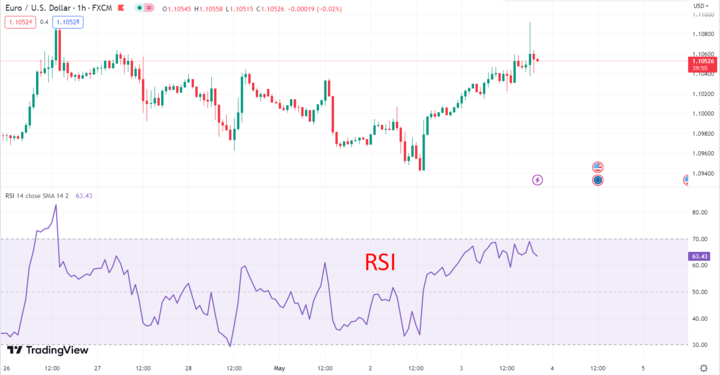
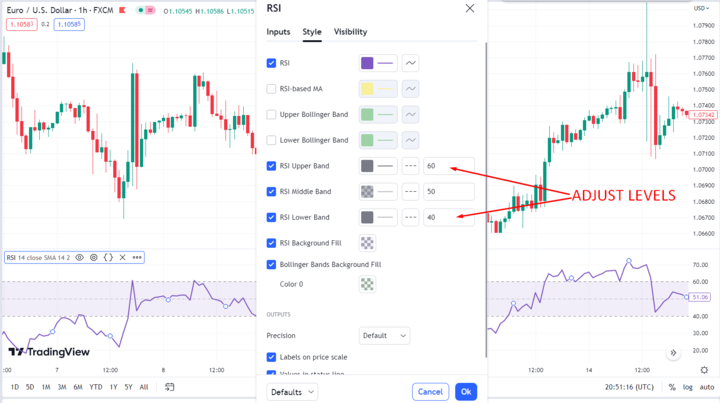
Second, find the right signal thresholds. RSI is typically displayed as a line graph ranging from 0 to 100, with overbought and oversold levels set at 70 and 30, respectively. However, these levels can be adjusted depending on market conditions and the volatility of the stock you're trading.
For example, you may want to lower the overbought level to 65 or even 60 if the market is particularly bullish or raise the oversold level to 35 or 40 if the stock is particularly volatile.
B. Avoiding common pitfalls
It's also important to avoid common pitfalls when using RSI. First, avoid false signals by waiting for confirmation from other indicators or price action. For example, if RSI indicates a stock is oversold but the stock continues to decline, wait for a reversal pattern or a bullish divergence with another indicator before taking a buy position.
Second, don't rely solely on RSI to make trading decisions. RSI is just one tool in your trading arsenal and should be used in conjunction with other technical and fundamental analysis tools.
By setting the right parameters and avoiding common pitfalls, you can effectively use RSI to improve your trading strategies and master the market. Remember to always conduct thorough research and analysis before making any trading decisions through a reliable platform like VSTAR. With these tips and tricks, you can become a successful trader and achieve your financial goals.
Conclusion
Mastering the Relative Strength Index (RSI) can greatly enhance your trading skills and help you make more informed decisions. We have covered the key concepts of RSI, including how it is calculated and how to interpret its signals.
It is important to note that while RSI is a useful tool, it should not be used in isolation. It is recommended to use RSI in combination with other technical analysis tools and fundamental analysis to get a more comprehensive understanding of market trends.
Understanding RSI signals is a valuable skill for traders of all levels. By keeping these tips and tricks in mind and practicing with real market data, you can improve your trading strategies and master the market with confidence. So, start using RSI today and take your trading to the next level.